Table of Contents (Start)
- Topics
- Introducing SevOne
- Login
- Startup Wizard
- Dashboard
- Global Search - Advanced Search
- Report Manager
- Report Attachment Wizard
- Report Properties
- Report Interactions
- Instant Graphs
- TopN Reports
- Alerts
- Alert Archives
- Alert Summary
- Instant Status
- Status Map Manager
- Edit Maps
- View Maps
- FlowFalcon Reports
- NBAR Reports
- Logged Traps
- Unknown Traps
- Trap Event Editor
- Trap Destinations
- Trap Destination Associations
- Policy Browser
- Create and Edit Policies
- Webhook Definition Manager
- Threshold Browser
- Create and Edit Thresholds
- Probe Manager
- Discovery Manager
- Device Manager
- New Device
- Edit Device
- Object Manager
- High Frequency Poller
- Device Summary
- Device Mover
- Device Groups
- Object Groups
- Object Summary
- Object Rules
- VMware Browser
- AWS Plugin
- Azure Plugin (Public Preview)
- Calculation Plugin
- Database Manager
- Deferred Data Plugin
- DNS Plugin
- HTTP Plugin
- ICMP Plugin
- IP SLA Plugin
- JMX Plugin
- NAM
- NBAR Plugin
- Portshaker Plugin
- Process Plugin
- Proxy Ping Plugin
- SDWAN Plugin
- SNMP Plugin
- VMware Plugin
- Web Status Plugin
- WMI Plugin
- xStats Plugin
- Indicator Type Maps
- Device Types
- Object Types
- Object Subtype Manager
- Calculation Editor
- xStats Source Manager
- User Role Manager
- User Manager
- Session Manager
- Authentication Settings
- Preferences
- Cluster Manager
- Maintenance Windows
- Processes and Logs
- Metadata Schema
- Baseline Manager
- FlowFalcon View Editor
- Map Flow Objects
- FlowFalcon Views
- Flow Rules
- Flow Interface Manager
- MPLS Flow Mapping
- Network Segment Manager
- Flow Protocols and Services
- xStats Log Viewer
- SNMP Walk
- SNMP OID Browser
- MIB Manager
- Work Hours
- Administrative Messages
- Enable Flow Technologies
- Enable JMX
- Enable NBAR
- Enable SNMP
- Enable Web Status
- Enable WMI
- IP SLA
- SNMP
- SevOne Data Publisher
- Quality of Service
- Perl Regular Expressions
- Trap Revisions
- Integrate SevOne NMS With Other Applications
- Email Tips and Tricks
- SevOne NMS PHP Statistics
- SevOne NMS Usage Statistics
- Glossary and Concepts
- Map Flow Devices
- Trap v3 Receiver
- Guides
- Quick Start Guides
- AWS Quick Start Guide
- Azure Quick Start Guide (Public Preview)
- Data Miner Quick Start Guide
- Flow Quick Start Guide
- Group Aggregated Indicators Quick Start Guide
- IP SLA Quick Start Guide
- JMX Quick Start Guide
- Metadata Quick Start Guide
- RESTful API Quick Start Guide
- Self-monitoring Quick Start Guide
- SevOne NMS Admin Notifications Quick Start Guide
- SNMP Quick Start Guide
- Synthetic Indicator Types Quick Start Guide
- Topology Quick Start Guide
- VMware Quick Start Guide
- Web Status Quick Start Guide
- WMI Quick Start Guide
- xStats Quick Start Guide
- xStats Adapter - Accedian Vision EMS (TM) Quick Start Guide
- Deployment Guides
- Automated Build / Rebuild (Customer) Instructions
- Generate a Self-Signed Certificate or a Certificate Signing Request
- SevOne Best Practices Guide - Cluster, Peer, and HSA
- SevOne Data Platform Security Guide
- SevOne NMS Implementation Guide
- SevOne NMS Installation Guide - Virtual Appliance
- SevOne NMS Advanced Network Configuration Guide
- SevOne NMS Installation Guide
- SevOne NMS Port Number Requirements Guide
- SevOne NMS Upgrade Process Guide
- SevOne Physical Appliance Pre-Build BIOS and RAID Configuration Guide
- SevOne SAML Single Sign-On Setup Guide
- Cloud Platforms
- Other Guides
- Quick Start Guides
Alert Summary
The Alert Summary enables you to view a summary of alerts and archived alerts for a device group/device type, object group, or device.
To access the Alert Summary from the navigation bar, click the Events menu and select Alert Summary.
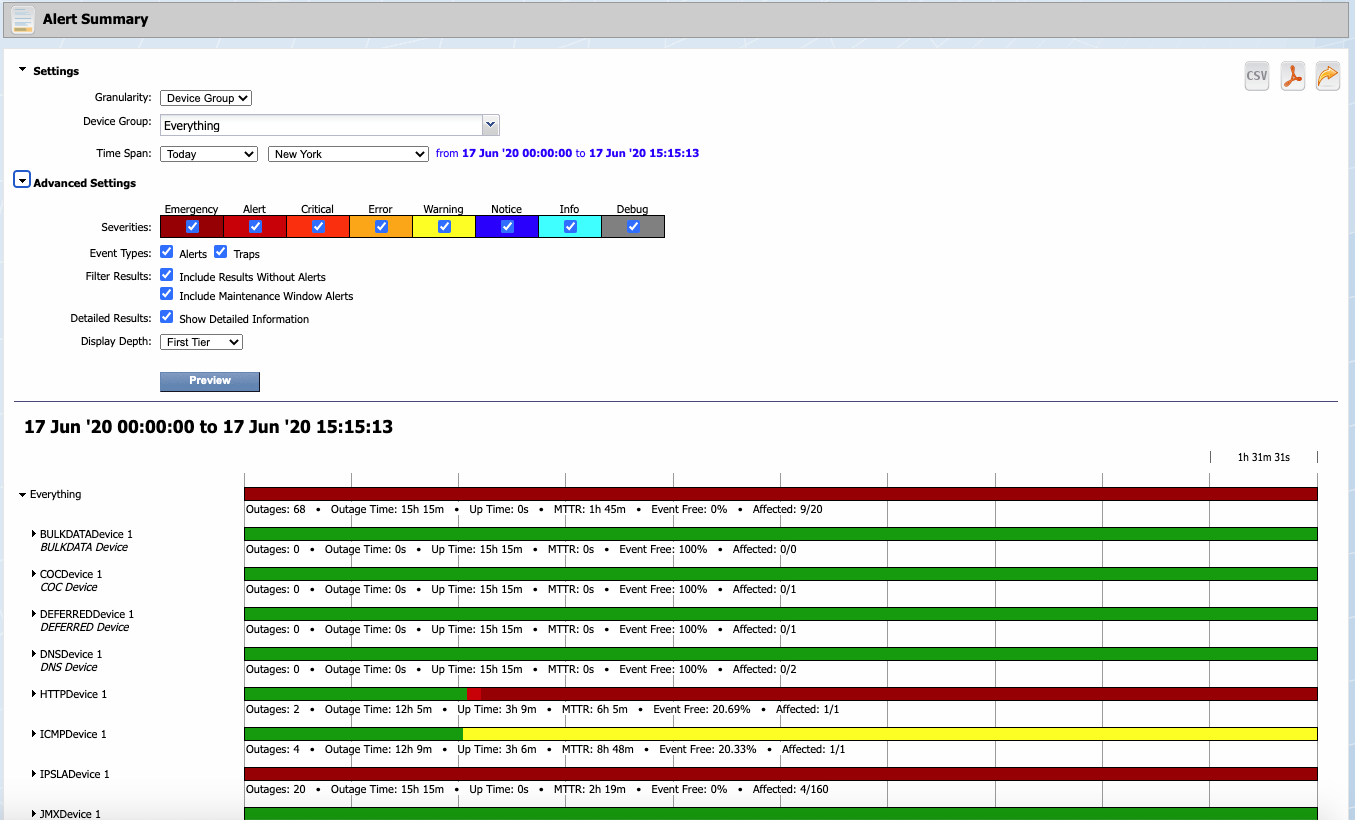
Alert Summary Report Settings
By default, the Alert Summary displays the Alert Summary report for all device groups/device types for a time span of today.
-
Click
 Settings to open the Settings section.
 -
Click the Granularity drop-down.
-
Select Device Group, then click the Device Group drop-down and select the check box for each device group/device type on which to report.
-
Select Object Group, then select the check box for each object group on which to report.
-
Select Device, then click the Device drop-down and select each device on which to report.
-
-
Click the Time Span drop-down and select a time span then select a time zone. The time span displays as a blue font link that you can click to display calendars and clocks that enable you to define a custom time span.
-
Select Today to display data from 12:00am until now.
-
Select Yesterday to display data from 12:00am yesterday until 12:00am today.
-
Select Past 24 Hours to display data from the past 24 hours.
-
Select This Week to display data from Sunday midnight until now.
-
Select Last Week to display data from Sunday midnight to Sunday midnight during the prior week.
-
Select Past 7 Days to display data from the current time seven days ago until the current time today.
-
Select This Month to display data from midnight on the first day of the current month until now.
-
Select Last Month to display data from the first day of the last month to the last day of the last month.
-
Select Past 4 Weeks to display data from the current time four weeks ago until the current time today.
-
Select This Quarter to display data from midnight on the first day of the current quarter until now.
-
Select Last Quarter to display data from the first day of the last quarter to the last day of the last quarter.
-
Select Past 12 Weeks to display data from the current time twelve weeks ago until the current time today.
-
Select This Year to display data from midnight on the first day of the current year until now.
-
Select Last Year to display data from the first day of the last year to the last day of the last year.
-
Select Past 52 Weeks to display data from the current time 52 weeks ago until the current time today.
-
Select Custom to display additional fields to enable you to define the time span.
-
-
Click
Advanced Settings to display additional report settings. -
Select each Severities check box for the alert/trap severities to display in the report.
-
Select the event types to display in the report.
-
Select the Alerts check box to display alerts from thresholds and policies.
-
Select the Traps check box to display alerts from traps for which there is a trap event. For details, please refer to section Trap Event Editor in SevOne NMS System Administration Guide.
-
-
In the Filter Results section, select one or both of the following:
-
Select the Include Results Without Alerts check box to display devices and indicators that have no alerts with a green line and to display a gray line for time spans when a device did not exist within SevOne NMS.
-
Select the Include Maintenance Window Alerts check box to include any alerts that occurred during a maintenance window. If you leave the check box clear, any alerts that occurred within a maintenance window will be excluded from the visualization and the outage calculations.
-
-
In the Detailed Results section, select the Show Detailed Information check box to display following text details below each report line.
-
Incidents - The total number of alerts.
-
Incident Time - The total time in alerts.
-
Up Time - The total time not in alerts.
-
MTTR - The Mean Time To Repair or average incident time.
-
Event Free - The percentage of time without alerts.
-
Affected - The number of affected sub-items and the total number of sub-items.
-
-
Click the Display Depth drop-down. You can click
in the report to display lower tiers. -
First Tier - Select to display alerts at the device group/device type or object group level.
-
Second Tier - Select to display alerts at the device/object level.
-
Third Tier - Select to display alerts at the object level, applicable for device and device group/device type granularity.
-
-
Click Preview.
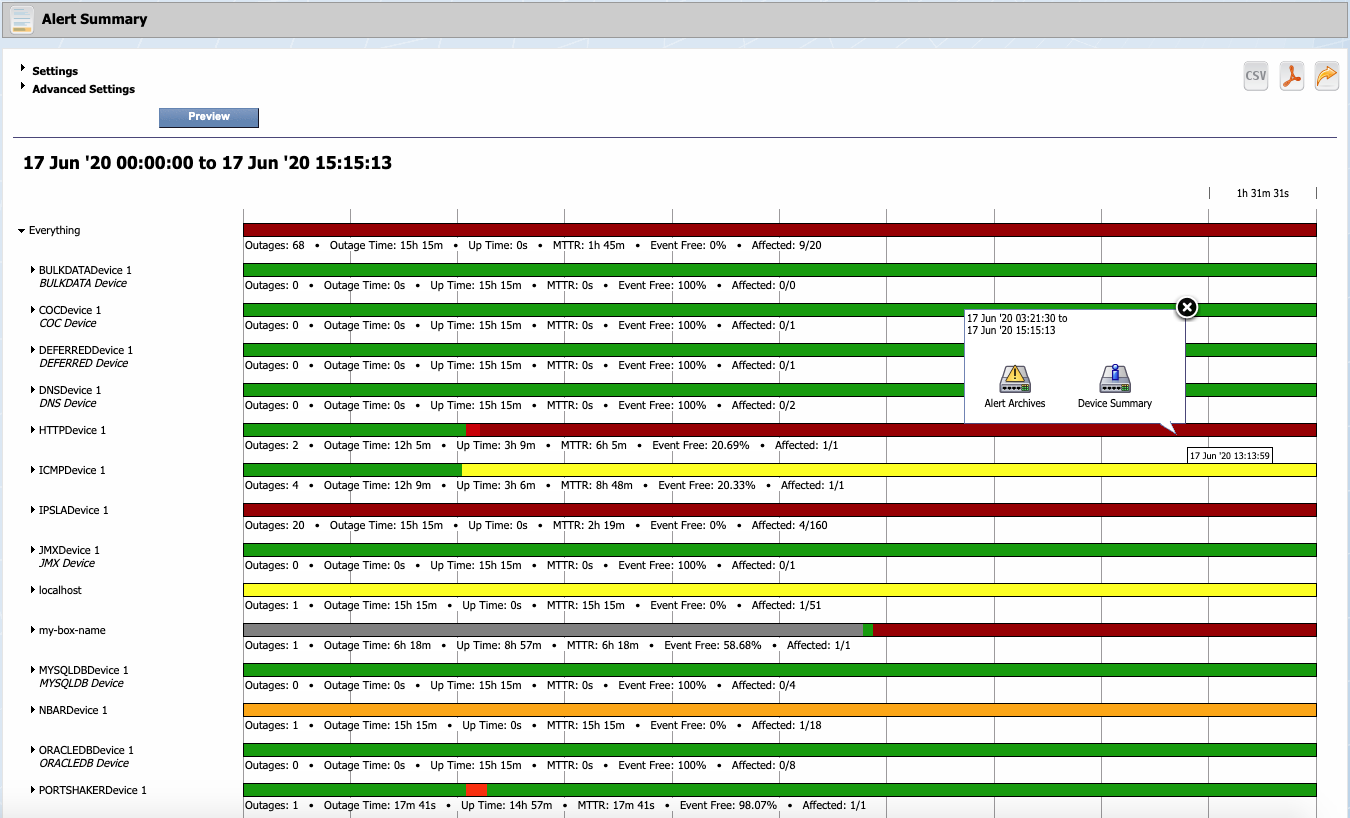
Alert Summary Report Interactions
The Alert Summary report displays a time line for each device or object that meets your filter criteria. The time line contains ten sections whose time frame varies in length depending on the time span you select and the elapsed time of the report.
If you run a report for today at 10:00AM, each time line segment is 60 minutes. If you run a report for today at 11:00AM, each time line segment is 66 minutes. The legend above the segment on the right displays the segment time frame.
-
Move the cursor over the time line to view the exact time of an alert.
-
Click the following icons to export the report.
-
 - Click to export the report to a .csv format.
 -
 - Click to export the report to a .pdf format.
 -
 - Click to add the Alert Summary as an attachment in a report. You can modify reports to add other attachments and you can save reports to the Report Manager. Report workflows enable you to designate reports to be your favorite reports and to define one report to appear as your custom dashboard.
-
-
Click
next to the report captions on the left to drill down to see lower tier results (e.g., for device groups display devices and for devices display objects). -
Click on a time line to display a pop-up that displays the time span of the report.
-
 - Click to access the Alert Archives.
 -
 - For devices, click to display a link to the Device Summary and links to the report templates that are applicable for the device.
 -
 - For objects, click to display a link to the Object Summary and links to the report templates that are applicable to the object.
-