Table of Contents (Start)
- Topics
- Introducing SevOne
- Login
- Startup Wizard
- Dashboard
- Global Search - Advanced Search
- Report Manager
- Report Attachment Wizard
- Report Properties
- Report Interactions
- Instant Graphs
- TopN Reports
- Alerts
- Alert Archives
- Alert Summary
- Instant Status
- Status Map Manager
- Edit Maps
- View Maps
- FlowFalcon Reports
- NBAR Reports
- Logged Traps
- Unknown Traps
- Trap Event Editor
- Trap Destinations
- Trap Destination Associations
- Policy Browser
- Create and Edit Policies
- Webhook Definition Manager
- Threshold Browser
- Create and Edit Thresholds
- Probe Manager
- Discovery Manager
- Device Manager
- New Device
- Edit Device
- Object Manager
- High Frequency Poller
- Device Summary
- Device Mover
- Device Groups
- Object Groups
- Object Summary
- Object Rules
- VMware Browser
- AWS Plugin
- Azure Plugin (Public Preview)
- Calculation Plugin
- Database Manager
- Deferred Data Plugin
- DNS Plugin
- HTTP Plugin
- ICMP Plugin
- IP SLA Plugin
- JMX Plugin
- NAM
- NBAR Plugin
- Portshaker Plugin
- Process Plugin
- Proxy Ping Plugin
- SDWAN Plugin
- SNMP Plugin
- VMware Plugin
- Web Status Plugin
- WMI Plugin
- xStats Plugin
- Indicator Type Maps
- Device Types
- Object Types
- Object Subtype Manager
- Calculation Editor
- xStats Source Manager
- User Role Manager
- User Manager
- Session Manager
- Authentication Settings
- Preferences
- Cluster Manager
- Maintenance Windows
- Processes and Logs
- Metadata Schema
- Baseline Manager
- FlowFalcon View Editor
- Map Flow Objects
- FlowFalcon Views
- Flow Rules
- Flow Interface Manager
- MPLS Flow Mapping
- Network Segment Manager
- Flow Protocols and Services
- xStats Log Viewer
- SNMP Walk
- SNMP OID Browser
- MIB Manager
- Work Hours
- Administrative Messages
- Enable Flow Technologies
- Enable JMX
- Enable NBAR
- Enable SNMP
- Enable Web Status
- Enable WMI
- IP SLA
- SNMP
- SevOne Data Publisher
- Quality of Service
- Perl Regular Expressions
- Trap Revisions
- Integrate SevOne NMS With Other Applications
- Email Tips and Tricks
- SevOne NMS PHP Statistics
- SevOne NMS Usage Statistics
- Glossary and Concepts
- Map Flow Devices
- Trap v3 Receiver
- Guides
- Quick Start Guides
- AWS Quick Start Guide
- Azure Quick Start Guide (Public Preview)
- Data Miner Quick Start Guide
- Flow Quick Start Guide
- Group Aggregated Indicators Quick Start Guide
- IP SLA Quick Start Guide
- JMX Quick Start Guide
- Metadata Quick Start Guide
- RESTful API Quick Start Guide
- Self-monitoring Quick Start Guide
- SevOne NMS Admin Notifications Quick Start Guide
- SNMP Quick Start Guide
- Synthetic Indicator Types Quick Start Guide
- Topology Quick Start Guide
- VMware Quick Start Guide
- Web Status Quick Start Guide
- WMI Quick Start Guide
- xStats Quick Start Guide
- xStats Adapter - Accedian Vision EMS (TM) Quick Start Guide
- Deployment Guides
- Automated Build / Rebuild (Customer) Instructions
- Generate a Self-Signed Certificate or a Certificate Signing Request
- SevOne Best Practices Guide - Cluster, Peer, and HSA
- SevOne Data Platform Security Guide
- SevOne NMS Implementation Guide
- SevOne NMS Installation Guide - Virtual Appliance
- SevOne NMS Advanced Network Configuration Guide
- SevOne NMS Installation Guide
- SevOne NMS Port Number Requirements Guide
- SevOne NMS Upgrade Process Guide
- SevOne Physical Appliance Pre-Build BIOS and RAID Configuration Guide
- SevOne SAML Single Sign-On Setup Guide
- Cloud Platforms
- Other Guides
- Quick Start Guides
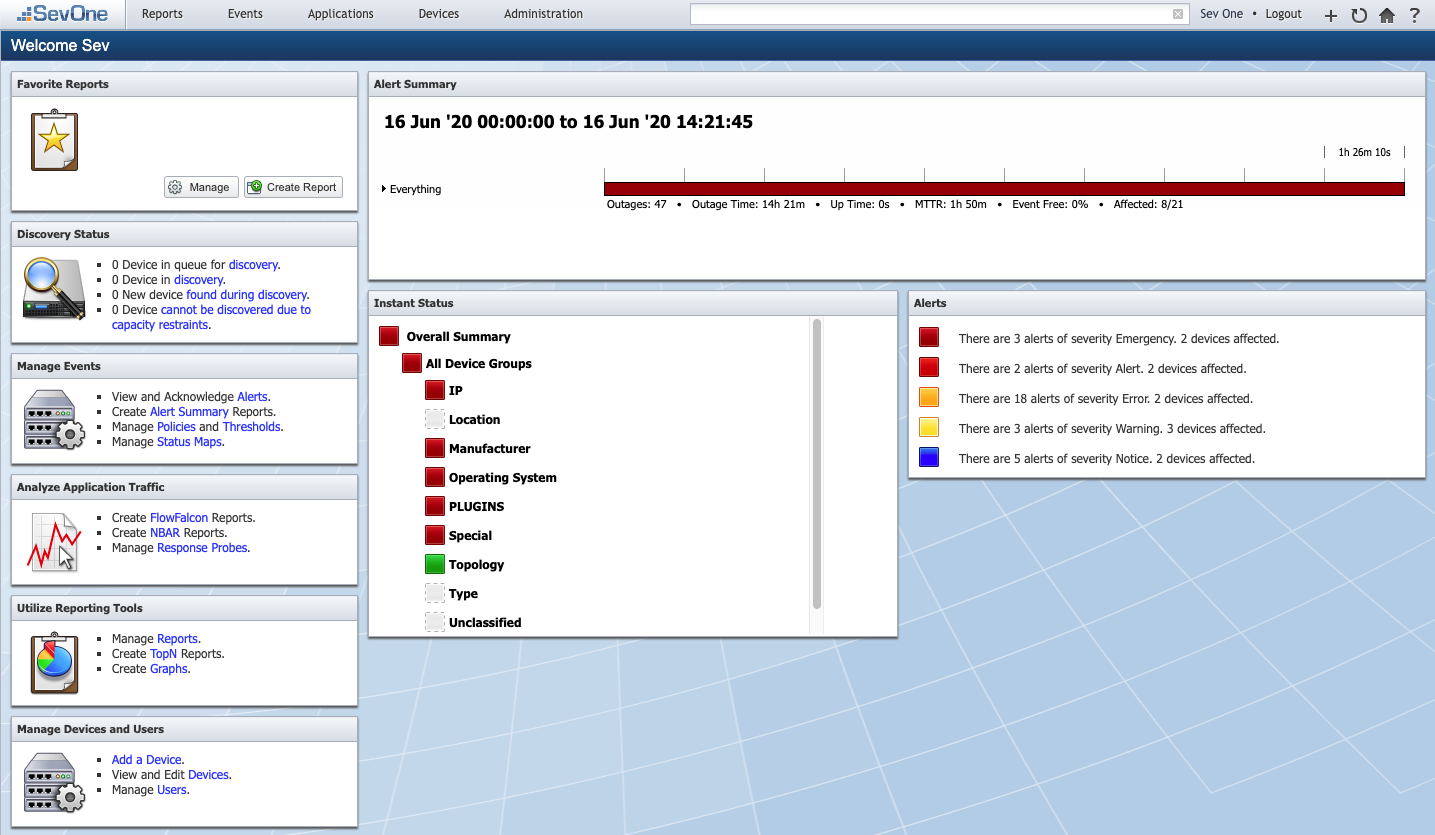
Dashboard
The first page that appears when you log on is the Dashboard. The Dashboard is a gateway to the most common components in the application. The dashboard that appears when a new user logs on for the first time is the Welcome Dashboard. User roles enable you to restrict access to SevOne NMS workflows and to restrict access to devices. When your user role does not permit you to use a workflow, that workflow does not appear for you. Contact your SevOne NMS administrators to discuss your security settings.
Topics mentioned here can be found in SevOne NMS System Administration Guide and/or SevOne NMS User Guide.
The Report Manager enables you to select a report to be your custom dashboard to define what appears for you when you log on.
Navigation Bar
The navigation bar appears across the top of most pages. The left side of the navigation bar provides the following menus.
Reports
-
Create Report
-
Report Manager
-
Instant Graphs
-
TopN Reports
Events
-
Alerts
-
Alert Summary
-
Archives - Alert Archive, Logged Traps, and Unknown Traps
-
Configuration - Policy Browser, Threshold Browser, Trap Destinations, Trap Destination Associations, Trap Event Editor, and Trap v3 Receiver.
-
Instant Status
-
Status Map Manager
Applications
-
FlowFalcon Reports
-
NBAR Reports
-
Probe Manager
Devices
-
Device Manager
-
Object Manager
-
Device Mover
-
Discovery Manager
-
Grouping - Device Groups and Object Groups
-
SNMP Walk
-
VMware Browser
Administration
-
About
-
Access Configuration - Authentication Settings, User Manager, User Role Manager, and Session Manager
-
API Docs - Provides access to REST API documentation for Version 2 and Version 3.
for Version 3,If you are logged into SevOne NMS user interface, authentication token is no longer required and X-AUTH-TOKEN field is automatically filled with the token.
-
Baseline Manager
-
Cluster Manager
-
Flow Configuration - Flow Rules, Flow Interface Manager, FlowFalcon View Editor, MPLS Flow Mapping, Network Segment Manager, Object Mapping, Device Mapping, and Protocols and Services
-
Maintenance Windows
-
Metadata Schema
-
Monitoring Configuration - Calculation Editor, Device Types, MIB Manager, Object Rules, Object Subtype Manager, Object Types, SNMP OID Browser, xStats Log Viewer, and xStats Source Manager
-
My Preferences
-
Startup Wizard
-
Work Hours
The right side of the navigation bar provides the following controls:
Search - Click in the Search field and enter a minimum of three characters to search throughout the application. Wildcards are implied after the first three characters and special characters are not allowed. You can use shortcuts and keywords to enhance your search. Search results appear as a menu, and each result is a link to the appropriate page, report, etc. Click Advanced Search or Show All for advanced search options.
<user name> - Click the <user name> to display the Preferences page, where you can change your password, given name, surname, email address, date format, time settings, and language.
Logout - Click to log off.
 - Click to open an additional instance of SevOne NMS on a new browser tab. Additional instances are based on your initial log on. Any additional instances close when you close the first SevOne NMS window.
 - Click to return settings to their default or last saved settings on the current page.
 - Click to return to the Dashboard. You can also click on the SevOne logo to return to the Dashboard.
 - Click to display page specific online help.
Favorite Reports
The Favorite Reports section provides links to view your favorite reports. Report workflows enable you to define your favorite reports and to designate one report to appear as your custom dashboard (Report Interactions) instead of the default Welcome Dashboard. This enables you to cater reports to various audiences and to view vital data as soon as you log on.
-
Click Manage to access the Report Manager, where you access all reports and report workflows.
-
Click Create Report to access the Report Attachment Wizard, where you create new reports.
-
Click on a favorite report link to display the report interactions on a new tab, where you can customize the report with real-time data.
Discovery Status
The Discovery Status section provides links to access additional discovery and device information.
-
Click the Devices links to access the Discovery Manager, where you view discovery information.
-
Click the Devices links to access the Device Manager, where you view device information.
Manage Events
The Manage Events section provides links to access additional event information.
-
Click the Alerts link to access the Alerts page, where you view and acknowledge current active alerts.
-
Click the Alert Summary link to access the Alert Summary page, where you view active alerts and archived alerts.
-
Click the Policies link to access the Policy Browser, where you manage policies, which are thresholds that apply to an entire device group.
-
Click the Thresholds link to access the Threshold Browser, where you manage the thresholds that trigger events such as alerts and traps for a specific device.
-
Click the Status Maps link to access the Status Map Manager, where you manage status maps that can depict the physical or geographic location of devices and objects.
Analyze Application Traffic
The Analyze Application Traffic section provides links to access additional application traffic information.
-
Click the FlowFalcon link to access the FlowFalcon Reports page, where you create flow technology reports.
-
Click the NBAR link to access the NBAR Reports page, where you create Network-Based Application Recognition (NBAR) reports.
-
Click the Response Probes link access the Probe Manager, where you manage Internet Protocol Service Level Agreement (IP SLA) data.
Utilize Reporting Tools
The Utilize Reporting Tools section provides links to access additional information about reporting tools.
-
Click the Reports link to access the Report Manager, where you view and edit reports.
-
Click the TopN link to access the TopN Reports page, where you create reports for projections and the top <n> devices.
-
Click the Graphs link to access the Instant Graphs page, where you create performance metrics graphs.
Manage Devices and Users
The Manage Devices and Users section provides links to access device management and user management tools.
-
Click the Add a Device link to access the New Device page, where you add a device to SevOne NMS.
-
Click the Devices link to access the Device Manager, where you manage the devices SevOne NMS monitors.
-
Click the Users link to access the User Manager, where you manage users.
Alert Summary
The Alert Summary section displays a summary of active alerts and archived alerts. Click anywhere in the Alert Summary to display the Alert Summary, where you can view additional alert details.
The Cluster Manager > Cluster Settings tab > Login subtab enables you to remove this section and the following sections from the Welcome Dashboard.
Instant Status
The Instant Status section displays the device group hierarchy color-coded to indicate the highest level active alert for the devices in each device group. Click anywhere in the Instant Status section to access the Instant Status page, where you can view additional active alert details.
Alerts
The Alerts section displays the number of active alerts for each alert severity level. Click a colored square to access the Alerts page, where you can view additional alert details.