Table of Contents (Start)
- Topics
- Introducing SevOne
- Login
- Startup Wizard
- Dashboard
- Global Search - Advanced Search
- Report Manager
- Report Attachment Wizard
- Report Properties
- Report Interactions
- Instant Graphs
- TopN Reports
- Alerts
- Alert Archives
- Alert Summary
- Instant Status
- Status Map Manager
- Edit Maps
- View Maps
- FlowFalcon Reports
- NBAR Reports
- Logged Traps
- Unknown Traps
- Trap Event Editor
- Trap Destinations
- Trap Destination Associations
- Policy Browser
- Create and Edit Policies
- Webhook Definition Manager
- Threshold Browser
- Create and Edit Thresholds
- Probe Manager
- Discovery Manager
- Device Manager
- New Device
- Edit Device
- Object Manager
- High Frequency Poller
- Device Summary
- Device Mover
- Device Groups
- Object Groups
- Object Summary
- Object Rules
- VMware Browser
- AWS Plugin
- Azure Plugin (Public Preview)
- Calculation Plugin
- Database Manager
- Deferred Data Plugin
- DNS Plugin
- HTTP Plugin
- ICMP Plugin
- IP SLA Plugin
- JMX Plugin
- NAM
- NBAR Plugin
- Portshaker Plugin
- Process Plugin
- Proxy Ping Plugin
- SDWAN Plugin
- SNMP Plugin
- VMware Plugin
- Web Status Plugin
- WMI Plugin
- xStats Plugin
- Indicator Type Maps
- Device Types
- Object Types
- Object Subtype Manager
- Calculation Editor
- xStats Source Manager
- User Role Manager
- User Manager
- Session Manager
- Authentication Settings
- Preferences
- Cluster Manager
- Maintenance Windows
- Processes and Logs
- Metadata Schema
- Baseline Manager
- FlowFalcon View Editor
- Map Flow Objects
- FlowFalcon Views
- Flow Rules
- Flow Interface Manager
- MPLS Flow Mapping
- Network Segment Manager
- Flow Protocols and Services
- xStats Log Viewer
- SNMP Walk
- SNMP OID Browser
- MIB Manager
- Work Hours
- Administrative Messages
- Enable Flow Technologies
- Enable JMX
- Enable NBAR
- Enable SNMP
- Enable Web Status
- Enable WMI
- IP SLA
- SNMP
- SevOne Data Publisher
- Quality of Service
- Perl Regular Expressions
- Trap Revisions
- Integrate SevOne NMS With Other Applications
- Email Tips and Tricks
- SevOne NMS PHP Statistics
- SevOne NMS Usage Statistics
- Glossary and Concepts
- Map Flow Devices
- Trap v3 Receiver
- Guides
- Quick Start Guides
- AWS Quick Start Guide
- Azure Quick Start Guide (Public Preview)
- Data Miner Quick Start Guide
- Flow Quick Start Guide
- Group Aggregated Indicators Quick Start Guide
- IP SLA Quick Start Guide
- JMX Quick Start Guide
- Metadata Quick Start Guide
- RESTful API Quick Start Guide
- Self-monitoring Quick Start Guide
- SevOne NMS Admin Notifications Quick Start Guide
- SNMP Quick Start Guide
- Synthetic Indicator Types Quick Start Guide
- Topology Quick Start Guide
- VMware Quick Start Guide
- Web Status Quick Start Guide
- WMI Quick Start Guide
- xStats Quick Start Guide
- xStats Adapter - Accedian Vision EMS (TM) Quick Start Guide
- Deployment Guides
- Automated Build / Rebuild (Customer) Instructions
- Generate a Self-Signed Certificate or a Certificate Signing Request
- SevOne Best Practices Guide - Cluster, Peer, and HSA
- SevOne Data Platform Security Guide
- SevOne NMS Implementation Guide
- SevOne NMS Installation Guide - Virtual Appliance
- SevOne NMS Advanced Network Configuration Guide
- SevOne NMS Installation Guide
- SevOne NMS Port Number Requirements Guide
- SevOne NMS Upgrade Process Guide
- SevOne Physical Appliance Pre-Build BIOS and RAID Configuration Guide
- SevOne SAML Single Sign-On Setup Guide
- Cloud Platforms
- Other Guides
- Quick Start Guides
TopN Reports
TopN Reports enable you to run reports to display a tabular view of the hot spots in your network.
To access the TopN Reports page from the navigation bar, click the Reports menu and select TopN Reports.
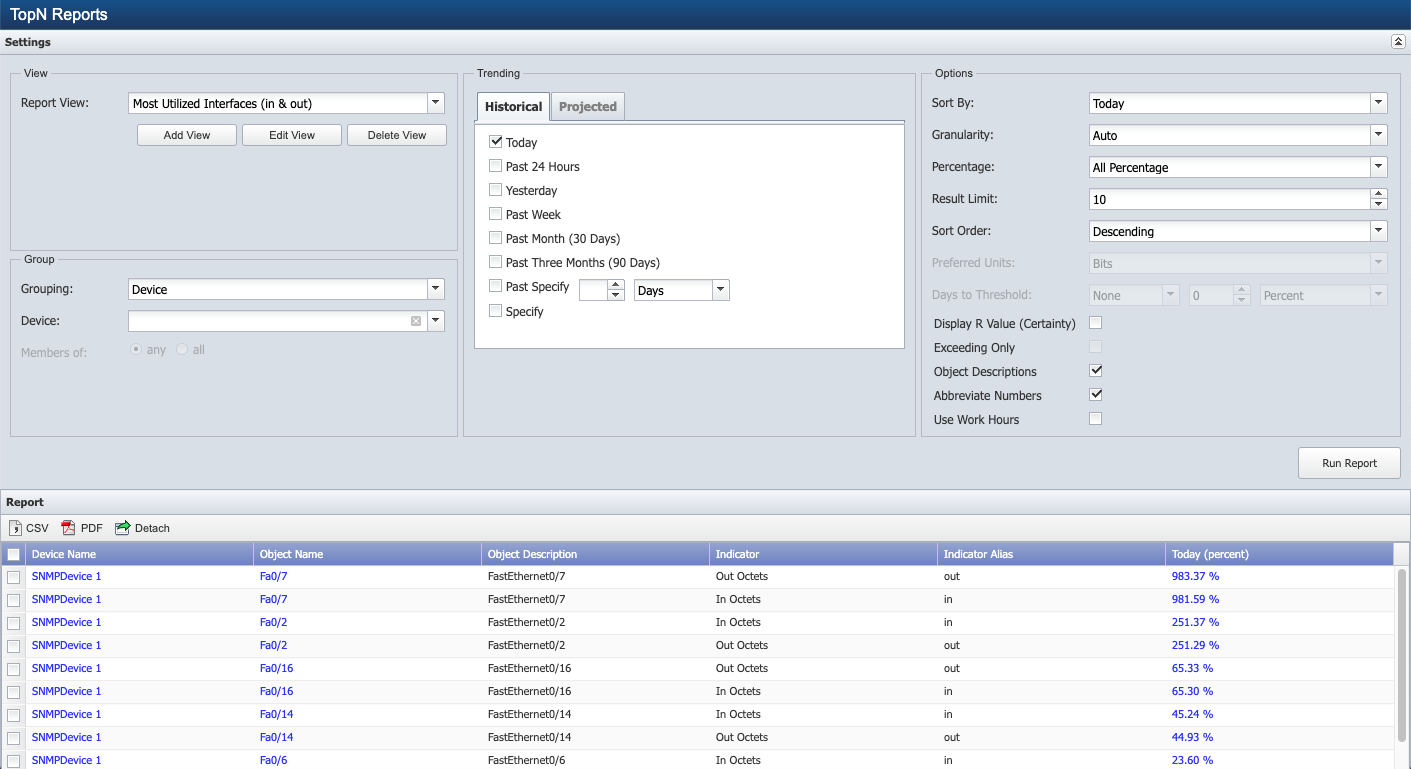
TopN Report Settings
You can click Run Report to run a TopN report with the default settings to get a table of the most utilized interfaces in & out for today. Trending time span columns display utilization data for the Trending settings you select. The unit of measure displays: us=microseconds, ms=milliseconds, number=numeric, b=bits, B=bytes, etc. Settings enable you to define the granularity and other report parameters. See the Trending Calculations section below for an explanation of the calculations used to display trends.
TopN views enable you to define the indicators, aggregation, and filters for the report content. See the Manage TopN Views section below.
-
Click the Report View drop-down and select a view. See the Manage TopN Views section for how to use the Add, Edit, and Delete buttons.
-
In the Group section, click the Grouping drop-down.
-
Select Device, then click the Device drop-down and select the devices on which to report.
-
Select Device Group, then click the Device Group drop-down and select the device groups/device types on which to report.
-
Select Object Group, then click the Object Group drop-down and select the object groups on which to report.
-
-
If you select multiple device groups or object groups, select one of the following options.
-
Select Members of Any to include devices as an OR operator, (e.g., run a report for devices that are either in Group 1 OR in Group 2 OR in Group 3).
-
Select Members of All to include devices as an AND operator, (e.g., run a report for devices that are in all groups you select; in Group 1 AND in Group 2 AND in Group 3).
-
-
In the Trending section on the Historical tab, select the check box for each historical trend to graph. TopN reports can include multiple historical and projected time spans. This enables you to graph overall changes over time on one report. The time span header in the TopN report displays the actual time span used, which may be slightly different from the requested time span. This does not affect the data returned.
ExampleA report can list the top 10 most utilized interfaces for this month, and show their utilization for today and over the last three months. See the Trending Calculations section below.
-
Select Today to display data from 12:00am until now.
-
Select Past 24 Hours to display data from 24 hours ago until now.
-
Select Yesterday to display data from 12:00am yesterday until 12:00am today.
-
Select Past Week to display data from the past seven days.
-
Select Past Month to display data from the past month.
-
Select Past Three Months to display data from the past three months.
-
Select Past Specify _____ Days/Weeks/Months/Years to define the time span from which to display data.
-
Select Specify to specify the number of days, weeks, months, or years from which to display data.
The shorttermhourly table is loaded in 2 hour intervals. Due to this, in almost every scenario, reports for the Past <n> Hours and Today intervals do not match.
-
-
In the Trending section on the Projected tab, select the check box for each projected trend to graph. See the Trending Calculations section below.
-
Select Next Week to project data for the next seven days.
-
Select Next Month to project data for the next month.
-
Select Next Three Months to project data for the next three months.
-
Select Next Six Months to project data for the next six months.
-
Select Next Year to project data for the next year.
-
Select Next Specify _____ Days/Weeks/Months/Years to define the time span for which to project data.
-
-
In the Options section, click the Sort By drop-down and select the time span on which to sort the data. Available options are dependent on the selections you make in the Trending section. This is important when you select several time span options.
-
Click the Granularity drop-down. Available options are dependent on the selection you make in the Trending section and in field Sort By. Select Auto to use the highest available frequency. Options other than Auto may impact data availability and may decrease the report precision.
-
Select Auto to use the fastest/most applicable frequency aggregation.
-
Select Hourly to use data stored in hourly buckets. Hourly buckets are useful when the time span is less than one week.
-
Select Daily to use data stored in daily buckets. Daily buckets are useful when the time span is between the one week and three months.
-
Select Weekly to use data stored in weekly buckets. Data stays in weekly buckets for 365 days. Weekly buckets are useful when the time span is between three months and one year.
-
Select Monthly to use data stored in monthly buckets. Data stays in monthly buckets for 730 days. Monthly buckets are useful when the time span is between one year and two years.
-
-
Click the Percentage drop-down.
-
Select Only Sorted to display data for the time span you select in the Sort By field as a percentage. All data also displays as numbers of bits, bytes, or the indicator's native unit of measure. The results sort on the percentage column and any data that cannot be converted to a percentage is excluded from all columns.
Note: Data sorts by the one column that displays percentages. Only indicator data that can be converted to a valid percentage based on the indicator having a defined maximum value appears in the report.
-
Select All Percentage to display only percentage data. Data that cannot be converted to a percentage is excluded.
-
Select No Percentage to display data as numbers of bits, bytes, or the indicator's native unit of measure. The results sort by your Sort Order selection.
-
-
In the Result Limit field, enter the number of results to display.
-
Click the Sort Order drop-down and select Ascending to sort data in ascending order or select Descending to sort data in descending order.
-
Click the Preferred Units drop-down and select Bits to format the unit of measure as bits where applicable. If the unit of measure is not compatible to bits and you select this option the report displays the unit of measure of the first indicator type in the view. Select Bytes to format the unit of measure in bytes. This setting is not applicable if you select All Percentage in the Percentage field.
-
When you select to Sort By a projected time span, you can define a threshold to determine when the data will drop below or exceed the value you define. Perform the following steps in the Days To Threshold field to define a data threshold.
-
Leave the first drop-down at None, the numeric field at 0 (zero), and the second drop-down at Percent (default) to not define a threshold.
-
Click the first drop-down and select Less Than, enter the threshold value in the numeric field, and click the second drop-down to select the unit of measure to define a threshold for declining values.
-
Click the first drop-down and select Greater Than, enter the threshold value in the numeric field, and click the second drop-down to select the unit of measure to define a threshold for increasing values.
ExampleThis is trying to project in how many days you will reach the threshold based on the past data trend. Let's say your object per partition has an indicator with Available space currently at 1GB, the total at 100GB, and it is filling up at the rate of 0.1GB per day for the past 1-month. Based on this, the threshold you have set is greater than 90%. It will try to predict how many days you have until you hit this threshold. The values totally depend on the maximum value, the past data, and the threshold selected.
-
-
Select the Display R Value (Certainty) check box to display the percentage of data points that were relevant to the display of a projected trend.
-
Select the Exceeding Only check box to only display objects projected to exceed 100 percent for the time span you select. This check box is enabled when you select a projected time span in the Sort By field.
-
Select the Object Descriptions check box to display object descriptions.
-
Select the Abbreviate Numbers check box to abbreviate large numbers (e.g., 5000 becomes 5K). Leave clear to enter the data precision in the Precision field.
-
Select the Use Work Hours check box to include data for the work hours that you associate with the device on the Edit Device page.
-
Click Run Report.
Trending Calculations
Historical and projected trending uses aggregated data stored in hourly buckets, six hour buckets, and daily buckets. For historical trends, the report displays one data point per bucket based on the aggregation you define in the report view and the trending options you select. For projected trends, SevOne NMS performs a linear regression on the historical data to calculate a data point at the projected time. TopN reports display future projections based on historical trends of the data that extends six times the length of the projected interval into the past.
Projected trends include Next Week, Next Month (30 Days), Next Three Months (90 Days), etc., with the intent to display a projected data point for the end of the trend time span you select.
This is calculated as follows:
projectedTimeStart=time();
projectedTimeEnd=time()+k;/*where k is projected time, in seconds */
$timespan->startTime=projectedTimeStart-5*(projectedTimeEnd-projectedTimeStart);
$timespan->endTime=projectedTimeEnd;
This means that SevOne NMS uses 5 * projected time worth of historical data to calculate a linear trend line.
TopN does trending via linear regression, in the form of Least Squares as illustrated below.
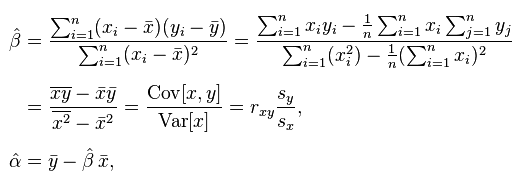
Image Source - Wikipedia
Where (x i, y i) is a data point pair of (time, value) which is used to get a trend line of the line intercept form Y = ȃ+ẞx.
This enables SevOne NMS to use the trend line to calculate the value <y> at projected time <x>.
TopN Report Interactions
TopN reports provide the following tools to enable you to manage the report data and to drill down for additional detail.
-
CSV - Click to export the report to a .csv format.
-
PDF - Click to export the report to a .pdf format.
-
Detach - Click to add the TopN report as an attachment in a report on a new browser tab. You can modify reports to add other attachments and you can save reports to the Report Manager. Report workflows enable you to designate reports to be your favorite reports and to define one report to appear as your custom dashboard.
-
Click in the Device Name column to display a link to the Device Summary and links to applicable report templates.
-
Click in the Object Name column to display a link to the Object Summary and links to applicable report templates.
-
Click any value to add a Performance Metrics attachment in a report on a new browser tab for the data you click. Any subsequent values you click appear as additional attachments in the report on the other browser tab that you are currently not viewing.
-
Select the check box for each result to include in the report and click a value in a trending time span column for one of the objects you select to add a Performance Metrics attachment in a report that contains the data for the objects you select over the trend time span for the column in which you click.
TopN data is aggregated on an hourly basis. Peaks in the data are the result of hourly averages of the data.
Manage TopN Views
TopN View requirements,
-
must have at least one sorted object type and indicator type.
-
all sorted indicators must share the same aggregation otherwise, meaningful comparisons are unlikely.
-
the sorted indicators should all be of the same units.
-
the sorted indicators should have consistent filter options applied.
-
it can have multiple unsorted indicators as long as the same ObjectType and IndicatorType match an existing sorted indicator.
-
it can have unsorted indicators as long as they do not overlap with the Aggregation defined for an equivalent sorted indicator.
Views enable you to define the indicators, aggregation, and filters for the report content. SevOne NMS provides starter set TopN views to enable you to create common TopN reports. You can use these views to create custom TopN views for the indicators in your network.
|
Starter Set TopN Views |
||
|
View Name |
Poller |
Indicators |
|
Highest Average Ping Times |
ICMP Poller |
Average Ping Time |
|
Highest IP SLA Jitter |
IP SLA Poller |
Average Jitter |
|
Highest IP SLA Jitter Response Times |
IP SLA Poller |
Average RTT |
|
Highest Maximum Ping Times |
ICMP Poller |
Maximum Ping Time |
|
Highest Packet Loss |
ICMP Poller |
Packet Loss |
|
Highest TCP Response Time |
Portshaker Poller |
Port Response Time |
|
Least Available TCP Ports |
Portshaker Poller |
Port Availability |
|
Least Reachable Devices |
ICMP Poller |
Availability |
|
Most Discarding Interfaces (in & out) |
SNMP Poller |
In Discards, Out Discards |
|
Most Errored Interfaces (in & out) |
SNMP Poller |
In Errors, Out Errors |
|
Most Packets Transmitted (in & out) |
SNMP Poller |
In Unicast Packets, Out Unicast Packets |
|
Most Utilized Interfaces (in & out) |
SNMP Poller |
HC In Octets, HC Out Octets, In Octets, Out Octets |
|
Slowest Web Pages |
HTTP Poller |
Time For Downloading |
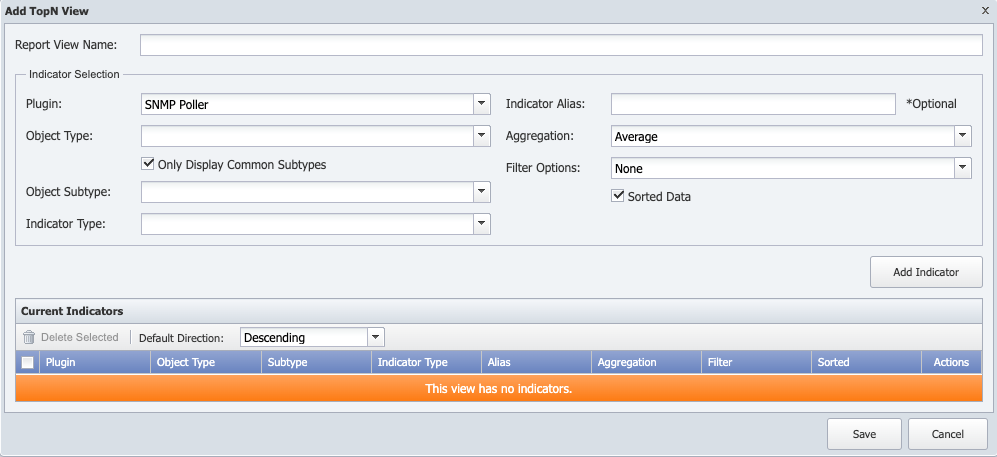
From the TopN Reports page click, Add View or Edit View to display a pop-up that enables you to manage the TopN views you use to create TopN reports.
Each step in this section is dependent on the preceding step.
-
In the Report View Name field, enter the name of the view. When you edit a view, this field displays the view name. If the view is a starter set view you must change the name before you can save your changes.
-
Click the Plugin drop-down and select the plugin that polls the object type on which to report.
-
Click the Object Type drop-down and select the object type that contains the indicator on which to report.
-
Select the Only Display Common Subtypes check box to filter the Object Subtype list to display only object subtypes you mark as Common on the Object Subtype Manager. For details, please refer to section Object Subtype Manager in SevOne NMS System Administration Guide.
-
Click the Object Subtype drop-down and select an object subtype.
-
Click the Indicator Type drop-down and select the indicator type on which to report.
-
In the Indicator Alias field, enter the indicator name to display in the report.
ExampleTo have an Octets indicator display as Incoming Bandwidth.
-
Click the Aggregation drop-down.
-
Select Average to average all data in each data bucket to create the data point for each bucket.
-
Select Maximum to find the maximum value in each data bucket to create the data point for each bucket.
-
Select Minimum to find the minimum value in each data bucket to create the data point for each bucket.
-
Select Percentile. An additional field appears to enable you to enter a percentile. Indicators for which you select Percentile do not appear in reports for projected time spans and a report view must contain at least one indicator that is something other than Percentile.
-
-
Click the Filter Options drop-down and select a comparison operator to filter results. If you select a comparison operator other than None, fields appear to enable you to enter a filter value and to select the unit of measure for the filter value.
-
Select the Sorted Data check box to enable users to sort the results on the data from this indicator. Leave clear to display data for the indicator in the report without the ability to sort the report on its data. This check box is not applicable for indicators for which you select Percentile in the Aggregation field above.
-
Click Add Indicator to add the indicator to the Current Indicators list and to the view.
-
Repeat the previous steps to add additional indicators to the Current Indicators list and to the view.
-
Select an indicator in the list and click Clone to add a copy of the indicator that you can tweak in the fields above.
-
In the current indicators list, click the Default Direction drop-down and select to sort data in either Ascending or Descending order.
-
Click Save.