Table of Contents (Start)
- Topics
- Introducing SevOne
- Login
- Startup Wizard
- Dashboard
- Global Search - Advanced Search
- Report Manager
- Report Attachment Wizard
- Report Properties
- Report Interactions
- Instant Graphs
- TopN Reports
- Alerts
- Alert Archives
- Alert Summary
- Instant Status
- Status Map Manager
- Edit Maps
- View Maps
- FlowFalcon Reports
- NBAR Reports
- Logged Traps
- Unknown Traps
- Trap Event Editor
- Trap Destinations
- Trap Destination Associations
- Policy Browser
- Create and Edit Policies
- Webhook Definition Manager
- Threshold Browser
- Create and Edit Thresholds
- Probe Manager
- Discovery Manager
- Device Manager
- New Device
- Edit Device
- Object Manager
- High Frequency Poller
- Device Summary
- Device Mover
- Device Groups
- Object Groups
- Object Summary
- Object Rules
- VMware Browser
- AWS Plugin
- Azure Plugin (Public Preview)
- Calculation Plugin
- Database Manager
- Deferred Data Plugin
- DNS Plugin
- HTTP Plugin
- ICMP Plugin
- IP SLA Plugin
- JMX Plugin
- NAM
- NBAR Plugin
- Portshaker Plugin
- Process Plugin
- Proxy Ping Plugin
- SDWAN Plugin
- SNMP Plugin
- VMware Plugin
- Web Status Plugin
- WMI Plugin
- xStats Plugin
- Indicator Type Maps
- Device Types
- Object Types
- Object Subtype Manager
- Calculation Editor
- xStats Source Manager
- User Role Manager
- User Manager
- Session Manager
- Authentication Settings
- Preferences
- Cluster Manager
- Maintenance Windows
- Processes and Logs
- Metadata Schema
- Baseline Manager
- FlowFalcon View Editor
- Map Flow Objects
- FlowFalcon Views
- Flow Rules
- Flow Interface Manager
- MPLS Flow Mapping
- Network Segment Manager
- Flow Protocols and Services
- xStats Log Viewer
- SNMP Walk
- SNMP OID Browser
- MIB Manager
- Work Hours
- Administrative Messages
- Enable Flow Technologies
- Enable JMX
- Enable NBAR
- Enable SNMP
- Enable Web Status
- Enable WMI
- IP SLA
- SNMP
- SevOne Data Publisher
- Quality of Service
- Perl Regular Expressions
- Trap Revisions
- Integrate SevOne NMS With Other Applications
- Email Tips and Tricks
- SevOne NMS PHP Statistics
- SevOne NMS Usage Statistics
- Glossary and Concepts
- Map Flow Devices
- Trap v3 Receiver
- Guides
- Quick Start Guides
- AWS Quick Start Guide
- Azure Quick Start Guide (Public Preview)
- Data Miner Quick Start Guide
- Flow Quick Start Guide
- Group Aggregated Indicators Quick Start Guide
- IP SLA Quick Start Guide
- JMX Quick Start Guide
- Metadata Quick Start Guide
- RESTful API Quick Start Guide
- Self-monitoring Quick Start Guide
- SevOne NMS Admin Notifications Quick Start Guide
- SNMP Quick Start Guide
- Synthetic Indicator Types Quick Start Guide
- Topology Quick Start Guide
- VMware Quick Start Guide
- Web Status Quick Start Guide
- WMI Quick Start Guide
- xStats Quick Start Guide
- xStats Adapter - Accedian Vision EMS (TM) Quick Start Guide
- Deployment Guides
- Automated Build / Rebuild (Customer) Instructions
- Generate a Self-Signed Certificate or a Certificate Signing Request
- SevOne Best Practices Guide - Cluster, Peer, and HSA
- SevOne Data Platform Security Guide
- SevOne NMS Implementation Guide
- SevOne NMS Installation Guide - Virtual Appliance
- SevOne NMS Advanced Network Configuration Guide
- SevOne NMS Installation Guide
- SevOne NMS Port Number Requirements Guide
- SevOne NMS Upgrade Process Guide
- SevOne Physical Appliance Pre-Build BIOS and RAID Configuration Guide
- SevOne SAML Single Sign-On Setup Guide
- Cloud Platforms
- Other Guides
- Quick Start Guides
Report Interactions
The title bar in a report and the title bar on each attachment in the report enable you to manage the graph and table attachments in the report. The custom dashboard provides the same controls as all other reports. Each report appears on a separate browser tab and you can save reports to the Report Manager. Each attachment title bar enables you to use the existing attachment settings to create related chained attachments that use the settings from the parent attachment.
To access a report from the navigation bar, click the Reports menu and select Report Manager to display the Report Manager. Click on a report name to display the report on a new browser tab. The Welcome Dashboard provides access to view your favorite reports.
The following single report attachment creation pages provide a Detach button to provide access to comprehensive multi-attachment reports.
-
Device Summary - (Items that can create a performance metrics graph)
-
NBAR Reports - (Items that can create a performance metrics graph)
-
Object Summary - (Items that can create a performance metrics graph)
Report Fundamentals
The reports and report templates you save to the Report Manager eliminate the need to repeatedly create individual graphs and tables each time you want to view data. Chaining enables you to add related attachments to a report.
-
Reports - Enable you to create and save a collection of attachments for specific devices resources or for specific objects resources so that you can retrieve the same data from the same resources at any time.
From the Report attachment, click
 , and then select one of the following management options.
 -
Chain -
-
Quick Chain - Select to create a (child) chained attachment that contains the next logical set of data that is related to the current attachment (not available from some attachment types). The icon and source display the attachment source to create.
-
Custom - Select to create a custom chained attachment. The Report Attachment Wizard appears pre-populated with the attachment settings from the current attachment (not available from Group Metrics, FlowFalcon, and Status Maps attachments).
-
Simple Item - Select to add a separator simple attachment or to add a text simple attachment to the report.
-
-
Get CSV Summary (FlowFalcon attachments) - Select to export summary data from the FlowFalcon attachment table to a .csv format.
-
Get CSV - Click to export the attachment data to a .csv format. For FlowFalcon attachments this exports all granular data points in the graph to a .csv format.
-
Edit - Click to display the Report Attachment Wizard where you can edit the attachment content.
-
Change Timespan - Click to select the time span for the attachment and all of its (child) chained attachments, when applicable. If you change the report level time span after you set the attachment level time span, the attachment level time span updates to the report level time span.
-
Copy – Click to add a copy of the attachment to the report.
-
Delete - Click to delete the attachment from the report.
-
-
Report Templates - Similar to reports with the added ability to define template attachments that do not have a specific resource. You define the report template properties to enable template attachments to derive applicable devices from the Device Summary workflows or to derive applicable objects from the Object Summary workflows. Report templates enable you to create a report that has template attachments without a specific resource and attachments with specific resources.
From the Report Template attachment, click
, and then select one of the following management options. -
Chain -
-
Quick Chain - Select to create a (child) chained attachment that contains the next logical set of data that is related to the current attachment (not available from some attachment types). The icon and source display the attachment source to create.
-
Custom - Select to create a custom chained attachment. The Report Attachment Wizard appears pre-populated with the attachment settings from the current attachment (not available from Group Metrics, FlowFalcon, and Status Maps attachments).
-
Simple Item - Select to add a separator simple attachment or to add a text simple attachment to the report.
-
-
Get CSV Summary (FlowFalcon attachments) - Select to export summary data from the FlowFalcon attachment table to a .csv format.
-
Get CSV - Click to export the attachment data to a .csv format. For FlowFalcon attachments this exports all granular data points in the graph to a .csv format.
-
Edit - The option is unavailable.
-
Change Timespan - Click to select the time span for the attachment and all of its (child) chained attachments, when applicable. If you change the report level time span after you set the attachment level time span, the attachment level time span updates to the report level time span.
-
Copy – The option is unavailable.
-
Delete - Click to delete the attachment from the report.
The drop-down options are only available where applicable.
-
-
Chaining - Enables you to use the settings from an attachment to create a related attachment.
There are four fundamental parts to define a report.
-
Report Manager - Enables you to manage reports, to manage report templates, and is an access point to all of the following report management workflows.
-
Report Attachment Wizard - Enables you to create and maintain the attachments which are the content of the report that contain the tables, graphs, and charts of data.
-
Report - Appears on a new browser tab to enable you to define the attachment locations, chain attachments, use the report in a slide show, mark the report as a favorite or mark the report as a dashboard, change the data refresh rate, define the report time span, export the report to a .pdf format, export an attachment to a .csv format, and to lock a report to prevent the addition of new attachments.
-
Report Properties - Enables you to define the overall report name, view the report structure, and define the report sharing permissions. The Report Properties enables you to define report email delivery and FTP delivery settings and to define report template access settings.
Report Title Bar Settings
The report title bar provides the following controls and icons.
Click the report name to display the Report Properties that enables you to edit the report name and other report properties.
 - Click next to the report name to present a list of your favorite reports. Select the favorite report to display.
- Click next to  and select a frequency to present the report in a slide show presentation that cycles through your favorite reports at the frequency you select.
 - Click to display the Report Attachment Wizard where you define a new attachment for the report.
- Click next to
and select one of the following options.
-
For report templates, select Template Item to add a template attachment to the report template from the Report Attachment Wizard.
-
Select Custom to add an attachment to the report from the Report Attachment Wizard.
-
Select Simple Item to display a pop-up that enables you to add a simple attachment to the report.
-
On the pop-up, click the Type drop-down and select Separator to add a horizontal divider to the report.
-
On the pop-up, click the Type drop-down and select Text to add text to the report.
-
 - Click to refresh the data in the report.
- Click next to
and select a frequency to have the data in the report refresh at the frequency you select. You can define attachment level refresh rates from the title bar on each attachment.
 - Click to display the following report management options.
-
Add - Click and select one of the following submenu options.
-
For report templates, select Template Item to add a template attachment from the Report Attachment Wizard.
-
Select Custom to add an attachment from the Report Attachment Wizard.
-
Select Simple Item to add a separator simple attachment or a text simple attachment.
-
-
Edit Report - Click to display the Report Properties where you can change the overall report name, view the report structure, and define the report sharing permissions. The Report Properties also enables you to define report email delivery and FTP delivery settings and to define report template access settings.
-
Save - Click to save all changes you make in the report to the Report Manager for future use.
-
Save As - Click to save a copy of the report with the latest updates to the Report Manager for future use. A pop-up appears to enable you to enter the name of the new report. When a user who is not the owner of a report makes a copy of the report, the user who made the copy becomes the owner of the copy.
-
Mark/Unmark as Favorite - Click to make the report a favorite or to unmark the report as a favorite. Not applicable for report templates.
-
 - Report is not one of your favorite reports.
 -
 - Report is a favorite and appears on the Welcome Dashboard and in slide show presentations.
-
-
Mark/Unmark as Dashboard - Click to make the report your custom dashboard or to unmark the report as your custom dashboard. Not applicable for report templates.
-
- Report is not your custom dashboard.
-
 - Report is your custom dashboard and appears when you log on and when you click
  .
.
-
-
Export as PDF - Click to export the report to a .pdf format.
-
Lock/Unlock Report - Click to lock the report or to unlock the report. When you open a report from the Report Manager, the report is locked to prevent a report you detach from single report workflows from becoming an attachment in this report (the detached report either appears as an attachment in another open report or as an attachment in a new report). When you unlock a report, reports you detach from single report workflows appear as attachments in the existing report (the report typically is open on a different browser window). Not applicable for report templates.
-
Change Time Span - Click to select the time span for all attachments in the report. You can define attachment level time spans from the title bar on each attachment.
-
Help – Click to display page specific online help.
Attachment Title Bar Settings and Chaining
Each attachment in a report provides controls to enable you to manage the data in each individual attachment. Chaining is the ability to use the settings from one attachment to create a related attachment that drills down to more specific data or provides related data for the same set of devices, objects, interfaces, etc. Changes you make to settings such as refresh rate and time frame on the (parent) attachment pass down to all of its (children) chained attachments.
When you split the results of an attachment into separate (children) chained attachments you cannot save the changes you make to a split (child) chained attachment.
Click the attachment name to make the field editable and change the attachment name.
The following icons appear on the attachment title bar to enable you to change the attachment width.
-
- Click to reduce the size of the attachment down to one or two columns wide.
-
+ Click to expand the size of the attachment up to two or three columns wide.
-
X Click to remove the attachment from the report.
For some attachments that contain aggregated data, you need to click  to refresh the data in the attachment when you change the attachment size.
Each attachment provides an icon to adjust the refresh rate and a gear icon.
- Click to refresh the data in the attachment and all of its chained attachments, when applicable.
- Click next to
and select a frequency to have the data in the attachment (and all of its chained attachments, when applicable) refresh at the frequency you select. This refresh rate works in conjunction with the report refresh rate that you set from the report title bar and is most useful when you want the data in an attachment to refresh more frequently than the other data in the overall report.
-
If you set the report refresh rate to 5 Minutes and you set the attachment refresh rate to 30 Seconds, the report refreshes every five minutes and the one attachment refreshes every 30 seconds.
-
If you set the report refresh rate to 30 Seconds and you set the attachment refresh rate to 5 Minutes, the entire report (including the attachment) refreshes every 30 seconds.
 - Click to display the following attachment management options.
-
Chain -
-
Quick Chain - Select to create a (child) chained attachment that contains the next logical set of data that is related to the current attachment (not available from some attachment types). The icon and source display the attachment source to create.
-
Custom - Select to create a custom chained attachment. The Report Attachment Wizard appears pre-populated with the attachment settings from the current attachment (not available from Group Metrics, FlowFalcon, and Status Maps attachments).
-
Simple Item - Select to add a separator simple attachment or to add a text simple attachment to the report.
-
-
Get CSV Summary (FlowFalcon attachments) - Select to export summary data from the FlowFalcon attachment table to a .csv format.
-
Get CSV - Click to export the attachment data to a .csv format. For FlowFalcon attachments this exports all granular data points in the graph to a .csv format.
-
Edit - Click to display the Report Attachment Wizard where you can edit the attachment content.
-
Change Time Span - Click to select the time span for the attachment and all of its (child) chained attachments, when applicable. If you change the report level time span after you set the attachment level time span, the attachment level time span updates to the report level time span.
-
Copy – Click to add a copy of the attachment to the report.
-
Delete - Click to delete the attachment from the report.
Click the title bar of an attachment and drag it to another location in the report.
TopN Attachments
 TopN attachments can display a pie visualization and/or a table visualization. TopN attachments quick chain to a related Performance Metrics attachment. Custom chain attachments can include data from the following sources: TopN, Performance Metrics, FlowFalcon, Alerts, Devices. Device Groups, Objects, Object Groups, and Topology.
For the table visualization, the following interactions are available.
-
In the Search Results field, enter a string. As you type, the table displays data that contains the string.
-
Click in the Device Name column to display a link to the Device Summary and links to applicable report templates.
-
Click in the Object Name column to display a link to the Object Summary and links to applicable report templates.
-
Unlock the report (
Unlock Report) and then click any value to add a Performance Metrics attachment to the report. If you do not unlock the report, the attachment appears in a new report on a new browser tab.
Performance Metrics Attachments
 Performance Metrics attachments can display many visualizations. The indicators you select in the Performance Metrics attachment determine which source is applicable for a quick chain attachment. Custom chain attachments can include data from the following sources: TopN, Performance Metrics, FlowFalcon, Alerts, Devices, and Topology.
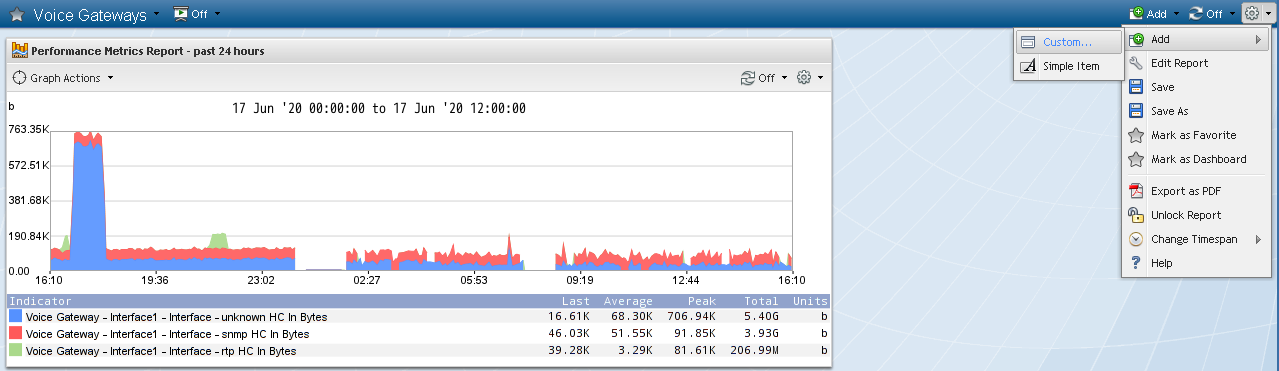
For line, bar, stacked line, and stacked bar visualizations, click the Graph Actions drop-down.
-
Select Recenter and then click on the graph where you want to center the graph.
-
Select Zoom In and then click on the graph where you want to zoom into the graph.
-
Select Zoom Out and then click on the graph where you want to zoom out from the graph.
-
Select Range Selection, then click once at the range start point, and then click again at the range end point. The range appears highlighted. Click anywhere inside the range you highlight to view a graph for the range you select.
For the table visualization, in the Search Results field, enter a string. As you type, the table displays data that contains the string.
For the calendar visualization, the following enable you to view the historical performance of an indicator.
-

 - Click to navigate back in history or forward to a more current time span.
 -
Today - Click to display data for today.
-
Day - The daily graph displays one day's data in four hour increments.
-
Week - The weekly graph displays one week's data in seven one day graphs. Click on a day graph to view the daily graph for that day.
-
Month - The monthly graph displays a daily graph in each date block within a calendar. Click on a date to view the daily graph for that day.
-
Quarter - The quarterly graph displays one quarter's data in three one month graphs. Click on a month to display the monthly graph for that month.
-
Year - The yearly graph displays one year's data in four quarterly graphs. Click on a quarter to display the quarterly graph that contains the data for three months.
FlowFalcon Attachments
 FlowFalcon attachments can display a pie, stacked line, and/or table visualization. You cannot chain from a FlowFalcon attachment.
Click the Change View drop-down and select a different FlowFalcon view to change the data output for the same resources.
For the stacked line visualization, click the Graph Actions drop-down.
-
Select Recenter and then click on the graph where you want to center the graph.
-
Select Zoom In and then click on the graph where you want to zoom into the graph.
-
Select Zoom Out and then click on the graph where you want to zoom out from the graph.
-
Select Range Selection, then click once at the range start point, and then click again at the range end point. The range appears highlighted. Click anywhere inside the range you highlight to view a graph for the range you select.
For the table visualization, in the Search Results field, enter a string. As you type, the table displays data that contains the string.
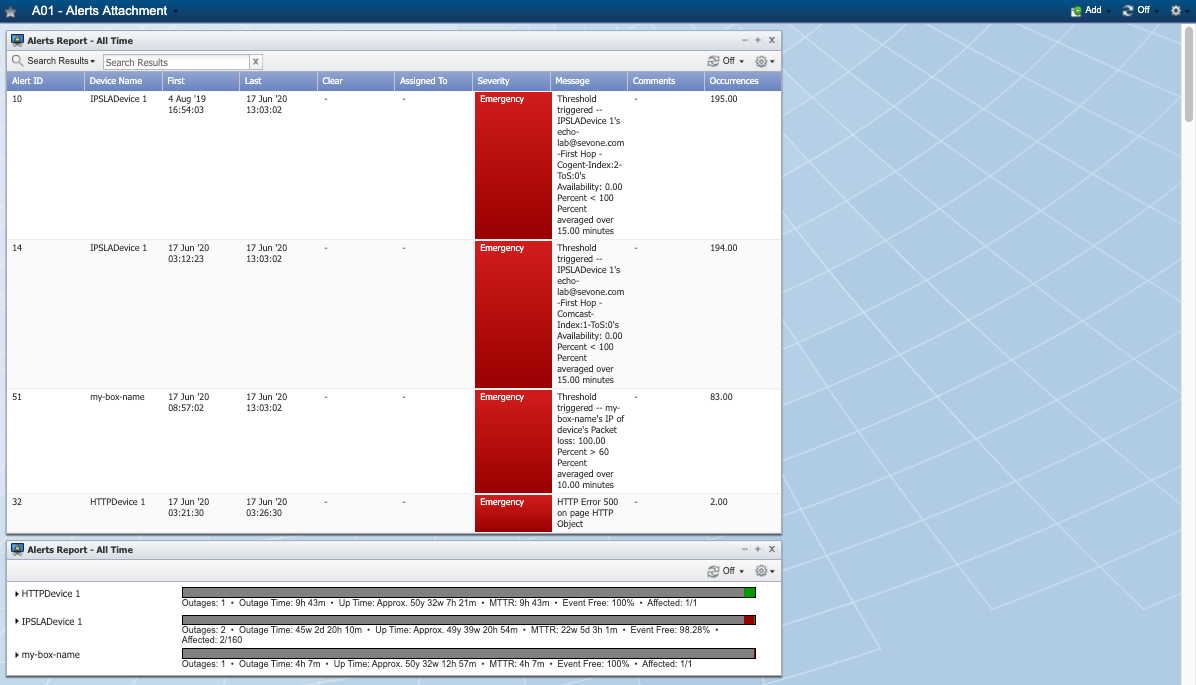
Alerts Attachments
 Alerts attachments can display a bar, pie, table, or alert summary visualization. Alerts attachments quick chain to a related Alerts attachment that uses the alert summary visualization. Custom chain attachments can include data from the following sources: TopN, Performance Metrics, FlowFalcon, Alerts, Devices. Device Groups, Objects, Object Groups, Metadata, and Topology.
For the bar visualization, click the Graph Actions drop-down.
-
Select Recenter and then click on the graph where you want to center the graph.
-
Select Zoom In and then click on the graph where you want to zoom into the graph.
-
Select Zoom Out and then click on the graph where you want to zoom out from the graph.
-
Select Range Selection, then click once at the range start point, and then click again at the range end point. The range appears highlighted. Click anywhere inside the range you highlight to view a graph for the range you select.
For the table visualization, in the Search Results field, enter a string. As you type, the table displays data that contains the string.
For the alert summary visualization, click  to display additional details.
Status Maps Attachments
 Status Maps attachments display an interactive map. You cannot chain from a Status Map attachment.
Status Map attachments function similarly to a status map report on the Status Map Viewer page. Click on a node or path to display the following information.
The slider bar at the top of the Status Map attachment enables you to adjust the size of the nodes, paths, and text for the status map.
The Alerts tab lists all alerts for the node or path you select.
The Membership tab displays the following information.
-
 -
For a node or path with multiple objects or devices, select the option next to the applicable object or device in the list below and then click this icon
. The results appear on the other browser tab.
-
For a node or path with multiple objects or devices, select the option next to the applicable object or device in the list below and then click this icon
. The results appear on the other browser tab. -
 - For objects, click to display a link to the Object Summary and links to the report templates that are applicable to the object. For a node or path with multiple objects, select the radio button next to the applicable object in the list below and then click this icon. The results appear on the other browser tab.
 -
Name - Displays the name of the status map, device, device group, object, or object group that the node or path represents.
-
When the node or path represents multiple objects, the list of devices and objects provide options to enable you to select to view the Device Summary for a specific device or the Object Summary for a specific object.
-
Status Map node/path displays the status map name as a link to display the status map on the Status Map Viewer.
-
Report node/path displays the name of the report as a link to display the report attachments in the report within the current report.
Topology Attachments
 Topology attachments display a representation of the connections to the focal device. You cannot quick chain from a Topology attachment. You can custom chain to TopN, FlowFalcon, Alerts, Devices, Device Groups, Objects, Object Groups, Metadata, and Topology.
The following indicate the type of connection between devices:
-
Solid line - indicates a physical connection.
-
Dotted line - indicates a logical connection.
-
Curved line - indicates a session connection.
-
Black line - indicates that there is no connection between any of the objects of the devices.
A dot next to each device indicates that device's alert severity. If the device has no alerts, the dot is green.
Topology attachments provide the following interactions.
Hover the cursor over a device to view the device IP address, name, description, location, and number of discovered objects.
Right-click on a device.
-
Select Expand to expand the device group display.
-
Select Edit Device to open the Edit Device page on the other tab.
-
Select Manage Objects to open the Object Manager on the other tab.
-
Select Device Summary to display a link to the Device Summary and links to applicable report templates.
-
Select Use as Focal Device to change the focal device.
-
Select View Alerts to display the Alerts page on the other tab.
Group Metrics, Devices, Device Groups, Objects, Object Groups, and Metadata Attachments
 Group Metrics,
  Devices,
  Device Groups,
  Objects,
  Object Groups, and
  Metadata all display the table visualization.
In the Search Results field, enter a string. As you type, the table displays data that contains the string.
Chain
-
Group Metrics - Cannot chain.
-
Devices - Quick chain to Alerts. Custom chain to TopN, Alerts, Devices, Device Groups, Objects, Metadata, and Topology.
-
Device Groups - Cannot quick chain. Custom chain to TopN, FlowFalcon, Alerts, Devices, Device Groups, and Topology.
-
Objects - Cannot quick chain. Custom chain to TopN, FlowFalcon, Alerts, Devices, Object Groups, and Topology.
-
Object Groups - Cannot quick chain. Custom chain to TopN, FlowFalcon, Alerts, Objects, Object Groups, and Topology.
-
Metadata - Cannot quick chain. Custom chain to TopN, Performance Metrics, FlowFalcon, Alerts, Devices, Device Groups, Objects, Object Groups, Metadata, and Topology.
Time Change Considerations
Many countries shift their clocks forward one hour in the spring and back one hour in the fall. SevOne NMS displays the time label based on what would have been the correct underlying UTC time zone data.
The following example uses the 2020 United States dates with a New York time zone for the time changes.
On March 8th, 2020 the clock is set forward one hour and there are 23 hours in the day. The time label in reports displays:
-
12AM--1AM--3AM New York
On November 1st, 2020 the clock is set back one hour and there are 25 hours in the day. The time label in reports displays:
-
12AM--1AM--1AM--2AM--3AM New York
In calendar view, March 8th will have 23 hours and November 1st will have 25 hours.
The display includes EST/EDT or EDT/EST depending on the side of the time zone when the date format includes this information.