Table of Contents (Start)
- Topics
- Introducing SevOne
- Login
- Startup Wizard
- Dashboard
- Global Search - Advanced Search
- Report Manager
- Report Attachment Wizard
- Report Properties
- Report Interactions
- Instant Graphs
- TopN Reports
- Alerts
- Alert Archives
- Alert Summary
- Instant Status
- Status Map Manager
- Edit Maps
- View Maps
- FlowFalcon Reports
- NBAR Reports
- Logged Traps
- Unknown Traps
- Trap Event Editor
- Trap Destinations
- Trap Destination Associations
- Policy Browser
- Create and Edit Policies
- Webhook Definition Manager
- Threshold Browser
- Create and Edit Thresholds
- Probe Manager
- Discovery Manager
- Device Manager
- New Device
- Edit Device
- Object Manager
- High Frequency Poller
- Device Summary
- Device Mover
- Device Groups
- Object Groups
- Object Summary
- Object Rules
- VMware Browser
- AWS Plugin
- Azure Plugin (Public Preview)
- Calculation Plugin
- Database Manager
- Deferred Data Plugin
- DNS Plugin
- HTTP Plugin
- ICMP Plugin
- IP SLA Plugin
- JMX Plugin
- NAM
- NBAR Plugin
- Portshaker Plugin
- Process Plugin
- Proxy Ping Plugin
- SDWAN Plugin
- SNMP Plugin
- VMware Plugin
- Web Status Plugin
- WMI Plugin
- xStats Plugin
- Indicator Type Maps
- Device Types
- Object Types
- Object Subtype Manager
- Calculation Editor
- xStats Source Manager
- User Role Manager
- User Manager
- Session Manager
- Authentication Settings
- Preferences
- Cluster Manager
- Maintenance Windows
- Processes and Logs
- Metadata Schema
- Baseline Manager
- FlowFalcon View Editor
- Map Flow Objects
- FlowFalcon Views
- Flow Rules
- Flow Interface Manager
- MPLS Flow Mapping
- Network Segment Manager
- Flow Protocols and Services
- xStats Log Viewer
- SNMP Walk
- SNMP OID Browser
- MIB Manager
- Work Hours
- Administrative Messages
- Enable Flow Technologies
- Enable JMX
- Enable NBAR
- Enable SNMP
- Enable Web Status
- Enable WMI
- IP SLA
- SNMP
- SevOne Data Publisher
- Quality of Service
- Perl Regular Expressions
- Trap Revisions
- Integrate SevOne NMS With Other Applications
- Email Tips and Tricks
- SevOne NMS PHP Statistics
- SevOne NMS Usage Statistics
- Glossary and Concepts
- Map Flow Devices
- Trap v3 Receiver
- Guides
- Quick Start Guides
- AWS Quick Start Guide
- Azure Quick Start Guide (Public Preview)
- Data Miner Quick Start Guide
- Flow Quick Start Guide
- Group Aggregated Indicators Quick Start Guide
- IP SLA Quick Start Guide
- JMX Quick Start Guide
- Metadata Quick Start Guide
- RESTful API Quick Start Guide
- Self-monitoring Quick Start Guide
- SevOne NMS Admin Notifications Quick Start Guide
- SNMP Quick Start Guide
- Synthetic Indicator Types Quick Start Guide
- Topology Quick Start Guide
- VMware Quick Start Guide
- Web Status Quick Start Guide
- WMI Quick Start Guide
- xStats Quick Start Guide
- xStats Adapter - Accedian Vision EMS (TM) Quick Start Guide
- Deployment Guides
- Automated Build / Rebuild (Customer) Instructions
- Generate a Self-Signed Certificate or a Certificate Signing Request
- SevOne Best Practices Guide - Cluster, Peer, and HSA
- SevOne Data Platform Security Guide
- SevOne NMS Implementation Guide
- SevOne NMS Installation Guide - Virtual Appliance
- SevOne NMS Advanced Network Configuration Guide
- SevOne NMS Installation Guide
- SevOne NMS Port Number Requirements Guide
- SevOne NMS Upgrade Process Guide
- SevOne Physical Appliance Pre-Build BIOS and RAID Configuration Guide
- SevOne SAML Single Sign-On Setup Guide
- Cloud Platforms
- Other Guides
- Quick Start Guides
Group Aggregated Indicators Quick Start Guide
SevOne Documentation
All documentation is available from the IBM SevOne Support customer portal.
© Copyright International Business Machines Corporation 2024 .
All right, title, and interest in and to the software and documentation are and shall remain the exclusive property of IBM and its respective licensors. No part of this document may be reproduced by any means nor modified, decompiled, disassembled, published or distributed, in whole or in part, or translated to any electronic medium or other means without the written consent of IBM.
IN NO EVENT SHALL IBM, ITS SUPPLIERS, NOR ITS LICENSORS BE LIABLE FOR ANY DAMAGES, WHETHER ARISING IN TORT, CONTRACT OR ANY OTHER LEGAL THEORY EVEN IF IBM HAS BEEN ADVISED OF THE POSSIBILITY OF SUCH DAMAGES, AND IBM DISCLAIMS ALL WARRANTIES, CONDITIONS OR OTHER TERMS, EXPRESS OR IMPLIED, STATUTORY OR OTHERWISE, ON SOFTWARE AND DOCUMENTATION FURNISHED HEREUNDER INCLUDING WITHOUT LIMITATION THE WARRANTIES OF DESIGN, MERCHANTABILITY OR FITNESS FOR A PARTICULAR PURPOSE, AND NONINFRINGEMENT.
IBM, the IBM logo, and SevOne are trademarks or registered trademarks of International Business Machines Corporation, in the United States and/or other countries. Other product and service names might be trademarks of IBM or other companies. A current list of IBM trademarks is available on ibm.com/trademark.
About
Group aggregated indicators enable administrators to define rules that build on the dynamic device group and object group constructs in SevOne NMS to create new synthetic objects that hold aggregated statistics based on the membership of the group structures at any point in time.
Calculations occur every five minutes (as default), and SevOne NMS writes each calculated statistic to the database every five minutes. From a report and alert perspective, SevOne NMS treats the group aggregated object like any other SevOne NMS object for baselines, thresholds, projections, work hours, maintenance windows, etc.
The group aggregated indicator infrastructure is cluster-aware, which means that it does not matter which peer holds devices that contribute to a group aggregated indicator object. Each relevant peer sends the statistics it collects to the peer on which you define the group aggregated indicator object. The object's peer then performs the calculations and stores the results.
Use Case
The following is an example of a scenario where group aggregated indicators are key for using the group poller on SNMP Objects and Indicators. It can now be used for xStats (plugin name, BULKDATA).
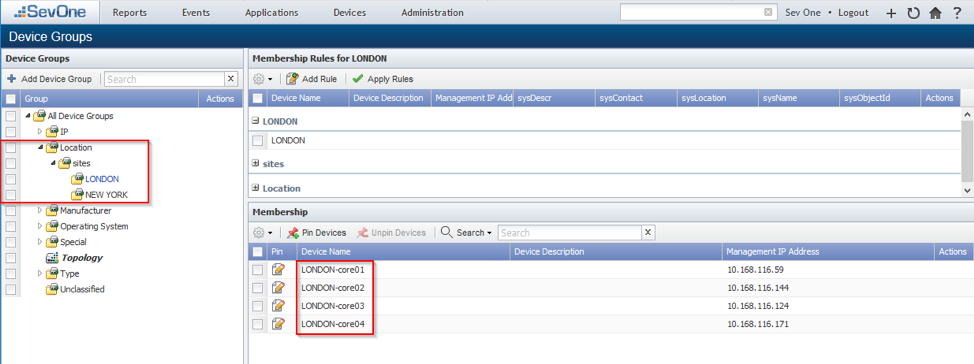
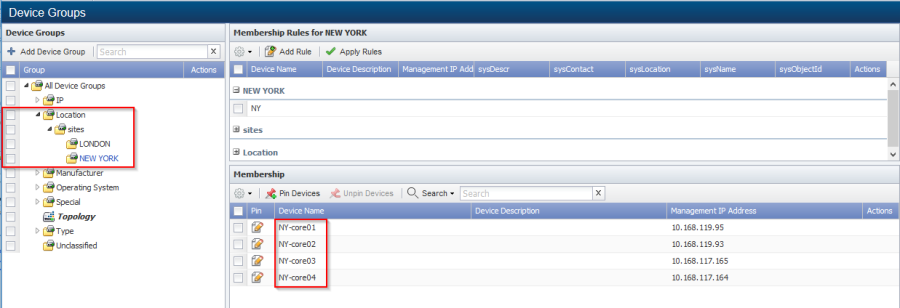
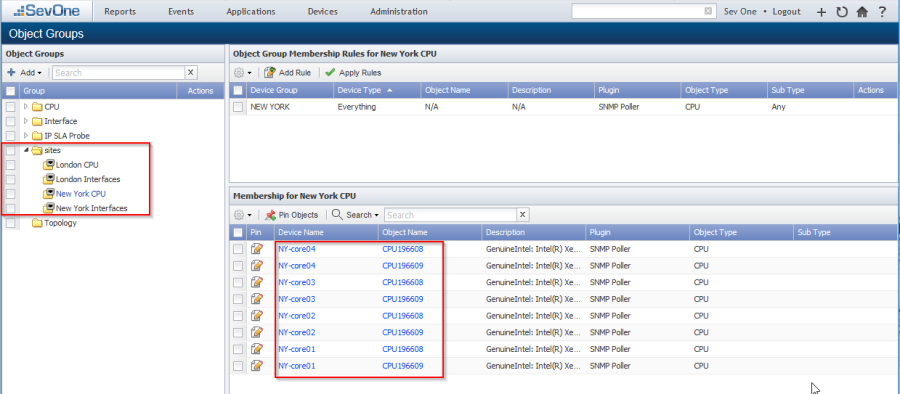
A company wants to aggregate the same indicators for a few different objects per site. In this scenario, there are two sites, one in London and one in New York and we want to measure the total incoming and outgoing traffic across the end points at the two sites. We also want to monitor the details on KPIs relating to CPU load.
To achieve this, we need to aggregate on the SNMP objects of Object Type Interface and its respective indicators of InOctets and/or HCInOctets for incoming traffic and OutOctets and/or HCOutOctets for the outgoing traffic, across all devices at each of the above sites. For monitoring the CPU load, you need to configure the group poller to aggregate on the CPU (Cisco IOS) Object Type with the CPU Load Indicator Type.
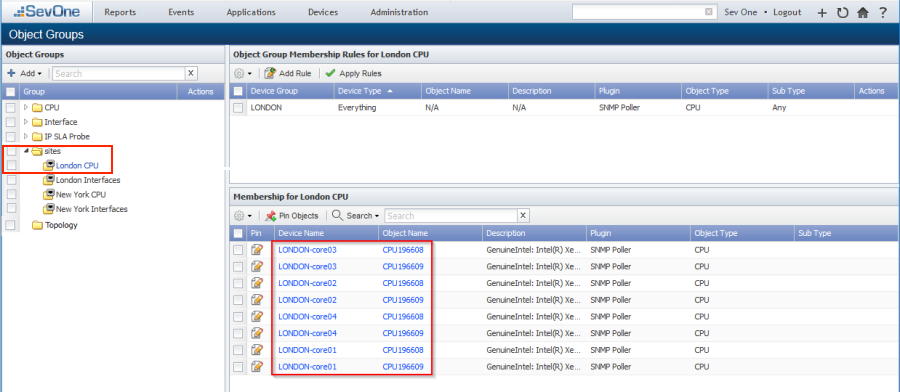
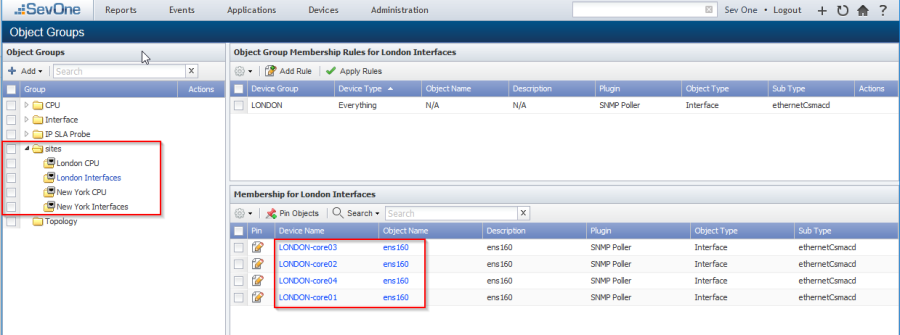
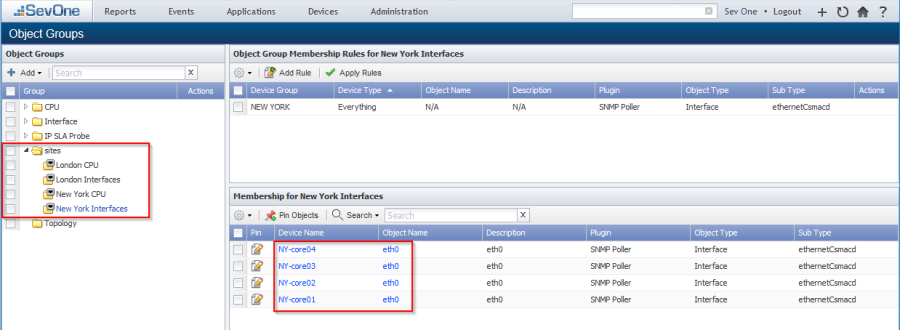
In this scenario, there will be one device group for each site containing all the required devices from that site. Let us call these disk groups New York and London, each configured with rules to contain devices from their respective sites. We can also have a specific object group configuration based on the site-specific device group for the Object Type Interface and CPU (Cisco IOS). In this example, we could have object groups London Interfaces and London CPU for the London site and similarly, object groups New York Interfaces and New York CPU for the New York site.
The group poller can now perform statistical calculations to aggregate the values and store the calculated values into a single pseudo indicator of the deferred data object. In this example, we would have configured aggregations called Interfaces and CPUs, and each aggregation can have one or more metrics configured. For the Interfaces aggregation, we would configure two metrics, In Traffic for all incoming traffic which will be aggregated via the HCInOctets indicators, and Out Traffic that will be aggregated using the HCOutOctets. Every aggregation metric supports various statistical aggregation operations like minimum, maximum, average and total. Each aggregation operation for a metric will be stored in a distinct deferred data indicator. In this example, we would have new indicator type created by the group poller and these will be called In Traffic average, In Traffic minimum, In Traffic maximum and In Traffic total that are associated with the new Interfaces Object Type. Similarly, we would have similar Indicator Types created for each metric operation for every aggregation defined in the group poller configuration, like CPU Load for the CPU (Cisco IOS) Object Type.
Using these group poller aggregated indicators, we can get a single aggregated view of the incoming traffic, outgoing traffic, CPU Load, etc. for each site. For example, you can get the average and total of all incoming/outgoing traffic to understand how much bandwidth is used at each site, and this can be useful for capacity planning, for instance. Similarly, you can also get the minimum and maximum incoming/outgoing traffic to understand the peak traffic during different hours of the day. This could be useful for configuring traffic shaping or setting up QoS policies. The group poller can perform such statistical calculations in the form of aggregations of indicators belonging to any supported plugin within SevOne NMS.
The Object Type will not include any child types in the Hierarchical Object Types structure. Only the explicitly mentioned Object Type will be matched.
Prerequisites
Make sure to have the following before starting:
-
Command line access to your SevOne NMS appliance with the root user access credentials (root user login and password).
-
An SSH client, such as PuTTY.
Configuration
The SevOne group poller uses the Deferred Data plugin to create customer defined aggregations (objects) and metrics (indicators) based on device group or object group memberships.
Perform the steps below to configure and create group aggregated indicators in a SevOne NMS cluster.
Create Device Groups or Device Types
You can create new device groups as placeholders for group polling or you can use existing device groups that you may have already configured. You may also use a Device Type to configure the group poller since a Device Type is the same as a Device Group in SevOne NMS. For more information on creating device group and/or device types, please refer to SevOne NMS User Guide.
-
In SevOne NMS, from the navigation bar, click the Devices menu, select Grouping, and then select Device Groups.
-
Create a device group and you can give it a name of your choice.
Create Object Groups
You can create new object groups as placeholders for group polling or you can also use existing object groups that you may have already configured. For more information on creating object groups, please refer to the SevOne NMS User Guide.
-
In SevOne NMS, from the navigation bar, click the Devices menu, select Grouping, and then select Object Groups.
-
If necessary, create an object group to function as the object class. You may want to do this if you plan to create more than one object group. In this case, the object class will function as a parent placeholder for the object groups you create.
-
Create several object groups depending on your needs. If you created an object class in the previous step, make these object groups children to the object class.
Determine the Indicators to Aggregate
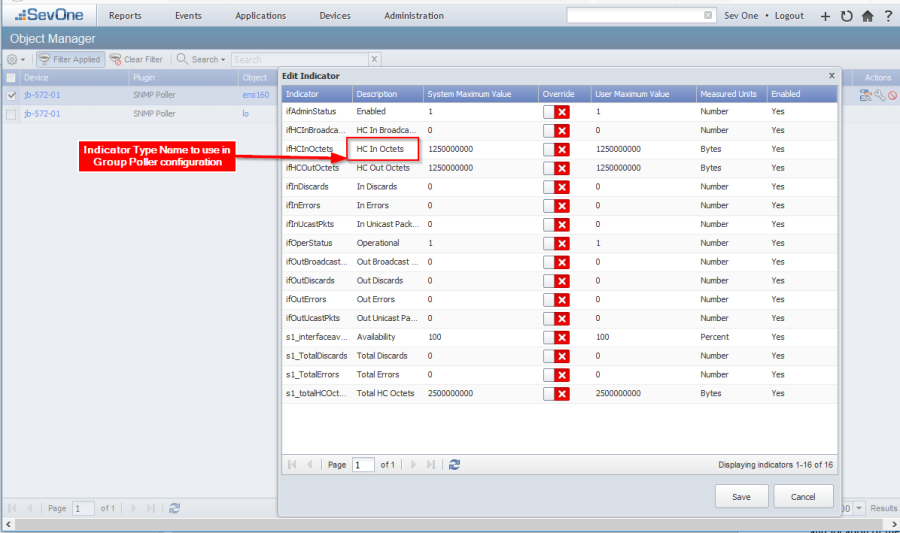
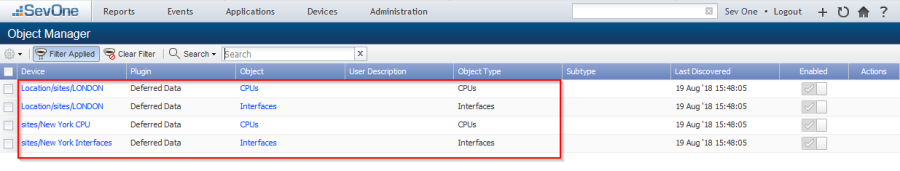
For aggregation to work, it must find objects that have instances of the same indicator types on your member devices. For instance, the indicator HC In Octets exists on most Interface objects. The Object Manager enables you to view the objects on the devices you select to ensure they exist.
Perform the following steps to view the indicators for the objects you select. You will need the names of these indicator types for the aggregations.xml file.
-
To access the Object Manager from the navigation bar, click the Devices menu and select Object Manager.
-
Filter based on your requirement and then select the check box for an object.
-
In the upper left corner of the page, click
 .
.
-
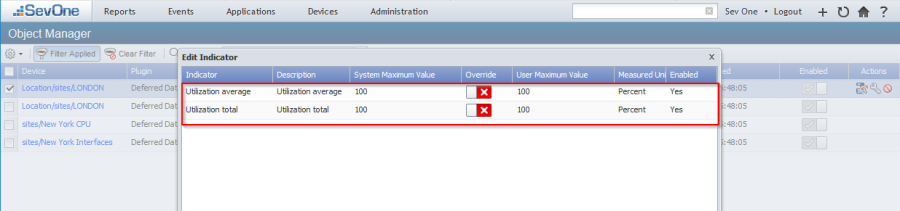
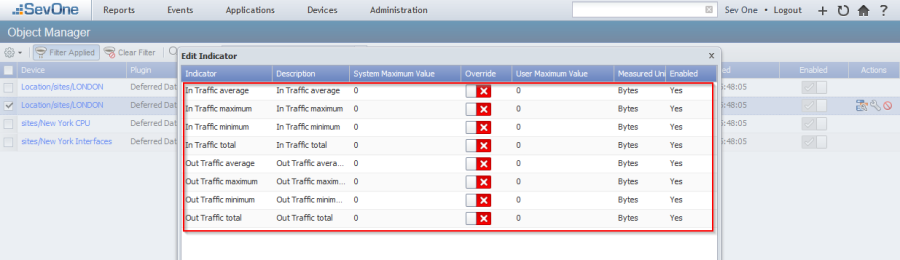
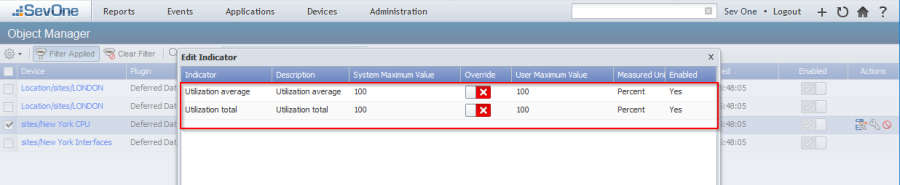
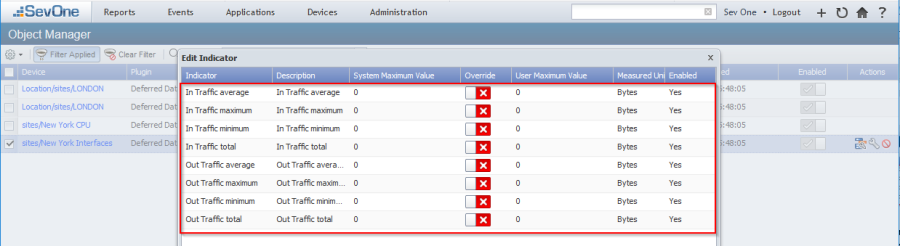
Select Edit Indicators to display the Edit Indicator pop-up.
-
Indicator names for the selected object appear in the Indicator column. Make sure to use the name from the relevant Description column listed here (and not the name that appears in the Indicator column). You will need these indicator names for the <indicatorType> element in the aggregations.xml file. In the example below, use HC In Octets and HC Out Octets as shown.
Configure XML Tags
The group poller configuration consists of two distinct configuration files. Perform the steps below to configure tags in the configuration files. The configuration file names and location provided in this guide are simple naming conventions used as an example, but you can use configuration file names and the location of your choice as long as the same names and file location are used for the group poller configuration. Please refer to section Example Group Polling Configuration for examples of the .xml files to configure.
Create a configuration directory
-
SSH into your SevOne NMS appliance as root user.
-
Execute the following command to create a directory to save the relevant .xml files to:
$mkdir-p/etc/sevone/group-poller
Aggregation Tags
aggregations.xml – This configuration file controls the plugin, object type, and indicator type to calculate for each aggregation metric. Each aggregation can have multiple metrics. For each metric, you can specify the statistical operations (minimum, maximum, average, or total). During the group poller execution time, it refers to the configuration in the aggregations.xml and for each aggregation tag, a unique deferred data Object Type will be created; and each metric operation will result in a deferred data Indicator Type, if these do not already exist.
-
SSH into your SevOne NMS appliance as root.
-
Locate the following file example aggregations file.
$ls-l/usr/local/scripts/utilities/plugins/group-poller/example-aggregations.xml -
Copy the file to the directory you created as aggregations.xml. Copying the file to a separate directory prevents it from being overwritten during an upgrade. If you name this file something other than aggregations.xml, make sure to provide the correct name of this file as referenced in the group-poller-config.xml file (see the <aggregationFile> tag).
$cp-a/usr/local/scripts/utilities/plugins/group-poller/example-aggregations.xml/etc/sevone/group-poller/aggregations.xml -
Using the text editor of your choice, edit aggregations.xml.
-
Add the following XML tags. For each aggregation, a deferred data object type will be created. Every metric operation will result in an Indicator Type of Gauge format. The Counter format on the group poller aggregated Indicator Type is not supported.
-
<aggregation>
-
<name> - The reference name, which becomes a pseudo object type. This same reference name must also appear in the group-poller-config.xml.
-
<metric> - Configure the following elements for the new indicator types. For each additional indicator type, add a new <metric> tag and configure the same tags for it.
-
<name> - The indicator name for the new object created. This can be anything.
-
<units> - The unit of measurement for this indicator type. This must match an existing measurement type, for example Bits, Bytes, Percent, Seconds, etc. and depending upon your Indicator Type itself that is to be aggregated.
-
<use> - Configure the following elements, which point to the indicator to be aggregated.
-
<plugin> - The name of the plugin (e.g., SNMP). This must match exactly with the name of the plugin in SevOne NMS.
-
<objectType> - The name of the object type. For example, Interface or CPU (Cisco IOS). This must match the name of the object type in SevOne NMS.
-
<indicatorType> - The name of the indicator type (e.g., HC In Octets, HC Out Octets, CPU Load, etc). This name comes from the indicators that you looked up in the section Determine the Indicators to Aggregate.
-
-
<operations>
Based on the values of operations configured here, when the group poller is executed, it will collect the raw atomic data for each of the defined metrics and it can calculate the minimum, maximum, average and/or total value for all the objects defined within the object group in the group poller configuration file explained in the next section.
-
-
-
<type> - The type of operation. Options include average, minimum, maximum, and total. You can add more than one operation for each metric. A separate entry is required for each.
The objectType will not include any child types in the Hierarchical Object Types structure. Only the explicitly mentioned objectType will be matched.
-
-
Save and close the file.
Configuration Tags
group-poller-config.xml - This configuration file is to specify the aggregated calculations that need to be performed on the indicators belonging to Device Groups or Object Groups referencing the aggregations and metrics configured in the aggregations.xml configuration file. This configuration file specifically references the file path to the aggregations.xml.
Perform the following steps to configure the groups and aggregations to calculate in group-poller-config.xml.
-
SSH into your SevOne NMS appliance as root.
-
Locate the /usr/local/scripts/utilities/plugins/group-poller/example-config.xml file.
-
Execute the following command to copy the file to the directory you created. This will also rename the file to group-poller-config.xml. Copying the file to the new directory prevents it from being overwritten during an upgrade.
$cp-a/usr/local/scripts/utilities/plugins/group-poller/example-config.xml \/etc/sevone/group-poller/group-poller-config.xml -
Using the text editor of your choice, edit group-poller-config.xml file.
-
Add XML tags for each object group.
XML tags are case-sensitive.
-
<aggregationFile> - The absolute file path including the name of the .xml file which contains the configuration for the object types and indicator types created for the aggregation/group poller. The default name for this file is aggregations.xml. In our example, the absolute file path to use in this tag is /etc/sevone/group-poller/aggregations.xml (please refer to Aggregation Tags section for more details).
-
<pollInterval> - Set the value to be equal to the time (in seconds) between two polls of the group poller. It is parsed as a real number to handle poll intervals under 1 second. If it is not set, the default value is 300.0 seconds (standard 5 minute polling).
On every run of group poller, it calculates a cut-off time using the poll interval from the configuration file. Any data with timestamps before the cut-off time is considered too old and is not included in the aggregations. The formula for calculating the cut-off time is:
cut-off time = current poll time - (2 * pollInterval)
The pollInterval is multiplied by 2 in order to handle cases of one missing data point. Having this additional time before the time of the last group poller run also leads to ingesting the last valid value one more time in case of longer missing data intervals.
This setting does not adhere to or affect the polling intervals of the original indicators that are configured to be aggregated by the group poller (original indicators).
This value should match exactly the time between 2 runs of the group poller script configured in the cron job. When choosing how often to configure the poll time of the group poller, the administrator should try to match the poll time of original indicators:
group poller poll time = longest poll time of original indicators
For example, if the original indicators are polled at every 5 minutes (standard NMS polling), the group poller should be configured to poll on 5 minutes in the cron job and the value of <pollInterval> should be set to 300.0 in the config file. In case the original indicators are polled using different poll intervals, the group poller should be configured to poll using the same poll interval as the longest poll interval of all original indicators. In case a more frequent poll time is needed for the group poller, it is not recommend to configure it to use a poll time shorter than the longest poll time of the original indicators divided by 2.
group poller poll time = longest poll time of the original indicators / 2
Example-
Device A has SNMP indicator X polled every 3 minutes.
-
Device B has SNMP indicator Y polled every 5 minutes.
-
Device C has SNMP indicator Z polled every 10 minutes.
-
Group poller is configured to poll these 3 indicators (X, Y, Z).
-
The longest poll time of all indicators (X, Y, Z) that the group poller is polling is 10 minutes, so it is recommended to configure the group poller to poll every 10 minutes (600 seconds).
-
In case the Group Poller should poll more often, the lowest recommended value for the <pollInterval> is 10 minutes / 2 = 5 minutes = 300.0 seconds
Group Poller produces the most accurate results when all original indicators and itself are polled using the same poll interval.
-
-
<waitInterval> - Set the value to be equal to time (in seconds). This option determines how many seconds to wait before exiting if another instance exists.
-
<group> - Configure the following tags. For each additional object group or device group, add a new <group> tag and configure the following tags for it.
-
<type> - The type of grouping. For an object group, enter Object. For a device group, enter Device.
-
<name> - The name of the object group or device group that you created. This will be used as the name for a new pseudo device created to host objects and indicators through the group poller. In the <name> field, the full path to the group name should be used. For instance, if using device group name for London site then, you should use Location/sites/LONDON as seen in the example below.
-
<aggregation> - The reference name that is used in aggregations.xml. It can be any name, but the aggregations.xml must have this identical reference name, as this will be used to create a pseudo object. You can specify multiple aggregation tags within each <group> tag.
-
-
-
Save and close the file.
Automating the Group Poller - Configure a Cron Job
Perform the following steps to make sure the appliance runs the group-poller.php script on a scheduled basis and that the configuration file is referenced correctly. The group poller is a deferred data script. The first time it is executed for an aggregate group, it will create objects and a pseudo device to encapsulate the aggregate.
-
SSH into your SevOne NMS appliance as root.
-
Using the text editor of your choice, create a file called group-poller.
Example$vi/etc/cron.d/group-poller -
Add the following content in the file. This adds group poller to cron so that it is executed every 5 minutes.
IMPORTANTIt is possible to change the frequency at which these are calculated if you need faster or slower aggregated data points but be very careful about configuring too many aggregations and turning this up too far. You need to ensure that the appliance CPU, disk, and network IO are not adversely impacted.
*/5* * * * root/usr/bin/php/usr/local/scripts/utilities/plugins/group-poller/group-poller.php/etc/sevone/group-poller/group-poller-config.xml >>/var/SevOne/SevOne-group-poller.log 2>&1 -
Save and close the file.
Example Group Polling Configuration
<?xml version="1.0" encoding="UTF-8"?><aggregations xmlns:xsi="http://www.w3.org/2001/XMLSchema-instance" xsi:schemaLocation="group-aggregation.xsd"> <aggregation> <name>Interfaces</name> <metric> <name>In Traffic</name> <units>Bytes</units> <use> <plugin>SNMP</plugin><!-- deviceType is also supported, add <deviceType> tag if needed --><!-- We strongly suggest using path of the objectType. Add a '/' in front, then we will treat it as path If you have a objectType type 'Disk' with deviceType 'Disk (Linux)' 'Disk/Disk (Linux)' is the path, and '/Disk/Disk (Linux)' should be put into the objectType tag. --> <objectType>Interface</objectType> <indicatorType>HC In Octets</indicatorType> </use> <operations> <type>average</type> <type>minimum</type> <type>maximum</type> <type>total</type> </operations> </metric> <metric> <name>Out Traffic</name> <units>Bytes</units> <use> <plugin>SNMP</plugin> <objectType>Interface</objectType> <indicatorType>HC Out Octets</indicatorType> </use> <operations> <type>average</type> <type>minimum</type> <type>maximum</type> <type>total</type> </operations> </metric> </aggregation> <aggregation> <name>CPUs</name> <metric> <name>Utilization</name> <units>Percent</units> <use> <plugin>SNMP</plugin> <objectType>CPU</objectType> <indicatorType>CPU Load</indicatorType> </use> <operations> <type>average</type> <type>total</type> </operations> </metric> </aggregation> <aggregation> <name>CPUs (Cisco IOS)</name> <metric> <name>Utilization</name> <units>Percent</units> <use> <plugin>SNMP</plugin> <objectType>CPU (Cisco IOS)</objectType> <indicatorType>CPU 5 Minute Average</indicatorType> </use> <use> <plugin>SNMP</plugin> <objectType>CPU</objectType> <indicatorType>CPU Load</indicatorType> </use> <operations> <type>average</type> <type>total</type> </operations> </metric> </aggregation></aggregations> The objectType will not include any child types in the Hierarchical Object Types structure. Only the explicitly mentioned objectType will be matched.
<?xml version="1.0" encoding="UTF-8"?><groups xmlns:xsi="http://www.w3.org/2001/XMLSchema-instance" xsi:schemaLocation="group-polling.xsd"> <!-- Use this file for aggregations. --> <aggregationFile>/etc/sevone/group-poller/aggregations.xml</aggregationFile> <!-- Set this value to be equal of the time (in seconds) between 2 runs of the group-poller.php script --> <pollInterval>300.0</pollInterval> <!-- This option will determine how many seconds to wait before exit if another instance exists --> <waitInterval>300</waitInterval> <!-- For the LONDON Device Group, this aggregates the Interface and CPU stats. --> <!-- where LONDON device has a Hierarchical Object Type of CPUs (Cisco IOS). --> <group> <type>Device</type> <name>Location/sites/LONDON</name> <aggregation>Interfaces</aggregation> <aggregation>CPUs (Cisco IOS)</aggregation> </group> <!-- For the LONDON Device Group, this aggregates the Interface and CPU stats. --> <!-- where LONDON device does not have a Hierarchical Object Type of CPUs (Cisco IOS). --> <group> <type>Device</type> <name>Location/sites/LONDON</name> <aggregation>Interfaces</aggregation> <aggregation>CPUs</aggregation> </group> <!-- For the 'New York CPU' Object Group, this aggregates the CPU stats. --> <group> <type>Object</type> <name>sites/New York CPU</name> <aggregation>CPUs</aggregation> </group> <!-- For the 'New York Interface' Object Group, this aggregates the Interface stats. --> <group> <type>Object</type> <name>sites/New York Interfaces</name> <aggregation>Interfaces</aggregation> </group></groups>Execution workflow of the SevOne Group Poller
-
Every five minutes, the group poller script will be executed via a configured cron job.
-
For each of the <group> sections in group-poller-config.xml, the group poller script looks for the SevOne NMS device group or object group (based on the <type> attribute) that matches the specified name of the group. (please refer to Create Device Groups or Device Types and Create Object Groups sections). Also, refer to the Example Group Polling Configuration section.
-
Specified aggregations which are defined in the aggregations.xml file are referenced and applied. The file aggregations.xml is referenced in group-poller-config.xml using the <aggregationFile> tag. Please refer to the Example Group Polling Configuration section.
-
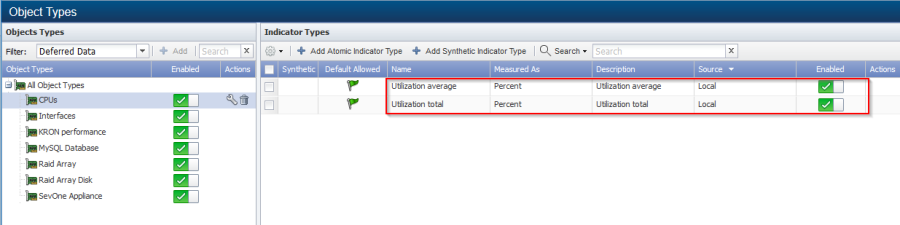
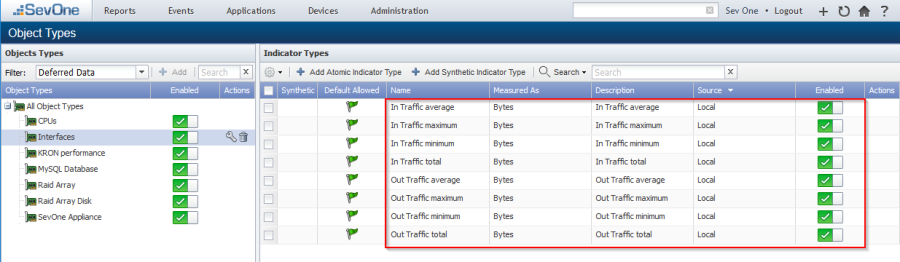
It automatically creates the deferred data Object Types for each aggregation, if it does not already exist in SevOne NMS. For each deferred data object type created for an aggregation, an Indicator Type will be created for every metric operation, if it does not already exist in SevOne NMS.
-
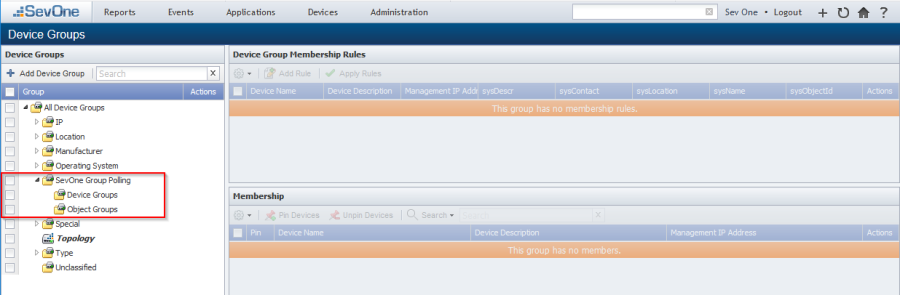
The group poller automatically creates a device group called SevOne Group Polling with two other child device groups called Device Groups and Object Groups, if these do not already exist.
-
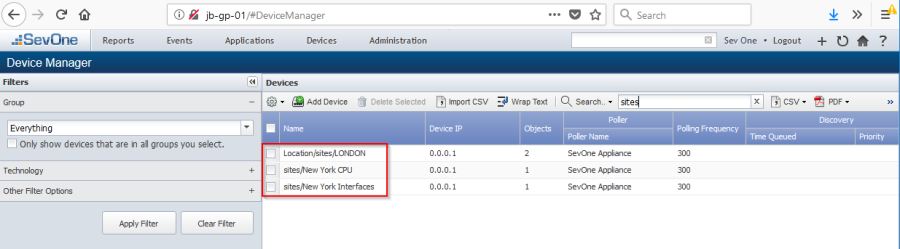
Based on the device group or object group name configured within the <group> tag of the group-poller-config.xml configuration file, a pseudo device will automatically be created using the same device or object group name. This pseudo device will be the placeholder device in SevOne NMS for the deferred data objects and the aggregated indicators.
-
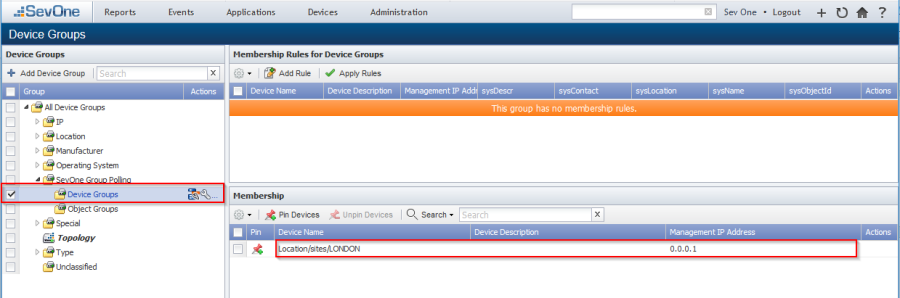
Each pseudo device that is created by the group poller will automatically be assigned to either the Device Groups or Object Groups device group within the SevOne Group Polling device group, depending on the group <type>.
-
For each <aggregation> tag configured in the group-poller-config.xml configuration file, a pseudo object will be created which will be associated to the pseudo device for that group.
-
Each metric operation configured within the <operation> tag in the aggregations.xml file will have a pseudo indicator created that will be associated to the respective pseudo objects for the aggregations.
-
Each time the group poller is executed, the aggregated calculations will be performed and stored within the specific pseudo indicator depending upon the statistical calculation performed.
-
SevOne NMS users can perform any operations within SevOne NMS on these group poller elements as you would for any other device/object/indicator within SevOne NMS. For example, you can create thresholds, run reports and graphs, apply work hours, maintenance windows, etc. just like any other device, object, indicator within the SevOne NMS.
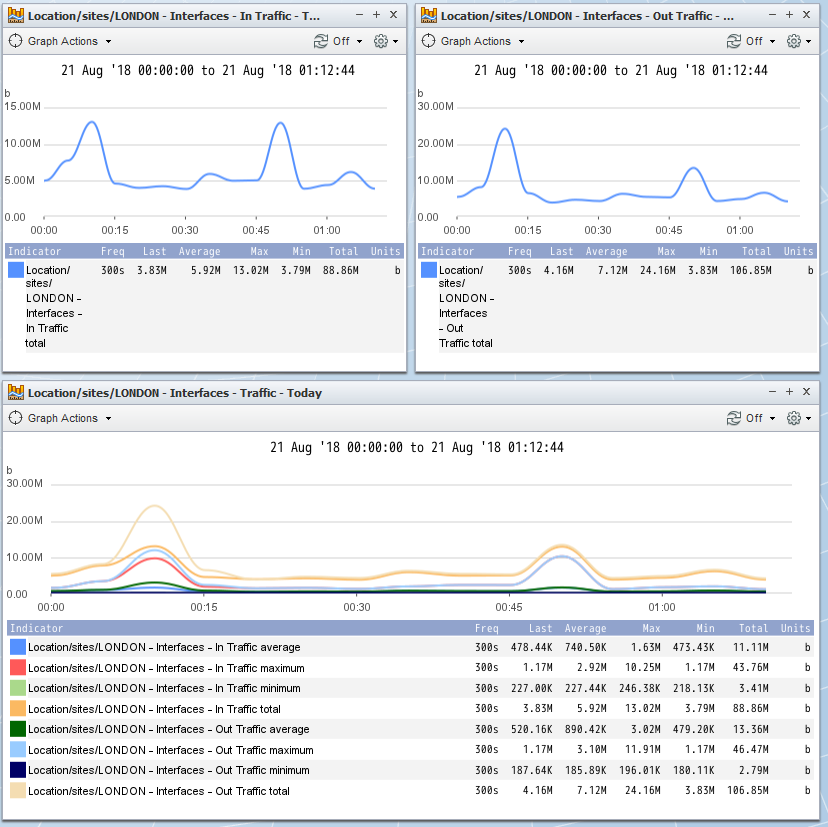
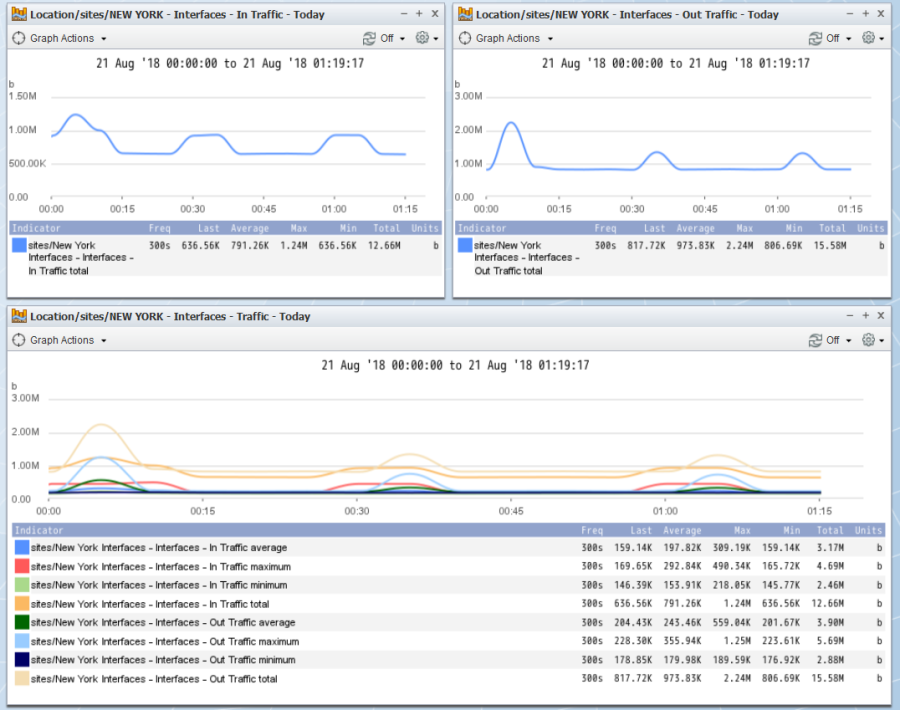
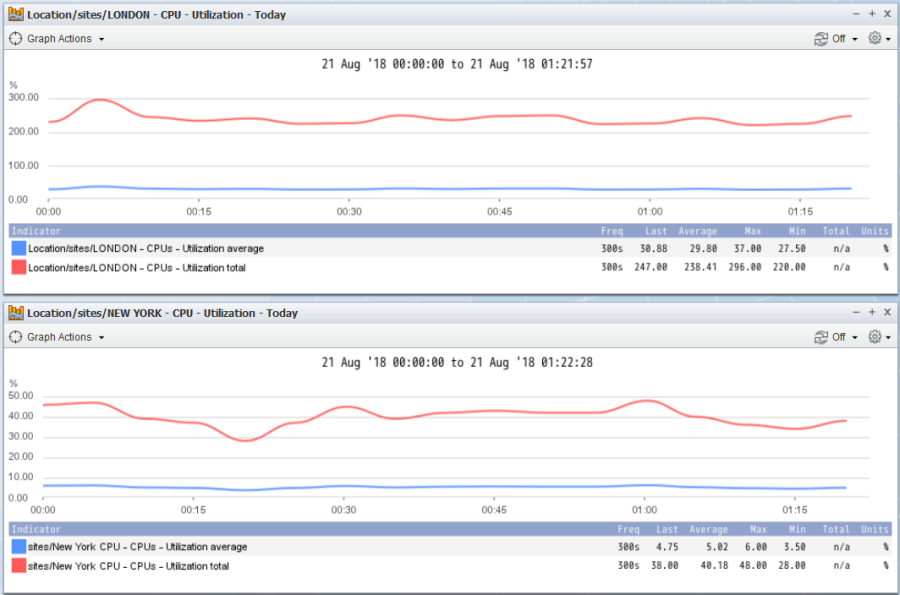
Here are some graphs that have been collected after 24 hour period of aggregations performed by the group poller. This gives an aggregated Traffic and CPU representation per site.
Troubleshooting
Why do I not see the Group Poller aggregated objects in the SevOne NMS?
Try to run the group poller script manually using the following syntax to check for any errors in your configuration files. If this command completes correctly, you should see no errors and there should be group aggregated objects available for reports in SevOne NMS.
$ /usr/bin/php /usr/local/scripts/utilities/plugins/group-poller/group-poller.php \/etc/sevone/group-poller/group-poller-config.xmlWhere can I see the logs the group poller process generates?
All logging should appear in the /var/SevOne/SevOne-group-poller.log file.