Table of Contents (Start)
- Topics
- Introducing SevOne
- Login
- Startup Wizard
- Dashboard
- Global Search - Advanced Search
- Report Manager
- Report Attachment Wizard
- Report Properties
- Report Interactions
- Instant Graphs
- TopN Reports
- Alerts
- Alert Archives
- Alert Summary
- Instant Status
- Status Map Manager
- Edit Maps
- View Maps
- FlowFalcon Reports
- NBAR Reports
- Logged Traps
- Unknown Traps
- Trap Event Editor
- Trap Destinations
- Trap Destination Associations
- Policy Browser
- Create and Edit Policies
- Webhook Definition Manager
- Threshold Browser
- Create and Edit Thresholds
- Probe Manager
- Discovery Manager
- Device Manager
- New Device
- Edit Device
- Object Manager
- High Frequency Poller
- Device Summary
- Device Mover
- Device Groups
- Object Groups
- Object Summary
- Object Rules
- VMware Browser
- AWS Plugin
- Azure Plugin (Public Preview)
- Calculation Plugin
- Database Manager
- Deferred Data Plugin
- DNS Plugin
- HTTP Plugin
- ICMP Plugin
- IP SLA Plugin
- JMX Plugin
- NAM
- NBAR Plugin
- Portshaker Plugin
- Process Plugin
- Proxy Ping Plugin
- SDWAN Plugin
- SNMP Plugin
- VMware Plugin
- Web Status Plugin
- WMI Plugin
- xStats Plugin
- Indicator Type Maps
- Device Types
- Object Types
- Object Subtype Manager
- Calculation Editor
- xStats Source Manager
- User Role Manager
- User Manager
- Session Manager
- Authentication Settings
- Preferences
- Cluster Manager
- Maintenance Windows
- Processes and Logs
- Metadata Schema
- Baseline Manager
- FlowFalcon View Editor
- Map Flow Objects
- FlowFalcon Views
- Flow Rules
- Flow Interface Manager
- MPLS Flow Mapping
- Network Segment Manager
- Flow Protocols and Services
- xStats Log Viewer
- SNMP Walk
- SNMP OID Browser
- MIB Manager
- Work Hours
- Administrative Messages
- Enable Flow Technologies
- Enable JMX
- Enable NBAR
- Enable SNMP
- Enable Web Status
- Enable WMI
- IP SLA
- SNMP
- SevOne Data Publisher
- Quality of Service
- Perl Regular Expressions
- Trap Revisions
- Integrate SevOne NMS With Other Applications
- Email Tips and Tricks
- SevOne NMS PHP Statistics
- SevOne NMS Usage Statistics
- Glossary and Concepts
- Map Flow Devices
- Trap v3 Receiver
- Guides
- Quick Start Guides
- AWS Quick Start Guide
- Azure Quick Start Guide (Public Preview)
- Data Miner Quick Start Guide
- Flow Quick Start Guide
- Group Aggregated Indicators Quick Start Guide
- IP SLA Quick Start Guide
- JMX Quick Start Guide
- Metadata Quick Start Guide
- RESTful API Quick Start Guide
- Self-monitoring Quick Start Guide
- SevOne NMS Admin Notifications Quick Start Guide
- SNMP Quick Start Guide
- Synthetic Indicator Types Quick Start Guide
- Topology Quick Start Guide
- VMware Quick Start Guide
- Web Status Quick Start Guide
- WMI Quick Start Guide
- xStats Quick Start Guide
- xStats Adapter - Accedian Vision EMS (TM) Quick Start Guide
- Deployment Guides
- Automated Build / Rebuild (Customer) Instructions
- Generate a Self-Signed Certificate or a Certificate Signing Request
- SevOne Best Practices Guide - Cluster, Peer, and HSA
- SevOne Data Platform Security Guide
- SevOne NMS Implementation Guide
- SevOne NMS Installation Guide - Virtual Appliance
- SevOne NMS Advanced Network Configuration Guide
- SevOne NMS Installation Guide
- SevOne NMS Port Number Requirements Guide
- SevOne NMS Upgrade Process Guide
- SevOne Physical Appliance Pre-Build BIOS and RAID Configuration Guide
- SevOne SAML Single Sign-On Setup Guide
- Cloud Platforms
- Other Guides
- Quick Start Guides
Alerts
The Alerts page enables you to display the current, active alerts in the system. Alerts are messages such as threshold violations, trap notifications, or web site errors you define on the Policy Browser and the Threshold Browser.
To access the Alerts page from the navigation bar, click the Events menu and select Alerts.
The Welcome Dashboard also provides access when you click Alerts in the Manage Events section.
SevOne recommends the alert archives are less than 2 million alerts. To trim, modify Administration > Cluster Manager > Cluster Settings tab > Alerts subtab > Alert Duration field or please contact SevOne Support for help.
A maximum of 50,000 active alerts making it to be 2 million archived alerts + 50,000 active alerts is recommended by SevOne.
To display different levels of Alert granularity, alerts can be grouped. Events > Alerts > Grouping drop-down enables you to manage the alerts and alert details that appear in the list.
Fresh installations with SevOne NMS 6.4 and above releases contain optimizations that allow SevOne NMS to evaluate alerts every one minute by default.
Clusters built on SevOne NMS 6.3 and below, evaluate alerts every 3 minutes. Administrators can change alert evaluation frequency via Command Line Interface.
$ SevOne-act checkmate set-frequency --fast$ SevOne-act checkmate set-frequency --normalThis affects all peers.
While SevOne-act checkmate set-frequency --fast option evaluates alerts every 1 minute, appliances that are overloaded may take more than 60 seconds to complete each evaluation cycle. In this case, the process will begin on the next minute when it is not already running.
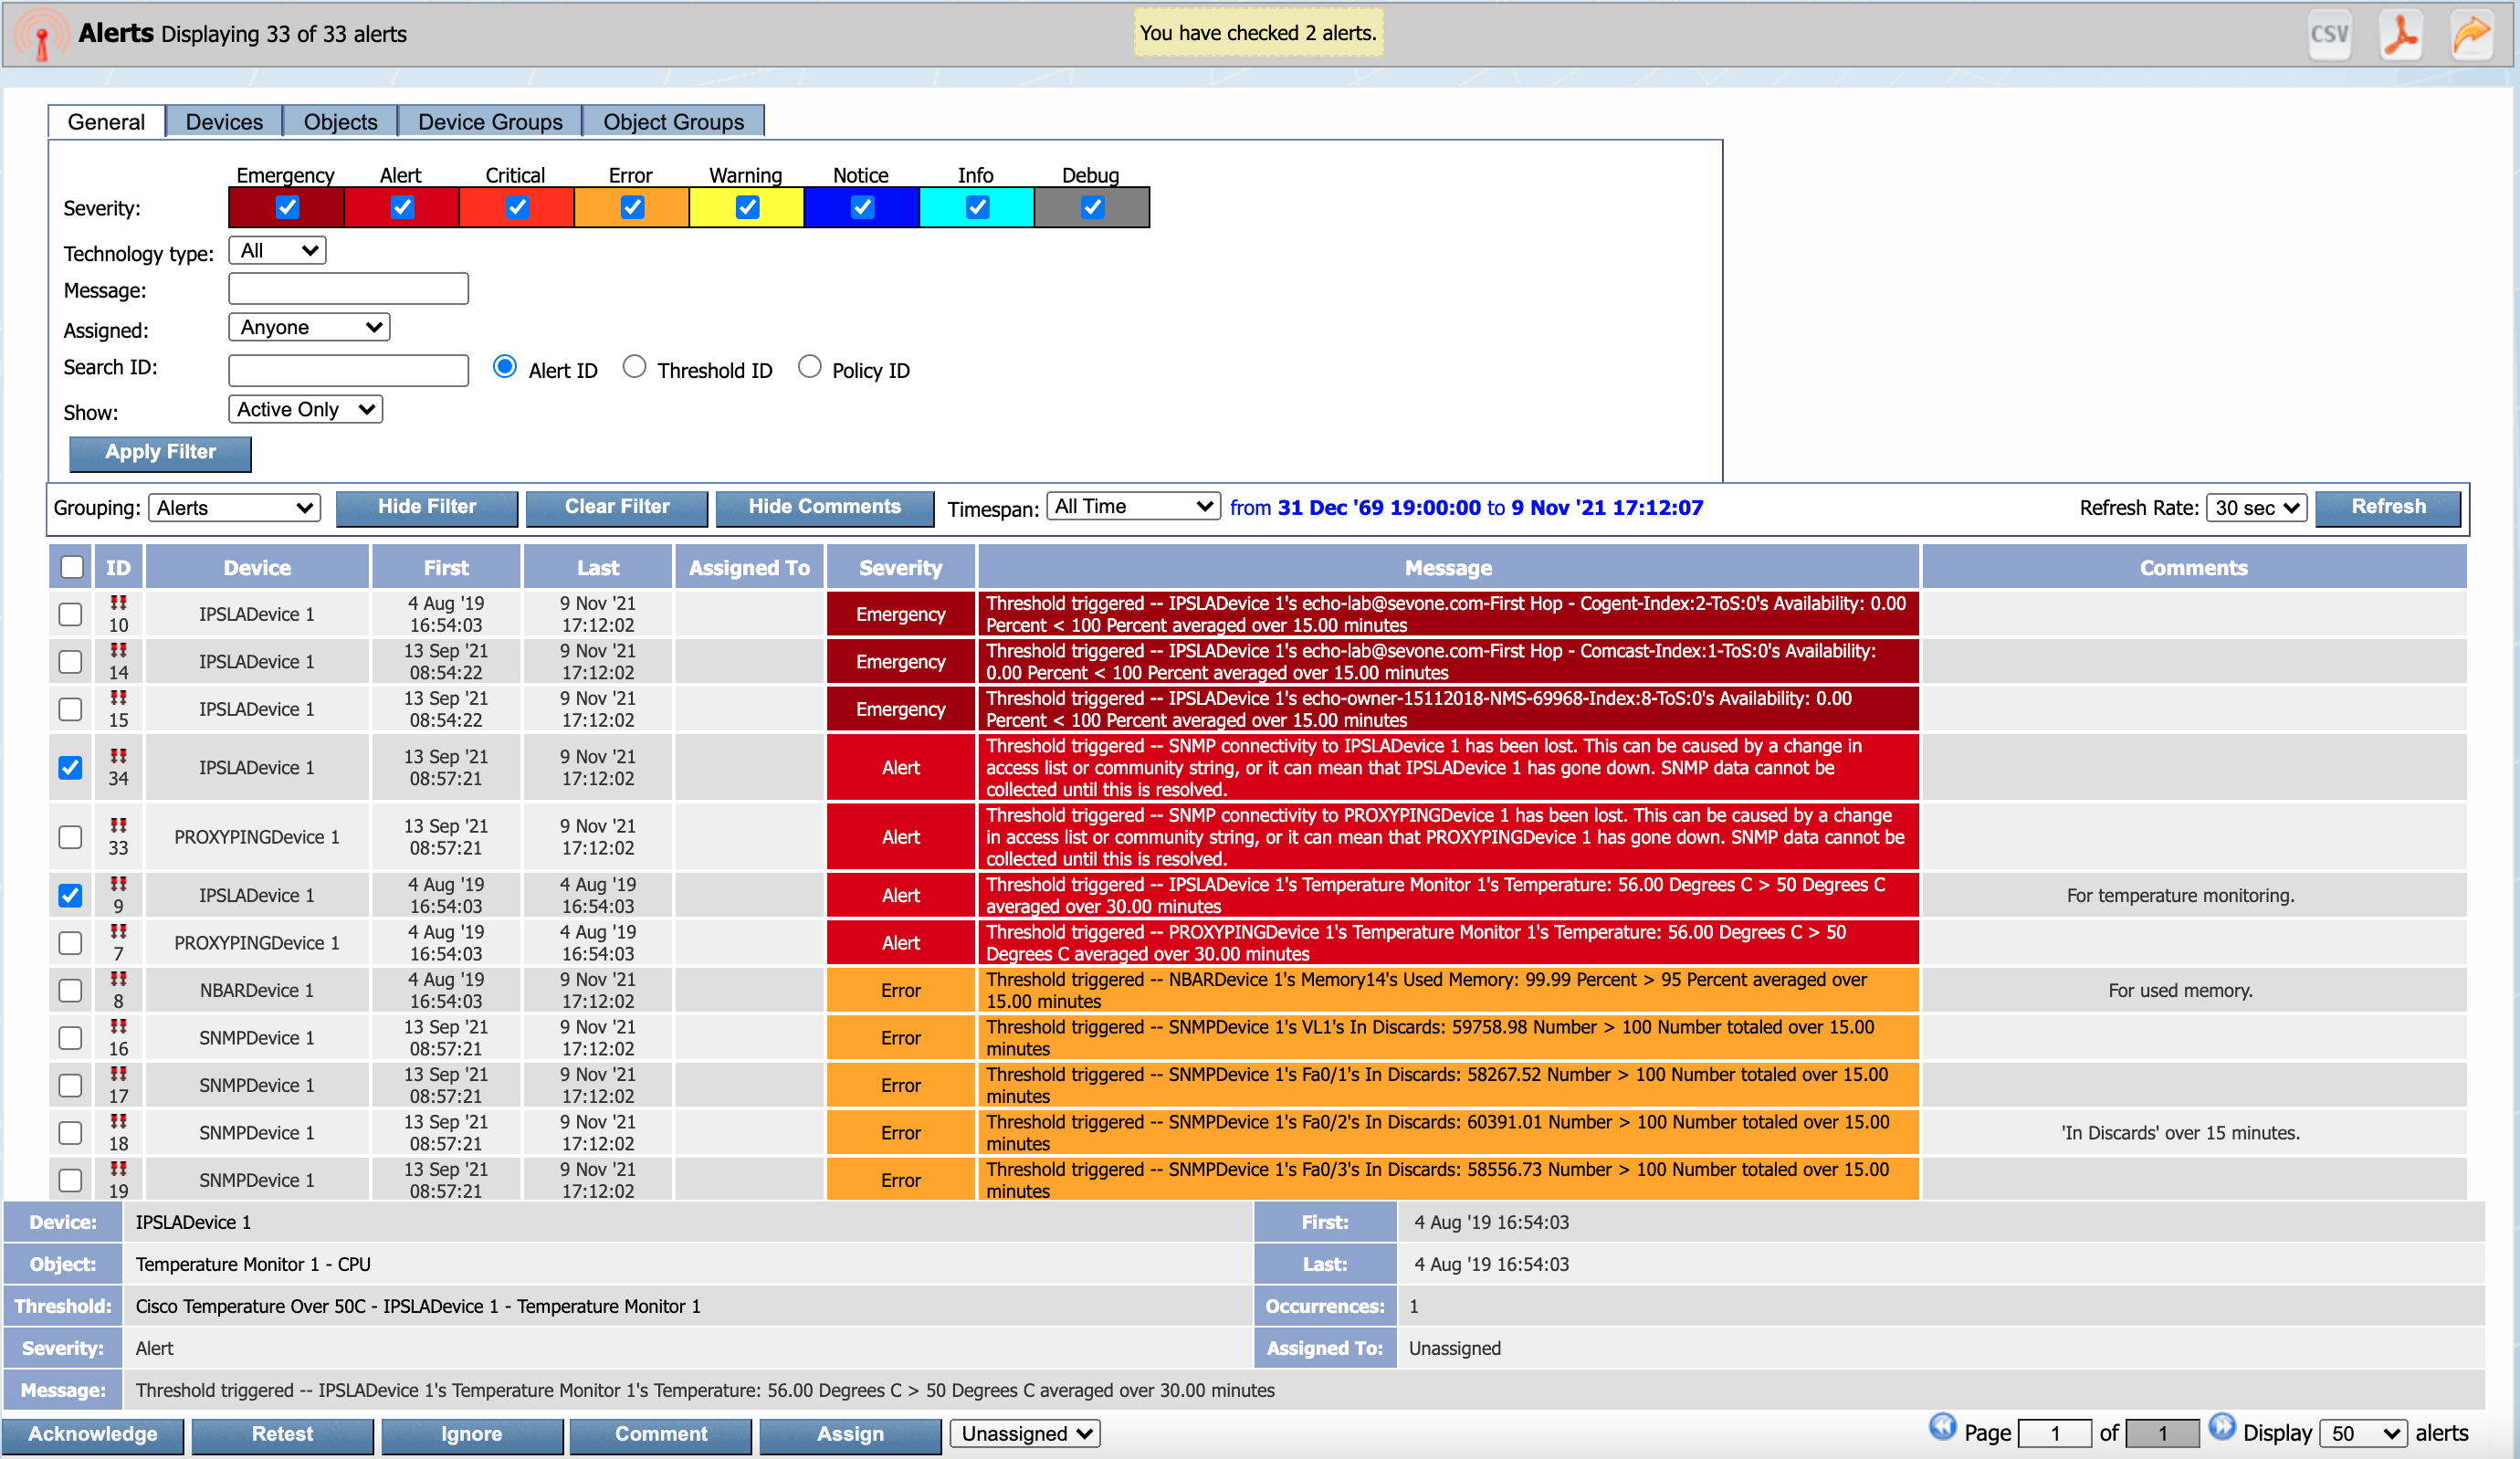
Alerts Default Display
The following appears by default when the Alerts page initially appears.
-
The browser tab displays the number of alerts for the highest severity level to enable you to view basic alert information at a glance. The Cluster Manager > Cluster Settings tab enables you to choose to not display alerts in the tab title.
-
The title bar displays the number of alerts that appear on the page and the total number of alerts.
-
The title bar contains the following icons to enable you to export the alerts you select in the list. A message appears to indicate how many alerts you select as you select the check boxes next to alerts.
When you select the check box in the header row, the alerts on the current page display a check mark in the check box but alerts on other pages are not selected.
 - Select the check box for the alerts to include in a .csv file and click to export the alerts you select to a .csv format.
 - Select the check box for the alerts to include in a .pdf file and click to export the alerts you select to a .pdf format.
 - Click to add the alerts report as an attachment in a report on a new browser tab. You can detach the entire alert list or you can select the check box for each alert to include in the report to detach specific alerts. You can modify reports to add other attachments and you can save reports to the Report Manager. Report workflows enable you to designate reports to be your favorite reports and to define one report to appear as your custom dashboard.
-
The Grouping drop-down is set to Alerts and the alerts sort by severity. Please refer to Group Alerts section below.
-
The Clear Object-level Filter button applies to Status Maps where object-level alerts are automatically filtered on objects and not on devices. Click this button to clear this filter and display all alerts.
-
The Filter section is hidden. Please refer to Alert List Filters section below.
-
Click Show Comments button to display the Comments column in the table. To hide the comments, click Hide Comments button.
-
The Time Span is set to All Time and displays the time span as a blue font link. The drop-down and the link enable you to define a time span.
-
Click the Refresh Rate drop-down and select the frequency to have the alert display refresh or click Refresh to refresh the alert data.
Alert List Filters
Filters enable you to focus the alerts display. Filters are optional and cumulative.
Click Show Filter to display the Filter section that contains four tabs. After you define the alerts list filters, the following controls enable you to apply the filters.
-
Click Hide Filter to close the filter section.
-
Click Apply Filter to apply the filters. When you apply filters, a red message appears next to the Clear Filter button.
-
Click Clear Filter to return the alerts list to the default filter settings.
General Filters
The following filters appear on the General tab.
-
Clear/select the check box for each Severity level to limit the alerts to the severities you specify.
-
Emergency - System is unusable.
-
Alert - Action must be taken.
-
Critical - Critical condition.
-
Error - Error condition.
-
Warning - Warning condition.
-
Notice - Normal but significant condition.
-
Info - Informational message.
-
Debug - Debug level message.
-
-
Click the Technology Type drop-down.
-
Select All to display both flow technology type and metric technology type alerts.
-
Select Flow to display only flow technology type alerts.
-
Select Metric to display only metric technology type alerts.
-
-
In the Message field, enter message text on which to filter alerts.
-
Click the Assigned drop-down and select the user id to display alerts assigned to it.
-
In the Search ID field, enter an alert identifier and select Alert ID, enter a threshold identifier and select Threshold ID, or enter a policy identifier and select Policy ID to search for an alert by ID. You must enter the full ID and wildcards are not allowed.
-
Click the Show drop-down.
-
Select Active Only to display only active alerts.
-
Select Ignored Only to display only ignored alerts.
-
Select Both to display active and ignored alerts.
-
Devices Filters
The Devices tab enables you to filter alerts for specific devices. Alerts for the devices you select display in the alerts list. Leave clear to display alerts for all devices.
Objects Filters
The Objects tab enables you to filter alerts for specific objects.
-
Click the Device drop-down and select the device that contains the objects that trigger the alerts to view.
-
Alerts for the objects you move to the field on the right appear in the alerts list. Leave the right side field clear to display alerts for all objects.
Device Groups Filters
The Device Groups tab enables you to filter alerts for specific device groups/device types. Click the Device Groups drop-down and select the check box for each device group/device type for which to display alerts. Leave all check boxes clear to display alerts for all device groups/device types.
Object Groups Filters
The Object Groups tab enables you to filter alerts for specific object groups. Alerts for the object groups you move to the field on the right appear in the alerts list. Leave the right side field clear to display alerts for all object groups.
Group Alerts
You can group alerts to display different levels of alert granularity. The Grouping drop-down enables you to manage the alerts and alert detail that appears in the list.
Grouping - Alerts
Click the Grouping drop-down and select Alerts. Alerts is the default grouping setting when the Alerts page initially appears. The Alerts grouping level is the most granular alerts display and this grouping level enables you to manage the individual alerts.
-
ID - Displays the internal tracking number for each alert.
-
 - The alert is unassigned.
 -
 - The alert is assigned.
-
-
Device - Displays the name of the device that triggered the alert. Flow technology alerts display Unknown Device for devices for which the SNMP plugin is not enabled and the name has not been resolved.
-
First - Displays the date and time that the alert was first reported to SevOne NMS.
-
Last - Displays the date and time that the alert was last reported to SevOne NMS.
-
Assigned To - Displays the user id to whom the alert is assigned. The default is for alerts to be Unassigned.
-
Severity - Displays the alert severity level.
-
Message - Displays the message the threshold generates.
-
Comments - To display the Comments column, click the Show Comments button. To hide the comments, click the Hide Comments button.
The Alerts grouping setting provides the following controls to enable you to view alert details and to manage alerts.
-
Click on an alert row to display the following additional information for the alert you select below the alert list.
-
Device - Displays the name of the device that triggered the alert. Click the device name to display a link to the Device Summary and links to the report templates that are applicable for the device.
-
Object - Displays the name of the object or interface that triggered the alert. Click the object name: For flow technology type alerts, the FlowFalcon Reports page appears and for metric technology type alerts, a link to the Object Summary and links to the report templates that are applicable for the object appear.
-
Threshold or Trap - Displays the name of the threshold or trap that triggered the alert. Click the threshold name to display the Threshold Editor or click the trap event name to display the Trap Event Editor. For details on this, please refer to section Trap Event Editor in SevOne NMS System Administration Guide.
-
Severity - Displays the alert severity level.
-
Message - Displays the message the threshold generates.
-
Ignore Message - Displays the name of the user who marked the alert to be ignored and the ignore message. (Ignored alerts only.)
-
First - Displays the date and time that the alert was first reported to SevOne NMS.
-
Last - Displays the date and time that the alert was last reported to SevOne NMS.
-
Occurrences - Displays the total number of times the alert triggered in the time frame between First and Last. The alert engine runs every three minutes. A policy based threshold requires ten minutes to gather enough data to trigger an alert. Therefore it can take up to thirteen minutes for the first alert for a new policy to appear.
-
Assigned To - Displays the name of the person or role to whom the alert is assigned. The default is for alerts to be unassigned.
-
-
Select the check box for each alert to acknowledge and click Acknowledge to acknowledge the alerts you select. Acknowledged alerts permanently move to the Alert Archives. A pop-up appears to enable you to enter an explanation for the acknowledgment.
-
Select the check box for each alert to test and click Retest to see if the threshold trigger condition still exists for the alerts you select. The alert engine runs every three minutes to retest all thresholds. If a threshold does not have a clear condition, the alert displays on the Alerts page until the alert is acknowledged. When you retest an alert that is triggered by a threshold with no clear condition, even if the trigger condition is no longer met, the alert continues to display on the Alerts page but the Last date and time does not change.
-
Select the check box for each alert to ignore and click Ignore to ignore the alerts you select. A pop-up appears to enable you to define the time span for which to ignore the alert and to enter a note. Filters enable you to not display alerts you ignore on the Alerts page. No emails and traps are sent from ignored alerts for the time span you enter.
-
To add, edit, or delete a comment for an alert, select the check box for the alert. Click Comment button. A pop-up appears which allows you to add a comment or modify the existing comment. Click Save. To delete the comment, click the Delete button in the pop-up.
-
Select the check box for each alert to assign, click the drop-down next to the Assign button and select the name of the person to whom to assign the alerts you select, and then click Assign to assign the alerts you select to the person or role you select from the drop-down list.
Grouping - Devices
Click the Grouping drop-down and select Devices.
-
Device - Displays the name of the device that triggered alerts.
-
First - Displays the date and time that the first alert for the device was first reported to SevOne NMS.
-
Last - Displays the date and time that the last alert for the device was last reported to SevOne NMS.
-
Highest Severity - Displays the highest severity level of the alerts on the device.
-
Message - Displays the total number of alerts the device triggered and the highest severity level of the alerts on the device.
Click on either a device name or on a message to display the alerts list with the Alerts grouping setting and filters applied to display alerts for only the device you select. Please refer to Grouping - Alerts section above.
Grouping - Device Groups
Click the Grouping drop-down and select Device Groups to display the following alert information.
-
Device Group - Displays the name of the device group/device type that triggered alerts.
-
First - Displays the date and time that the first alert for the device group/device type was first reported to SevOne NMS.
-
Last - Displays the date and time that the last alert for the device group/device type was last reported to SevOne NMS.
-
Highest Severity - Displays the highest severity level of the alerts in each device group/device type.
-
Message - Displays the total number of alerts the device group/device type triggered and the highest severity level of the alerts in the device group/device type.
Click on either a device group/device type name or on a message to display the alerts list with the Devices grouping setting and filters applied to display alerts for only the devices in the device group/device type you select. Please refer to Grouping - Devices section above.
Grouping - Object Groups
Click the Grouping drop-down and select Object Groups to display the following alert information.
-
Object Group - Displays the name of the object group that triggered alerts.
-
First - Displays the date and time that the first alert for the object group was first reported to SevOne NMS.
-
Last - Displays the date and time that the last alert for the object group was last reported to SevOne NMS.
-
Highest Severity - Displays the highest severity level of the alerts in each object group.
-
Message - Displays the total number of alerts the object group triggered and the highest severity level of the alerts in the object group.
Click on either an object group name or on a message to display the alerts list with the Devices grouping setting and filters applied to display alerts for only the devices in the object group you select. Please refer to Grouping - Devices section above.
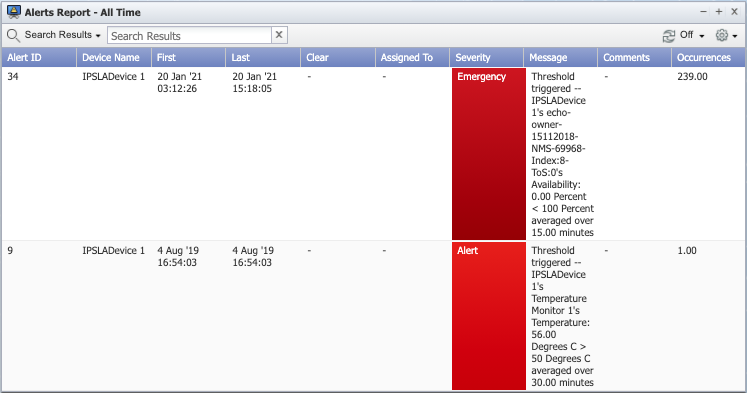
Alerts Report
To view an instant Alerts Report, click on  to detach the report first. In a new tab, you will see the Instant Report for Alerts Report.
-
Alert ID - Displays the internal tracking number for each alert.
-
Device Name - Displays the name of the device that triggered the alert. Flow technology alerts display Unknown Device for devices for which the SNMP plugin is not enabled and the name has not been resolved.
-
First - Displays the date and time that the alert was first reported to SevOne NMS.
-
Last - Displays the date and time that the alert was last reported to SevOne NMS.
-
Clear - Displays the date and time that the archived alert was cleared / acknowledged.
-
Assigned To - Displays the user id to whom the alert is assigned. The default is for alerts to be Unassigned.
-
Severity - Displays the alert severity level.
-
Message - Displays the message the threshold generates.
-
Comments - This column is only displayed if you have Show Comments button selected. Otherwise, the Comments column is hidden.
-
Occurrences - Displays the total number of times the alert triggered in the time frame between First and Last.