Table of Contents (Start)
- Topics
- Introducing SevOne
- Login
- Startup Wizard
- Dashboard
- Global Search - Advanced Search
- Report Manager
- Report Attachment Wizard
- Report Properties
- Report Interactions
- Instant Graphs
- TopN Reports
- Alerts
- Alert Archives
- Alert Summary
- Instant Status
- Status Map Manager
- Edit Maps
- View Maps
- FlowFalcon Reports
- NBAR Reports
- Logged Traps
- Unknown Traps
- Trap Event Editor
- Trap Destinations
- Trap Destination Associations
- Policy Browser
- Create and Edit Policies
- Webhook Definition Manager
- Threshold Browser
- Create and Edit Thresholds
- Probe Manager
- Discovery Manager
- Device Manager
- New Device
- Edit Device
- Object Manager
- High Frequency Poller
- Device Summary
- Device Mover
- Device Groups
- Object Groups
- Object Summary
- Object Rules
- VMware Browser
- AWS Plugin
- Azure Plugin (Public Preview)
- Calculation Plugin
- Database Manager
- Deferred Data Plugin
- DNS Plugin
- HTTP Plugin
- ICMP Plugin
- IP SLA Plugin
- JMX Plugin
- NAM
- NBAR Plugin
- Portshaker Plugin
- Process Plugin
- Proxy Ping Plugin
- SDWAN Plugin
- SNMP Plugin
- VMware Plugin
- Web Status Plugin
- WMI Plugin
- xStats Plugin
- Indicator Type Maps
- Device Types
- Object Types
- Object Subtype Manager
- Calculation Editor
- xStats Source Manager
- User Role Manager
- User Manager
- Session Manager
- Authentication Settings
- Preferences
- Cluster Manager
- Maintenance Windows
- Processes and Logs
- Metadata Schema
- Baseline Manager
- FlowFalcon View Editor
- Map Flow Objects
- FlowFalcon Views
- Flow Rules
- Flow Interface Manager
- MPLS Flow Mapping
- Network Segment Manager
- Flow Protocols and Services
- xStats Log Viewer
- SNMP Walk
- SNMP OID Browser
- MIB Manager
- Work Hours
- Administrative Messages
- Enable Flow Technologies
- Enable JMX
- Enable NBAR
- Enable SNMP
- Enable Web Status
- Enable WMI
- IP SLA
- SNMP
- SevOne Data Publisher
- Quality of Service
- Perl Regular Expressions
- Trap Revisions
- Integrate SevOne NMS With Other Applications
- Email Tips and Tricks
- SevOne NMS PHP Statistics
- SevOne NMS Usage Statistics
- Glossary and Concepts
- Map Flow Devices
- Trap v3 Receiver
- Guides
- Quick Start Guides
- AWS Quick Start Guide
- Azure Quick Start Guide (Public Preview)
- Data Miner Quick Start Guide
- Flow Quick Start Guide
- Group Aggregated Indicators Quick Start Guide
- IP SLA Quick Start Guide
- JMX Quick Start Guide
- Metadata Quick Start Guide
- RESTful API Quick Start Guide
- Self-monitoring Quick Start Guide
- SevOne NMS Admin Notifications Quick Start Guide
- SNMP Quick Start Guide
- Synthetic Indicator Types Quick Start Guide
- Topology Quick Start Guide
- VMware Quick Start Guide
- Web Status Quick Start Guide
- WMI Quick Start Guide
- xStats Quick Start Guide
- xStats Adapter - Accedian Vision EMS (TM) Quick Start Guide
- Deployment Guides
- Automated Build / Rebuild (Customer) Instructions
- Generate a Self-Signed Certificate or a Certificate Signing Request
- SevOne Best Practices Guide - Cluster, Peer, and HSA
- SevOne Data Platform Security Guide
- SevOne NMS Implementation Guide
- SevOne NMS Installation Guide - Virtual Appliance
- SevOne NMS Advanced Network Configuration Guide
- SevOne NMS Installation Guide
- SevOne NMS Port Number Requirements Guide
- SevOne NMS Upgrade Process Guide
- SevOne Physical Appliance Pre-Build BIOS and RAID Configuration Guide
- SevOne SAML Single Sign-On Setup Guide
- Cloud Platforms
- Other Guides
- Quick Start Guides
JMX Quick Start Guide
SevOne Documentation
All documentation is available from the IBM SevOne Support customer portal.
© Copyright International Business Machines Corporation 2024.
All right, title, and interest in and to the software and documentation are and shall remain the exclusive property of IBM and its respective licensors. No part of this document may be reproduced by any means nor modified, decompiled, disassembled, published or distributed, in whole or in part, or translated to any electronic medium or other means without the written consent of IBM.
IN NO EVENT SHALL IBM, ITS SUPPLIERS, NOR ITS LICENSORS BE LIABLE FOR ANY DAMAGES, WHETHER ARISING IN TORT, CONTRACT OR ANY OTHER LEGAL THEORY EVEN IF IBM HAS BEEN ADVISED OF THE POSSIBILITY OF SUCH DAMAGES, AND IBM DISCLAIMS ALL WARRANTIES, CONDITIONS OR OTHER TERMS, EXPRESS OR IMPLIED, STATUTORY OR OTHERWISE, ON SOFTWARE AND DOCUMENTATION FURNISHED HEREUNDER INCLUDING WITHOUT LIMITATION THE WARRANTIES OF DESIGN, MERCHANTABILITY OR FITNESS FOR A PARTICULAR PURPOSE, AND NONINFRINGEMENT.
IBM, the IBM logo, and SevOne are trademarks or registered trademarks of International Business Machines Corporation, in the United States and/or other countries. Other product and service names might be trademarks of IBM or other companies. A current list of IBM trademarks is available on ibm.com/trademark.
About
JMX stands for Java Management Extensions. This technology is used for application monitoring in addition to monitoring other resources such as, devices, services, and Java virtual machines (JVMs) as they are created, installed, and implemented. When using SevOne NMS for JMX monitoring, you can perform historical analyses on JMX data as well as set up baselining and alerting.
The JMX architecture can be broken down into three layers or levels.
-
Instrumentation Level - can manage and monitor.
-
Agent Level - is the middle layer. The main component of this level is the MBean server, where Managed Beans (MBeans) are registered. These magic beans expose management interfaces on the resources from the Instrumentation Level, making it possible for them to be monitored.
-
Remote Management Level - is made up of connectors and adaptors that enable remote applications, such as SevOne NMS, to access the MBean server. The Remote Management Level sends requests and commands to the Agent Level.
This document provides details to set up monitoring with JMX. It provides the necessary steps to enable the JMX plugin within SevOne NMS followed by how to manage JMX Object Types and Indicator Types.
Why JMX?
JMX has the following capabilities.
-
can run on almost all devices enabled with Java technology
-
it is protocol-independent
-
can be be used to monitor a large number and wide variety of resources
-
provides access to real-time information for resources
Prerequisites
You must have the following.
-
JMX server host name or IP address
-
Username and password to authenticate onto the JMX server. This is necessary only if you plan to use authentication.
Enable Devices to Send Data to SevOne NMS
You must enable devices to sent JMX data before proceeding to the next section.
The subsections below include instructions for a number of devices. This workflow is outside of SevOne NMS and may not include all of the steps that your network requires to enable devices to send JMX data. You may need to refer to your device manufacturer's documentation for specific instructions.
The port numbers and IP addresses included in the commands below are examples. If necessary, replace them with the appropriate port numbers and IP addresses for your specific devices.
Tomcat
For Tomcat servers, enter the following commands in the startup script.
JAVA_OPTS="$JAVA_OPTS -Dcom.sun.management.jmxremote"JAVA_OPTS="$JAVA_OPTS -Dcom.sun.management.jmxremote.port=8007"JAVA_OPTS="$JAVA_OPTS -Dcom.sun.management.jmxremote.authenticate=false"JAVA_OPTS="$JAVA_OPTS -Dcom.sun.management.jmxremote.ssl=false"JAVA_OPTS="$JAVA_OPTS -Djava.rmi.server.hostname=192.168.50.213"WebLogic
For WebLogic, enter the following commands in the startup script.
/opt/Oracle/Middleware/wlserver_10.3/samples/domains/wl_server/bin/startWebLogic.shJAVA_OPTIONS="$JAVA_OPTIONS -Dcom.sun.management.jmxremote"JAVA_OPTIONS="$JAVA_OPTIONS -Dcom.sun.management.jmxremote.port=8007"JAVA_OPTIONS="$JAVA_OPTIONS -Dcom.sun.management.jmxremote.authenticate=false"JAVA_OPTIONS="$JAVA_OPTIONS -Dcom.sun.management.jmxremote.ssl=false"JAVA_OPTIONS="$JAVA_OPTIONS -Djava.rmi.server.hostname=192.168.30.251"JAVA_OPTIONS="$JAVA_OPTIONS -Djavax.management.builder.initial=weblogic.management.jmx.mbeanserver.WLSMBeanServerBuilder"You need to enable this on the Administrative page. Navigate to Domain > Configuration > General page > Advanced options. Then, select usePlatformMBean and exportPlatformMBean.
JBoss
Enter the following commands to enable JBoss to send JMX data. Change the host name and IP address to /etc/hosts to connect. The server name cannot be listed under 127.0.0.1.
Using a text editor of your choice, edit /opt/jboss/bin/run.sh. Add #Setup jmx remoting.
JAVA_OPTS="$JAVA_OPTS -Dcom.sun.management.jmxremote.authenticate=false"JAVA_OPTS="$JAVA_OPTS -Dcom.sun.management.jmxremote.ssl=false"JAVA_OPTS="$JAVA_OPTS -Dcom.sun.management.jmxremote.port=8007"Use the JBoss MBeanServerBuilder.
JAVA_OPTS="$JAVA_OPTS -Djboss.platform.mbeanserver"JAVA_OPTS="$JAVA_OPTS -Djavax.management.builder.initial=org.jboss.system.server.jmx.MBeanServerBuilderImpl"Use the jboss logmanager.
JAVA_OPTS="$JAVA_OPTS -Djava.util.logging.manager=org.jboss.logmanager.LogManager"JAVA_OPTS="$JAVA_OPTS -Dorg.jboss.logging.Logger.pluginClass=org.jboss.logging.logmanager.LoggerPluginImpl"JBOSS_CLASSPATH="../lib/jboss-logmanager.jar"GlassFish
First, increase the monitoring to HIGH on the Web Admin page. Then, enter the following commands to enable GlassFish version 3.1 to send JMX data.
In the domain configuration file /glassfish/domains/domain1/config/domain.xml find <java-config> and add the following.
-Dcom.sun.management.jmxremote.ssl=false-Dcom.sun.management.jmxremote.authenticate=falseFind <admin-service> and add/modify,
<jmx-connector accept-all="true" port="8007" address="0.0.0.0" security-enabled="false" name="system" auth-realm-name="admin-realm" />WebSphere 6.1
-
From the command line interface (CLI), enter the following commands.
-
Install the server.
$ yuminstallcompat-libstdc++-* libXp libXmu -
Run the server.
$/etc/init.d/webspherejmxserverNode01_was.init start
-
-
Log in via the admin console and make sure that the JMX RMI connection is established.
-
Use the Python script ListPorts to get the admin port.
$ ./wsadmin.sh -conntype none -lang jython -profileName AppSrv01 -f/opt/ListPorts.py -
Log on to the server.
admin:admin
-
-
Return to the CLI and disable security.
$ ./wsadmin.sh -conntype NONEwsadmin>securityoffwsadmin>$AdminConfig save -
Connect with the following script.
#!/bin/bashHOST=PORT=WAS_HOME=/home/dkozlowski/IBM/WebSphere/AppServerCLIENTSAS="-Dcom.ibm.CORBA.ConfigURL=file:`pwd`/sas.client.props"PROVIDER="-Djava.naming.provider.url=corbaname:iiop:$HOST:$PORT"PROPS=#PROPS="$PROPS $CLIENTSAS"#PROPS="$PROPS $PROVIDER"CLASSPATH=CLASSPATH="$CLASSPATH:$WAS_HOME/java/lib/tools.jar"CLASSPATH="$CLASSPATH:$WAS_HOME/runtimes/com.ibm.ws.admin.client_7.0.0.jar"CLASSPATH="$CLASSPATH:$WAS_HOME/runtimes/com.ibm.ws.ejb.thinclient_7.0.0.jar"CLASSPATH="$CLASSPATH:$WAS_HOME/runtimes/com.ibm.ws.orb_7.0.0.jar"CLASSPATH="$CLASSPATH:$WAS_HOME/java/lib/jconsole.jar"URL=service:jmx:iiop://$HOST:$PORT/jndi/JMXConnectorjava -classpath $CLASSPATH $PROPS sun.tools.jconsole.JConsole $URL
WebSphere 8.5
-
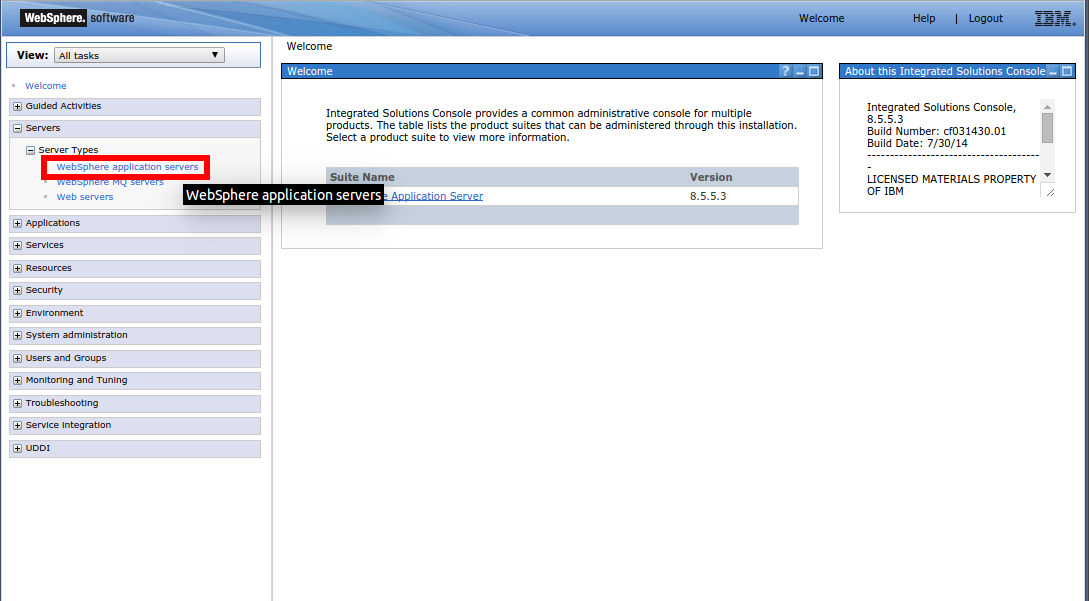
Log on to the WebSphere Admin Console.
-
On the left, click + next to Servers to expand the options.
-
Click + next to Server Types to display the Server Types options.
-
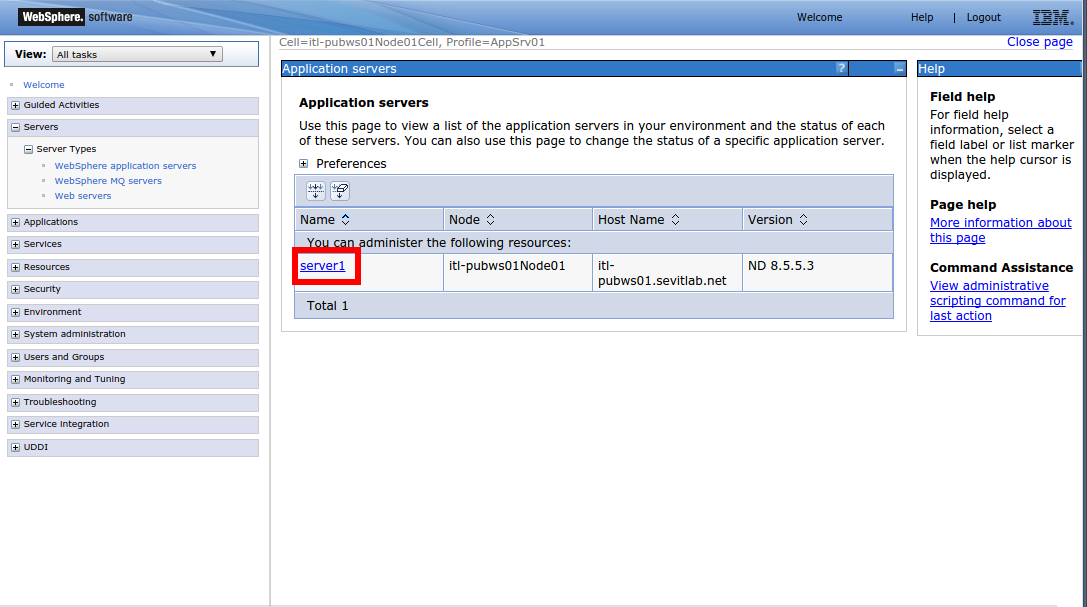
Click the WebSphere application servers link to display the application servers on the right.
-
Click on the server to administer.
-
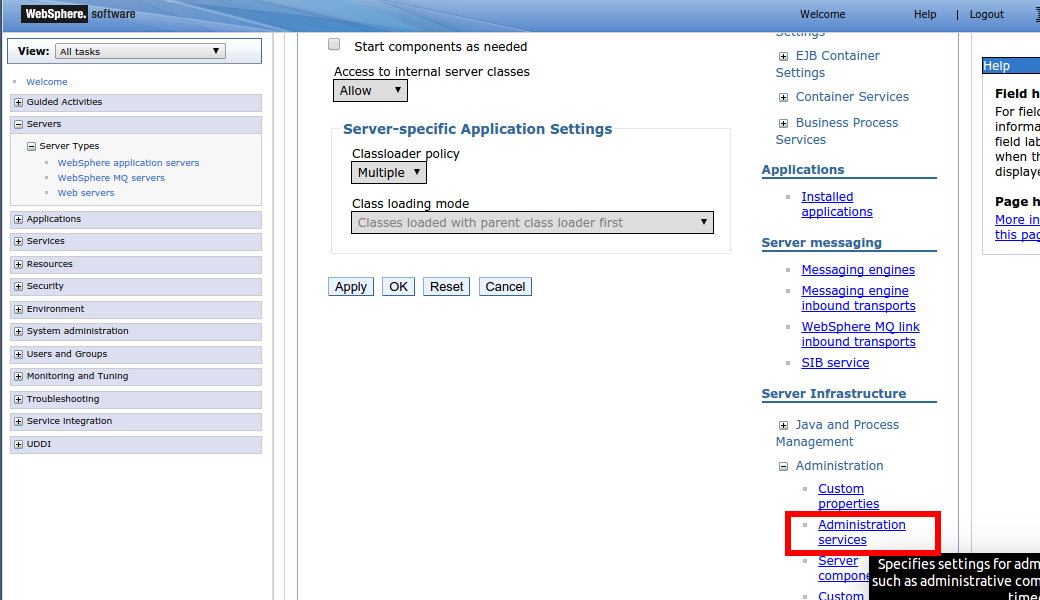
On the right side of the page, under Server Infrastructure, click Administration services to display the Administration Services options.
-
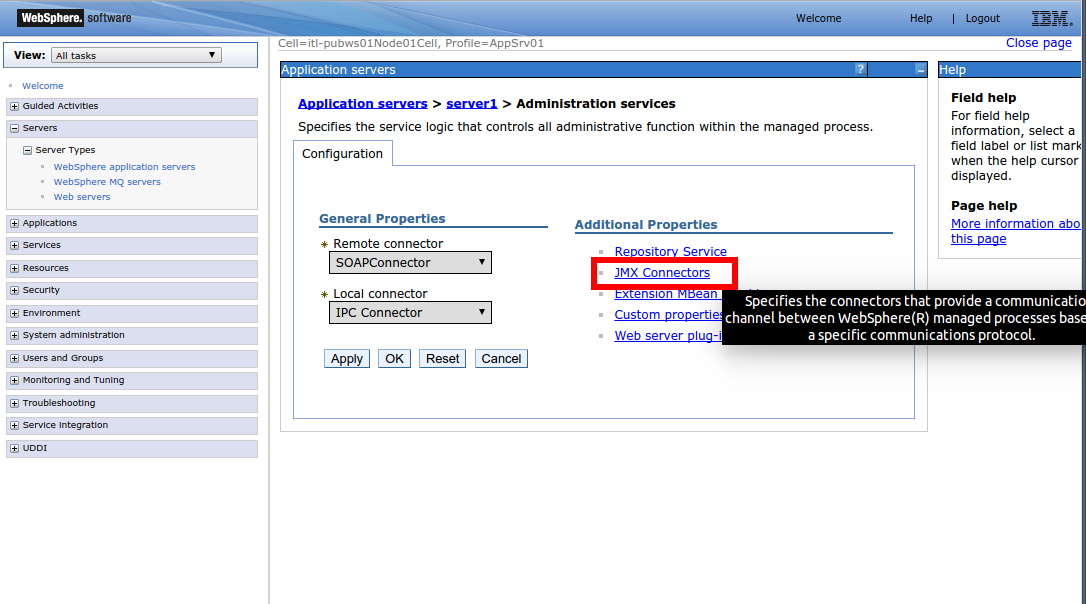
In the Additional Properties section, click JMX Connectors.
-
Select the SOAPConnector check box, if needed.
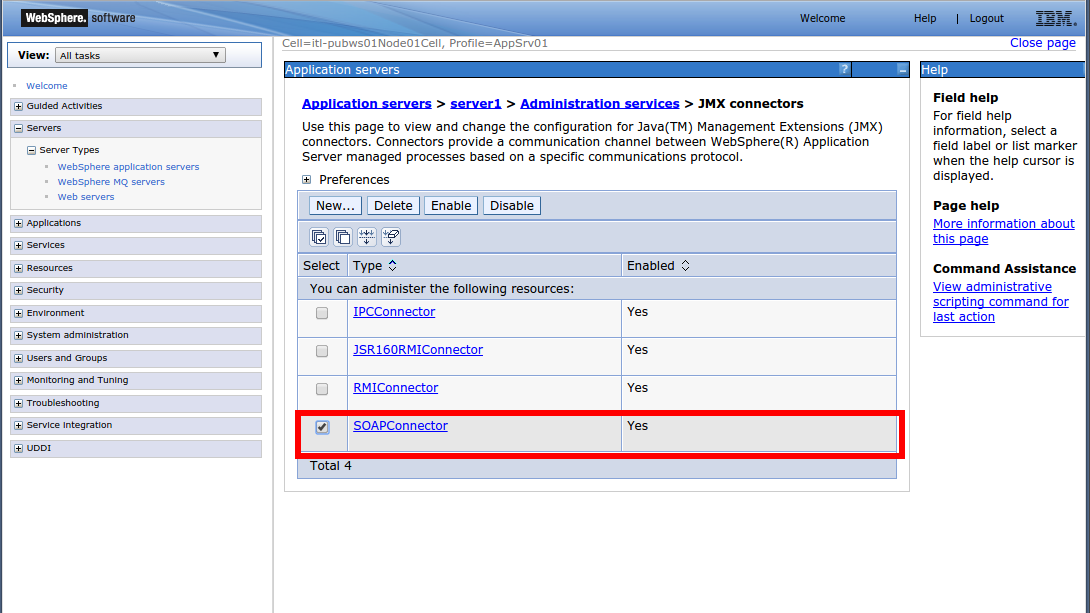
-
Return to the previous page.
-
In the General Properties section, click the Remote connector drop-down and select SOAPConnector.
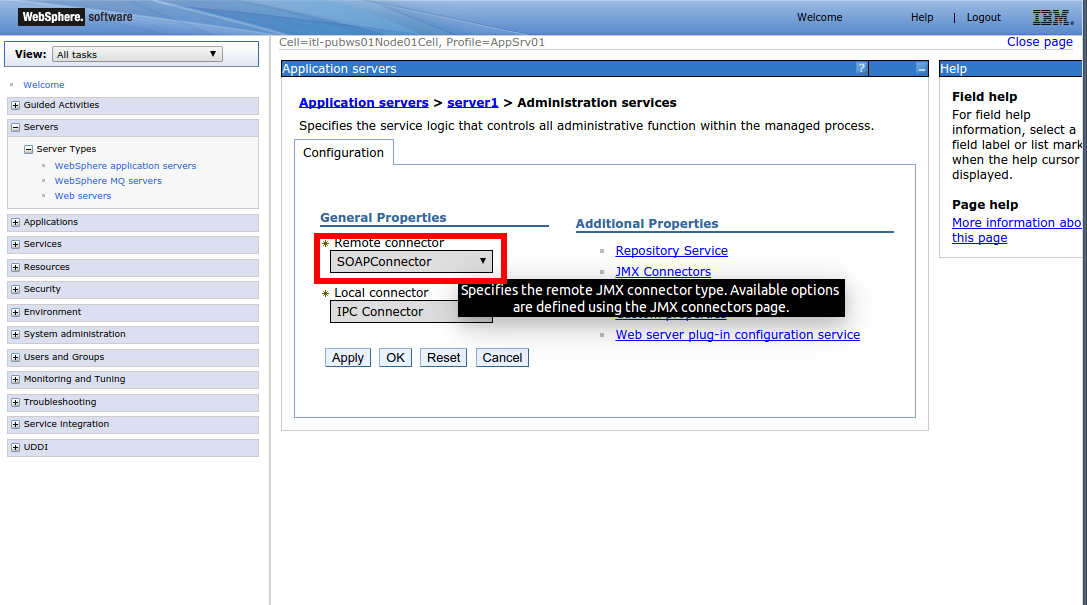
-
Click Apply.
-
Return to the Servers page to find the port for SevOne NMS to use to monitor the device.
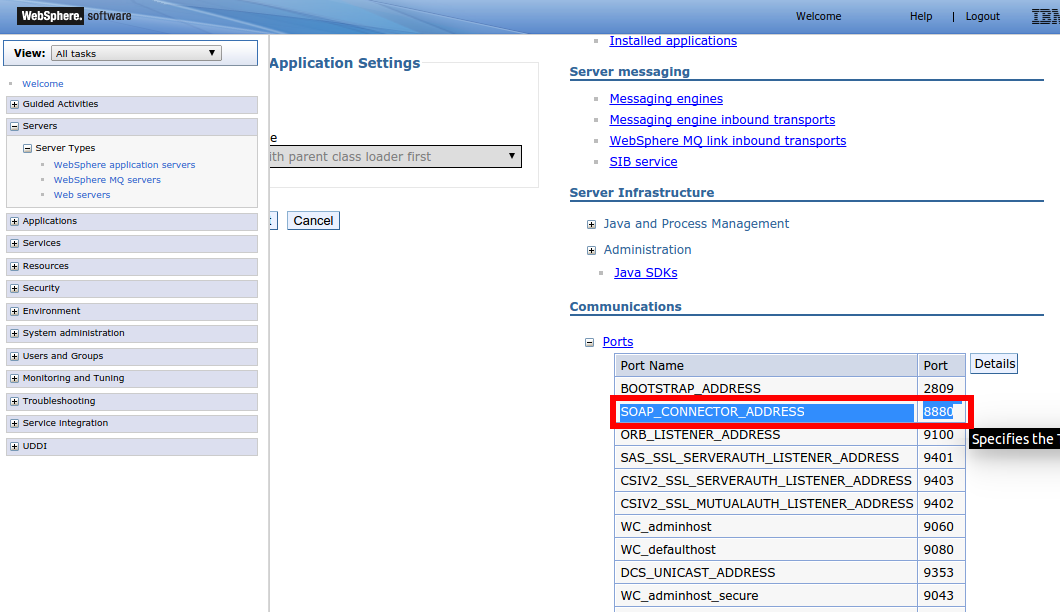
-
In the Communications section, click + next to Ports to expand the Ports list.
-
Make a note of the SOAP_CONNECTOR_ADDRESS port number. This port number is used for the device on the Edit Device page. For details please refer to section Enable JMX Plugin.
Configuration Steps
This section provides steps to configure the JMX plugin and manage JMX object types and indicator types.
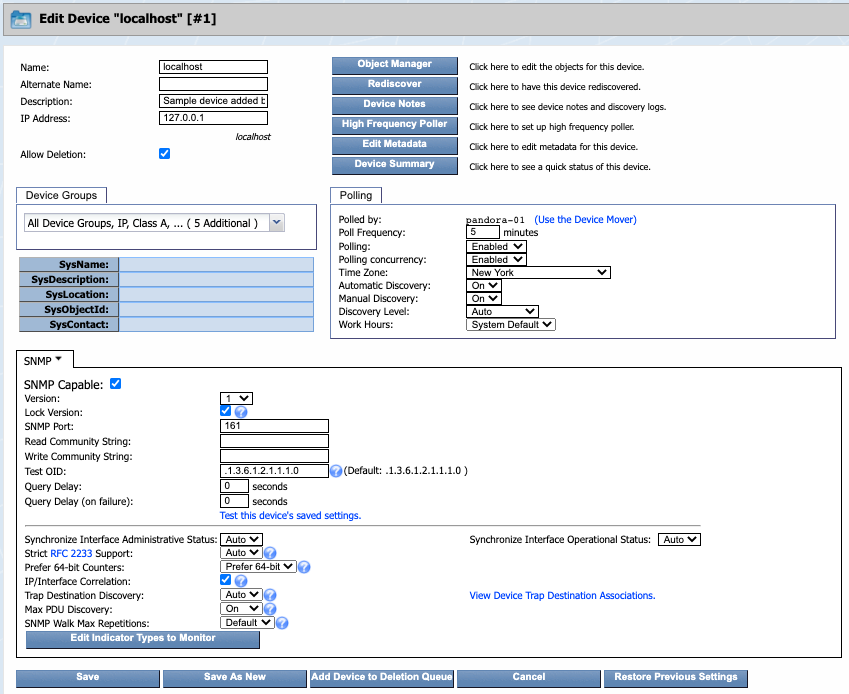
Enable JMX Plugin
The JMX plugin enables you to monitor Java Management Extensions (JMX) systems. It is disabled on new devices by default because it requires device-specific configuration.
Perform the following steps to enable the JMX plugin for devices.
-
From the navigation bar, click Devices and select Device Manager.
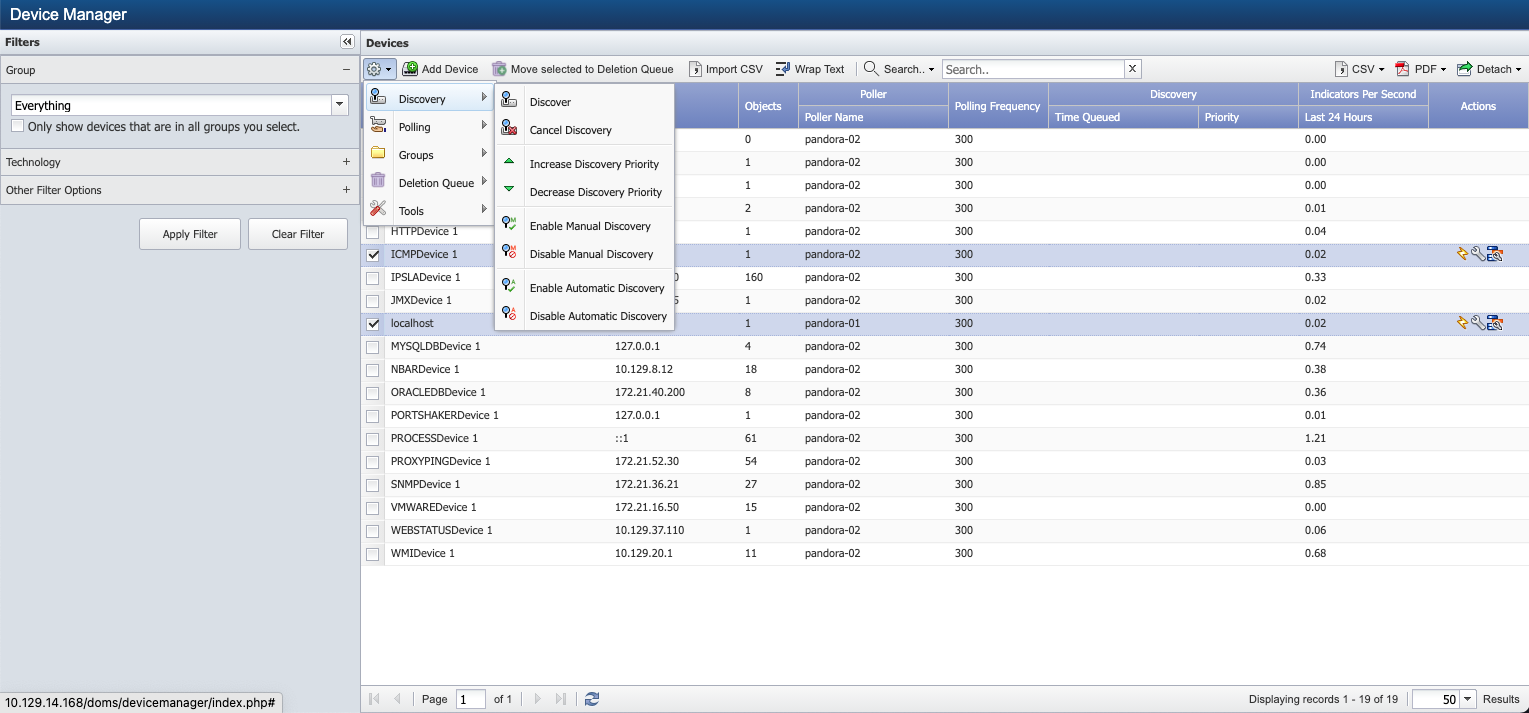
-
Perform one of the following actions.
-
To add a new device, click Add Device under Devices to display the New Device page. For information on adding new devices, please refer to SevOne NMS User Guide for details on these topics.
-
To edit an existing device, select the device and click
 to display the Edit Device page.
-
-
The plugin section appears in the lower half of the page. It is set to SNMP by default.
-
Next to SNMP, click the drop-down and select JMX.

-
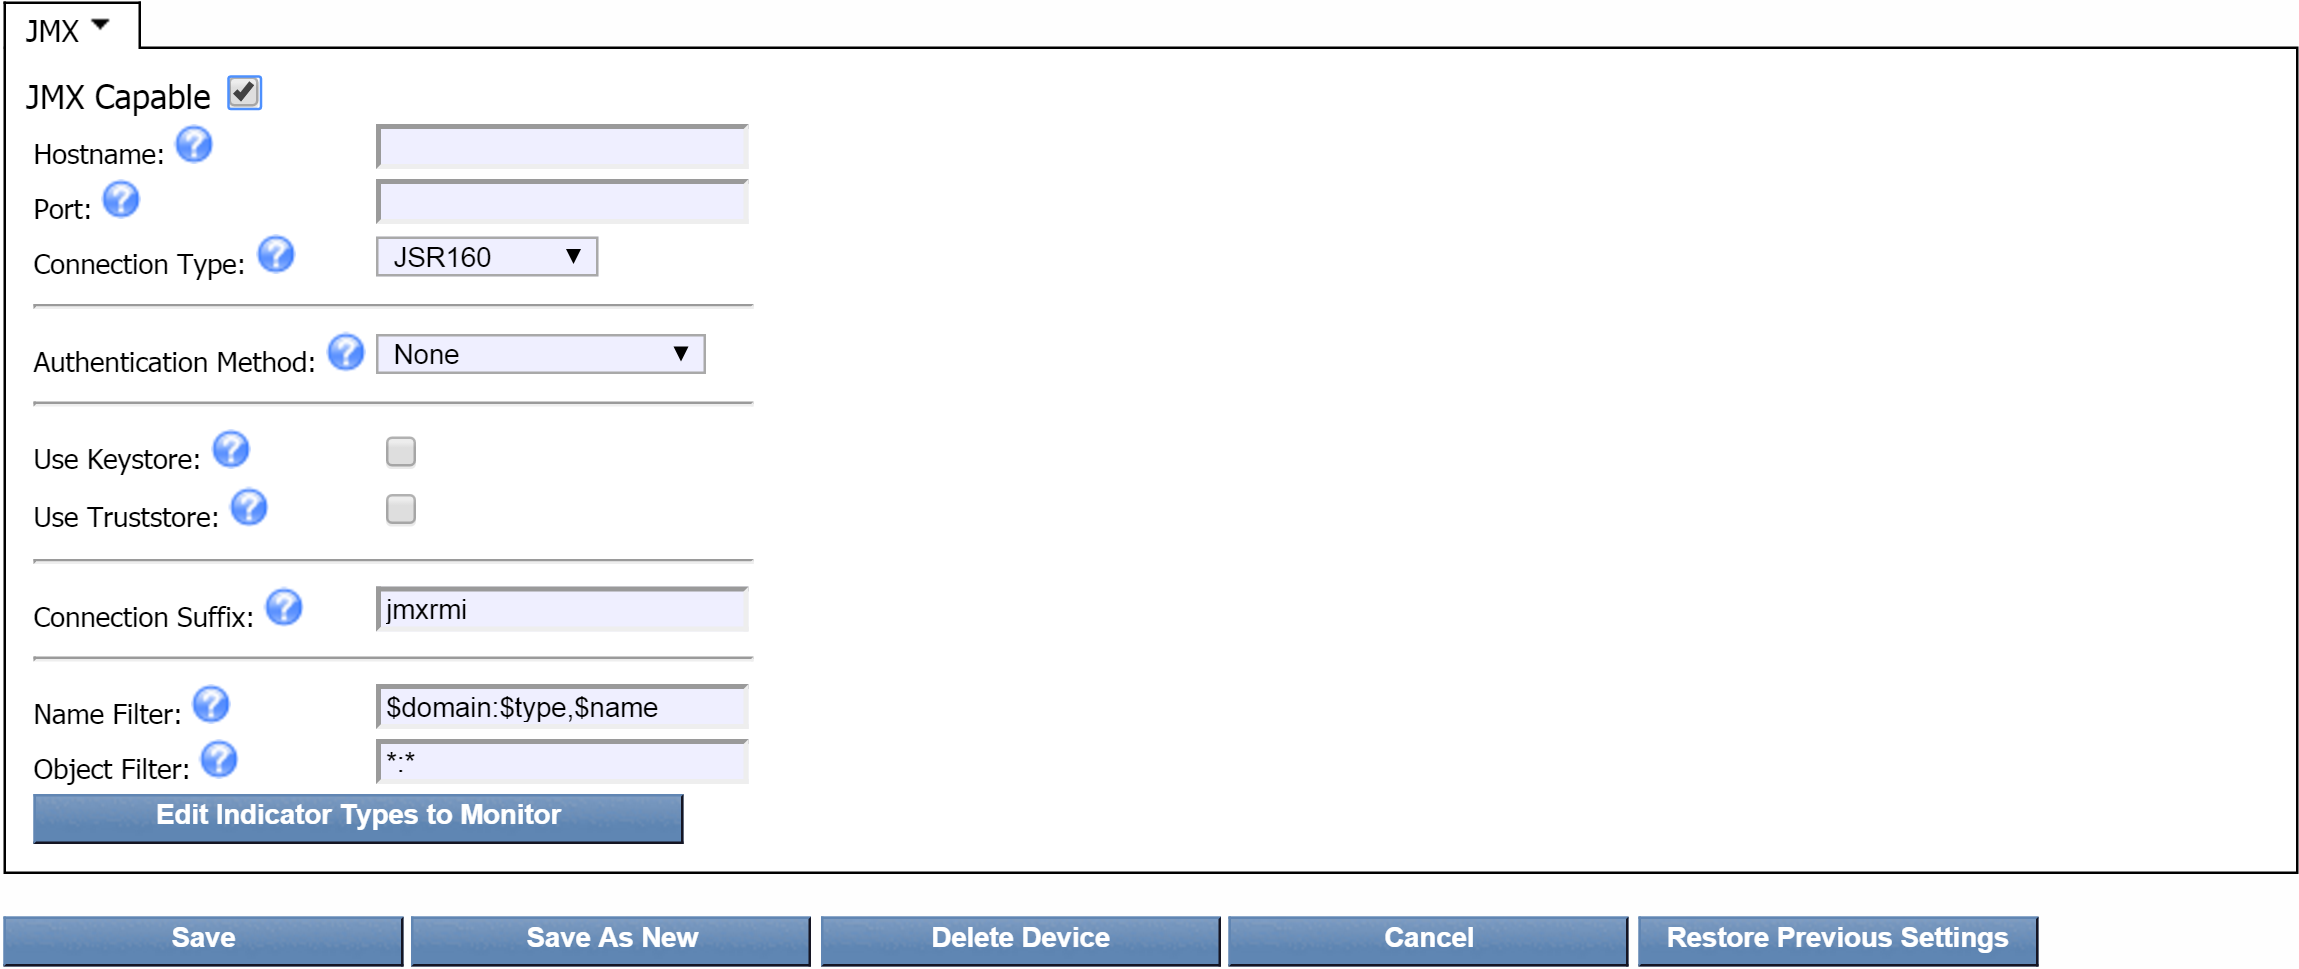
Select the JMX Capable check box.
-
In the Hostname field, enter the host name or IP address of the JMX server.
-
In the Port field, enter the port number on the JMX server that you want SevOne NMS to use.
-
Click the Connection Type drop-down and select one of the following options.
-
JSR160 - to connect to most JMX servers via JSR160.
-
AdminClient - to use the IBM AdminClient protocol.
-
-
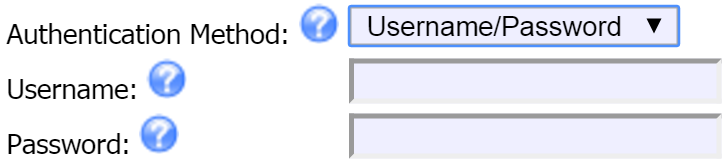
Click the Authentication Method drop-down and select one of the following options.
-
None - to not use any authentication method to access the device.
-
Username/Password - to have SevOne NMS use a user name and password to access the device. If you choose this option, two additional fields will appear where you can enter the credentials for authenticating onto the device.
-
-
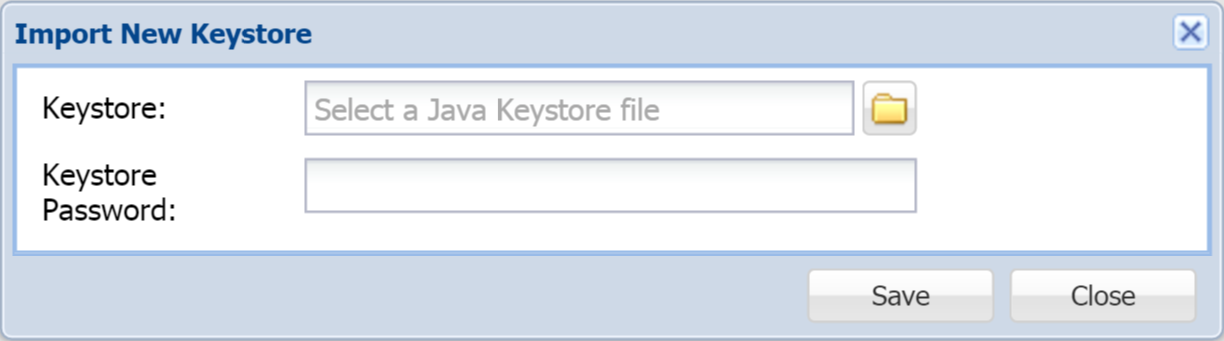
If you use WebSphere v8.5, select the Use Keystore check box and perform the following actions to select the Keystore and to enter the SSL credentials that enable you to use the JMX Keystore feature. Leave the check box clear if you do not use WebSphere v8.5.

-
Click Upload Keystore to display the Import New Keystore pop-up.
-
Click
 to navigate your file system and select the Keystore.
-
In the Keystore Password field, enter the password that SevOne NMS needs to authenticate onto the device.
-
Click Save.
-
-
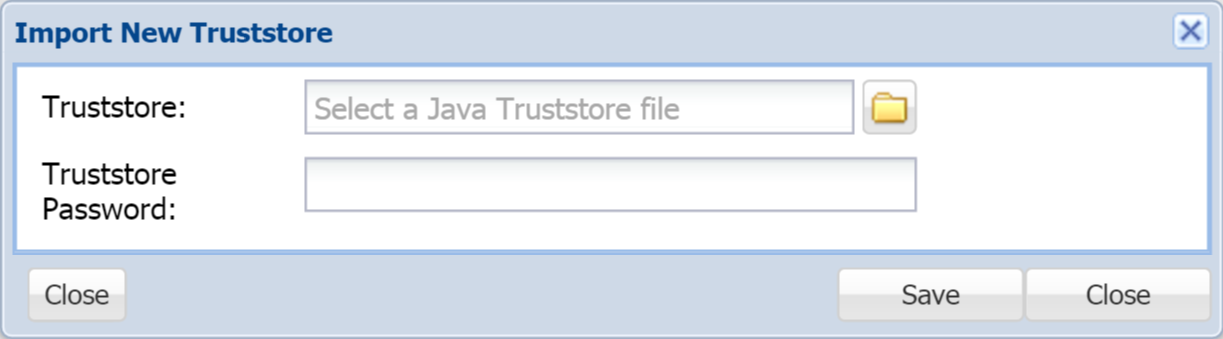
If you use WebSphere v8.5, select the Use Truststore check box and perform the following actions to select the Truststore and to enter the SSL credentials that enable you to use the JMX Truststore feature. Leave the check box clear if you do not use WebSphere v8.5.

-
Click Upload Truststore to display the Import New Truststore pop-up.
-
Click
to navigate your file system and select the Truststore.
-
In the Truststore Password field, enter the password SevOne NMS needs to authenticate onto the device.
-
Click Save.
-
-
In the Connection Suffix field, enter the JMX server suffix that SevOne NMS needs to gain access to the JMX server.
This is set to jmxrmi by default and should not be changed.
-
In the Name Filter field, enter the name of the filter to use to generate the names for the JMX objects.
-
In the Object Filter field, enter the filters to use to limit the discovery of JMX objects. To separate filters, use the ; character.
-
If you are on the New Device page, click Save As New to display the Edit Device page for this device. Otherwise, if you are editing an existing device, click Save.
-
Click Edit Indicator Types to Monitor to display the JMX Poller Indicator Type Mapping page, where you can enable or disable the JMX indicator types to poll. For more information on indicator type mapping, please refer to SevOne NMS User Guide > topic Indicator Type Maps.
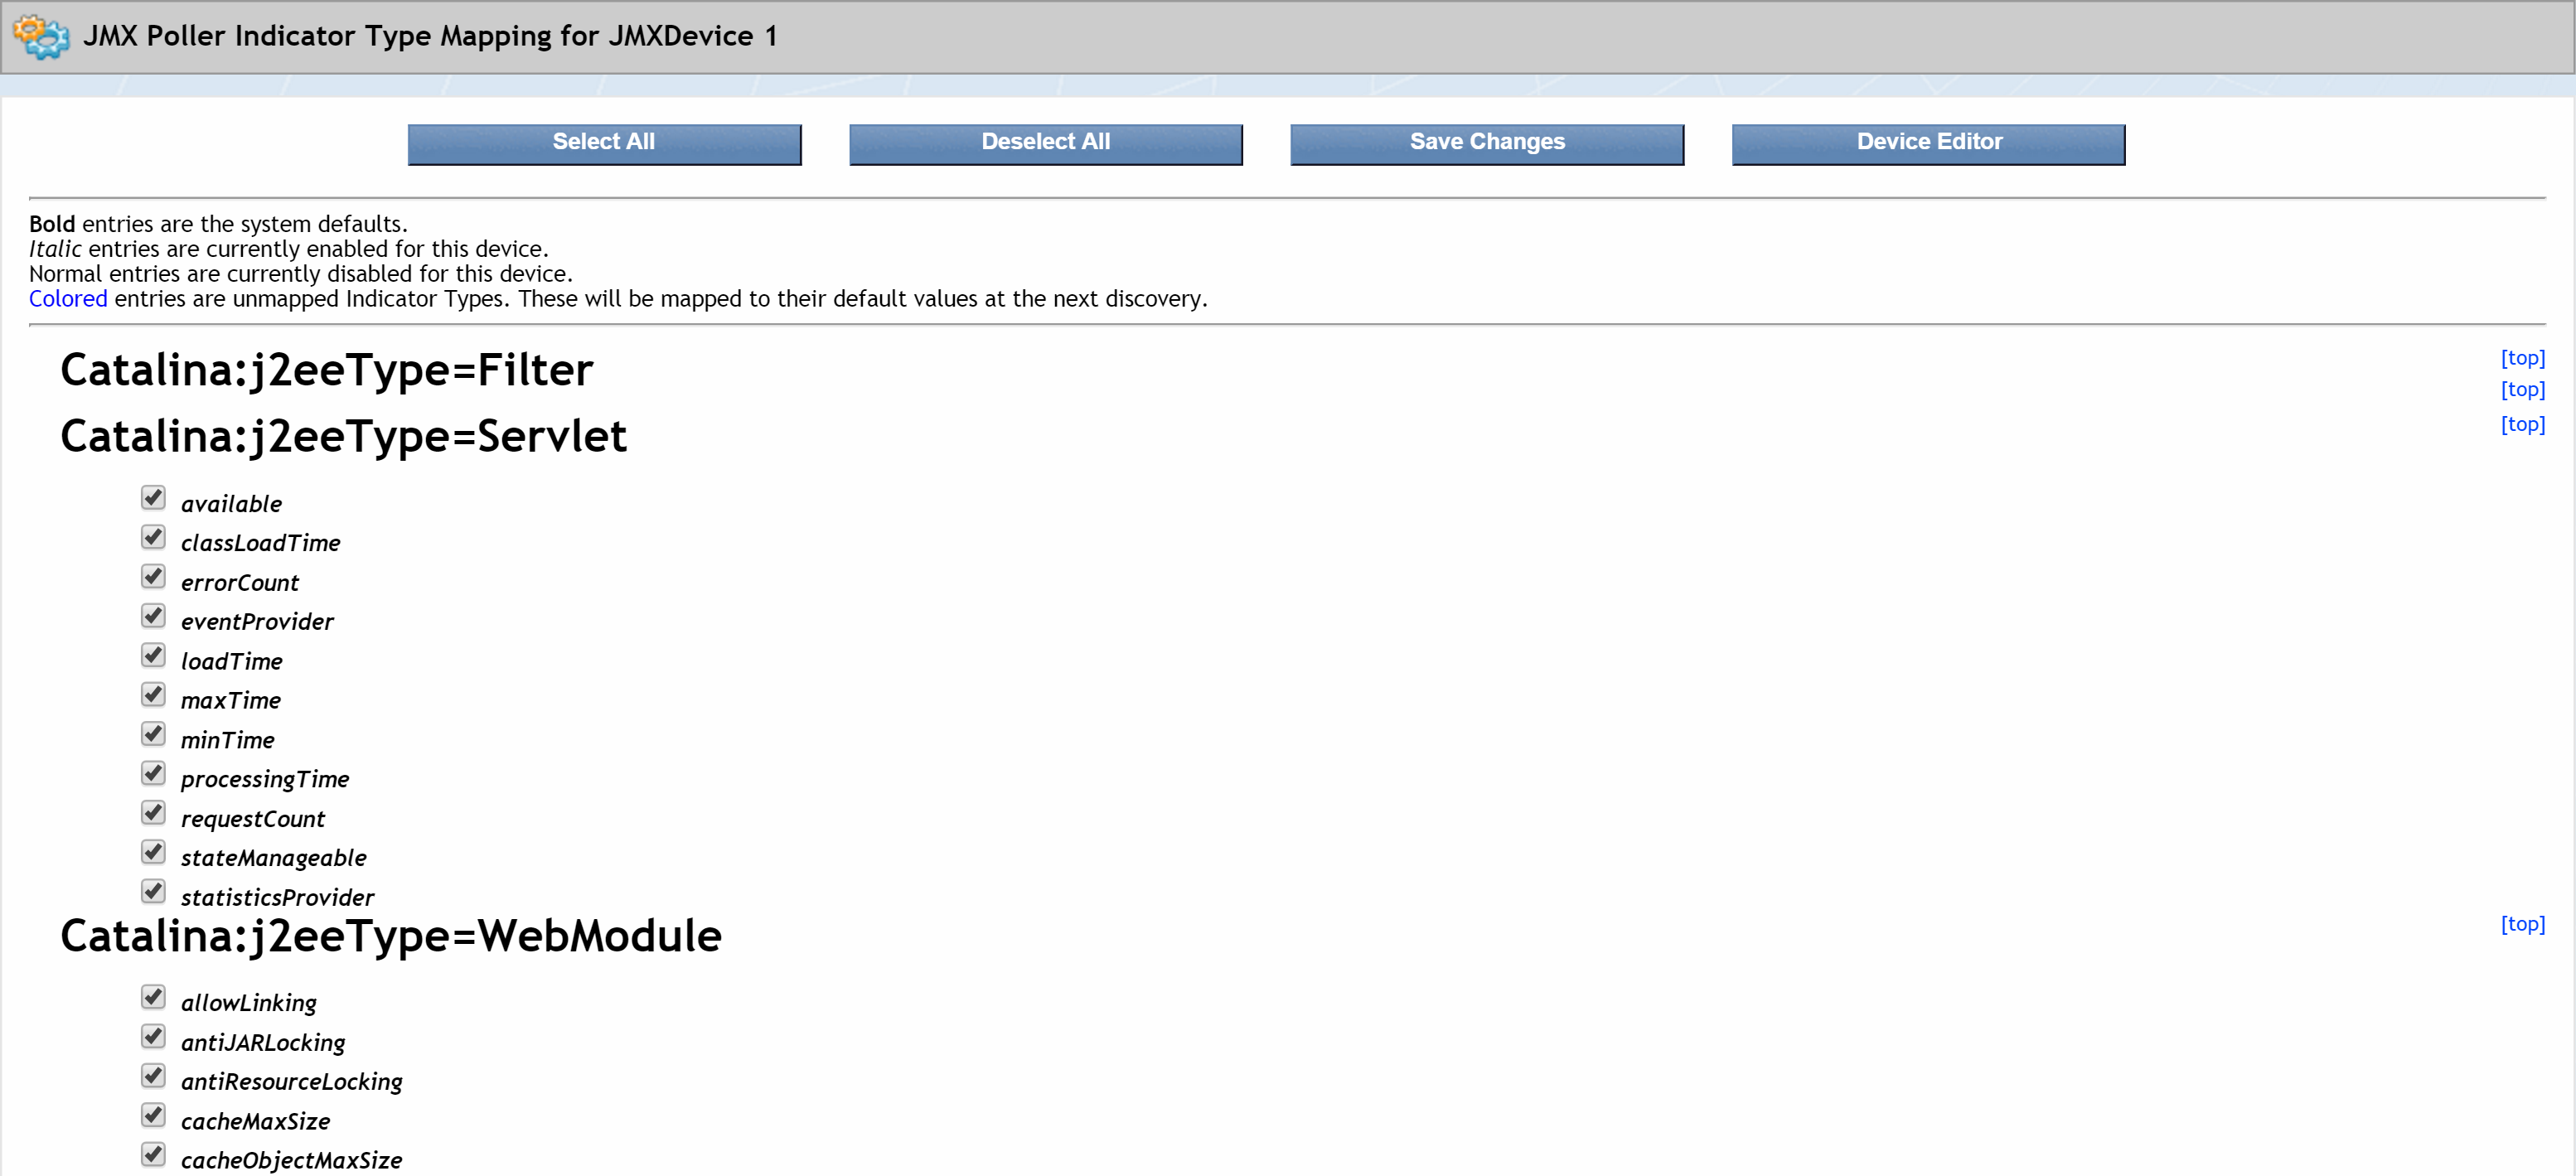
-
Click Save Changes to save any changes that you made. To return to the Edit Device page, click Device Editor.
JMX Object Types
Section Object Types, available in SevOne NMS System Administration Guide, provides details on how to manage JMX object types. Object types let you determine which objects are discovered on a device. The JMX plugin discovers the JMX object types on the devices that you enable to send JMX data to SevOne NMS. JMX object types are disabled by default. Please refer to SevOne NMS System Administration Guide > section Object Rules where you can define the rules to disable polling of objects, and the Object Manager lets you manage the objects on each device. For details on Object Manager, please refer to SevOne NMS User Guide.
Best Practices
The following are best practices when managing JMX object types.
-
For any JMX object types that you want to enable, make sure that they are enabled before discovering the applicable device. Otherwise, you will need to rediscover the device.
-
Only enable the object types that you want for the applicable device; do not enable all object types. Enabling all object types can slow down discovery.
Manage
Perform the following steps to add and edit JMX object types.
-
From the navigation bar, click Administration and select Monitoring Configuration, then Object Types.
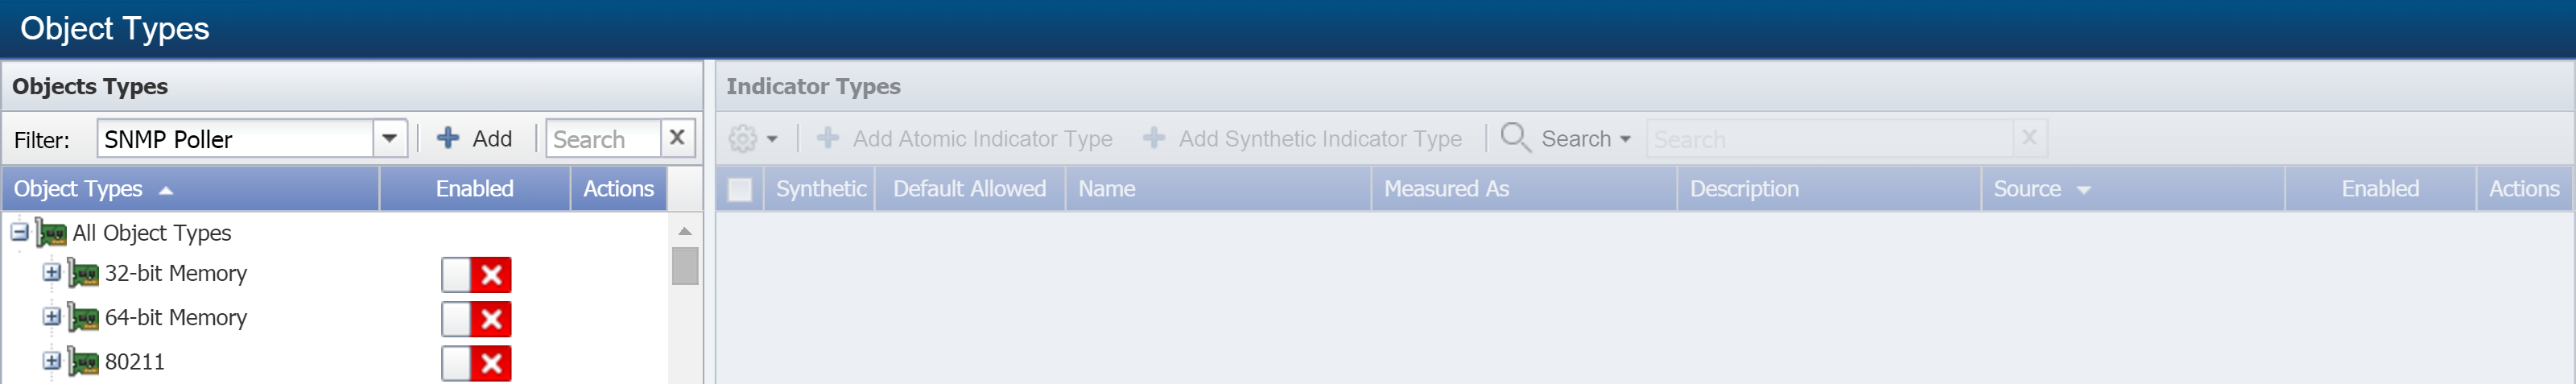
-
Click the Filter drop-down and select JMX Poller. In the Object Types hierarchy on the left, you will see the object types that the JMX plugin can poll.
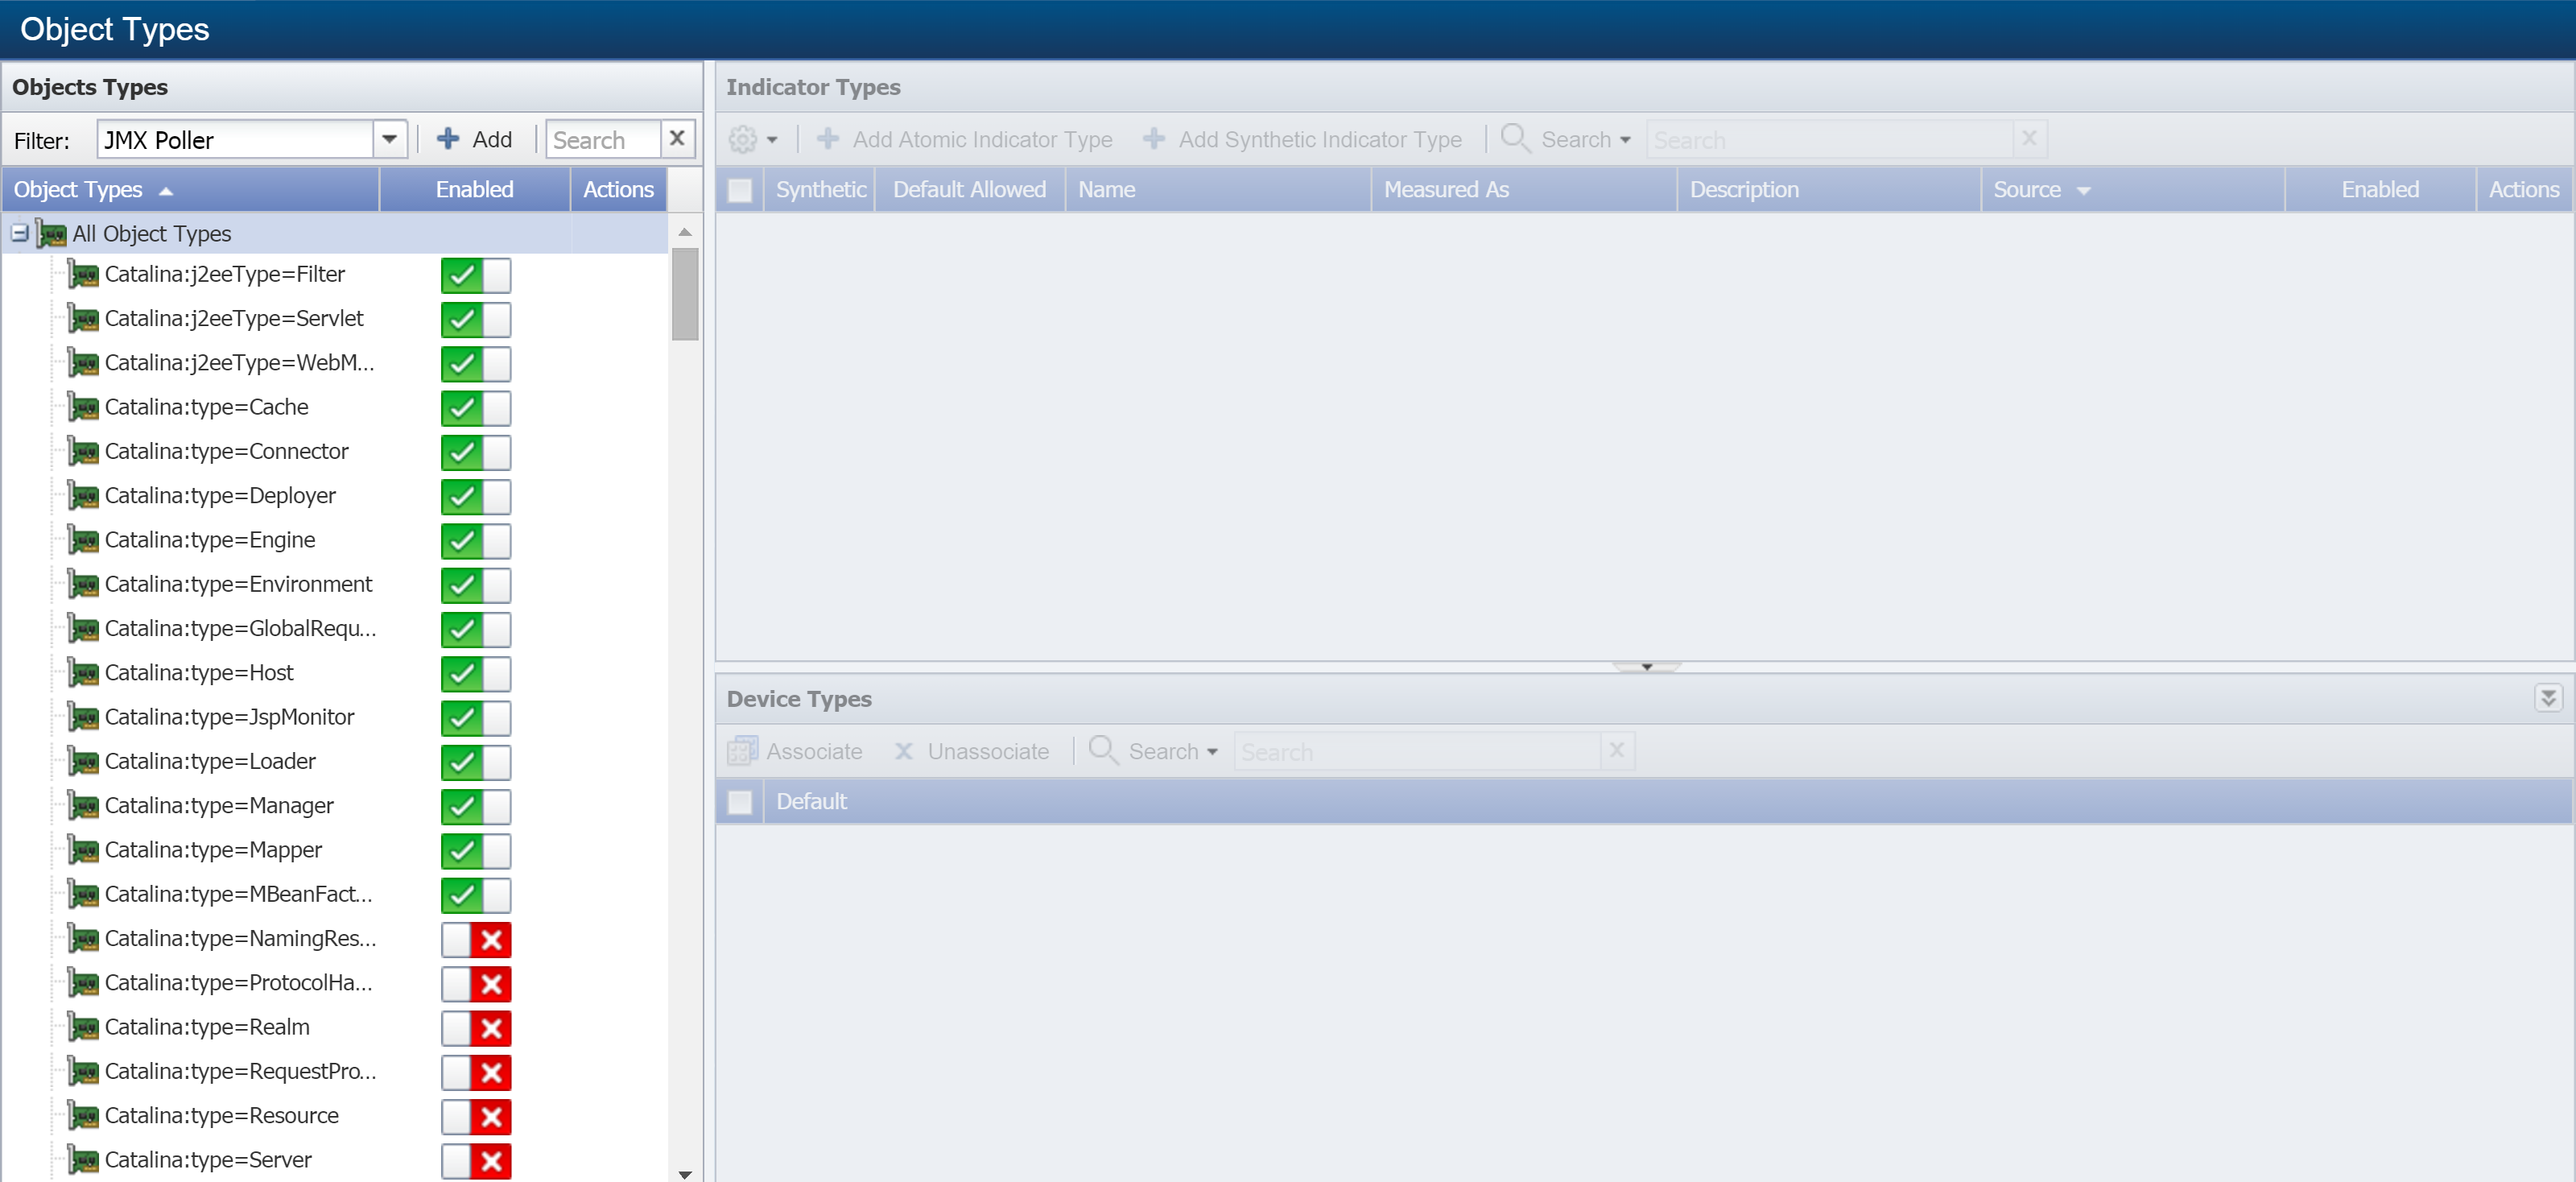
-
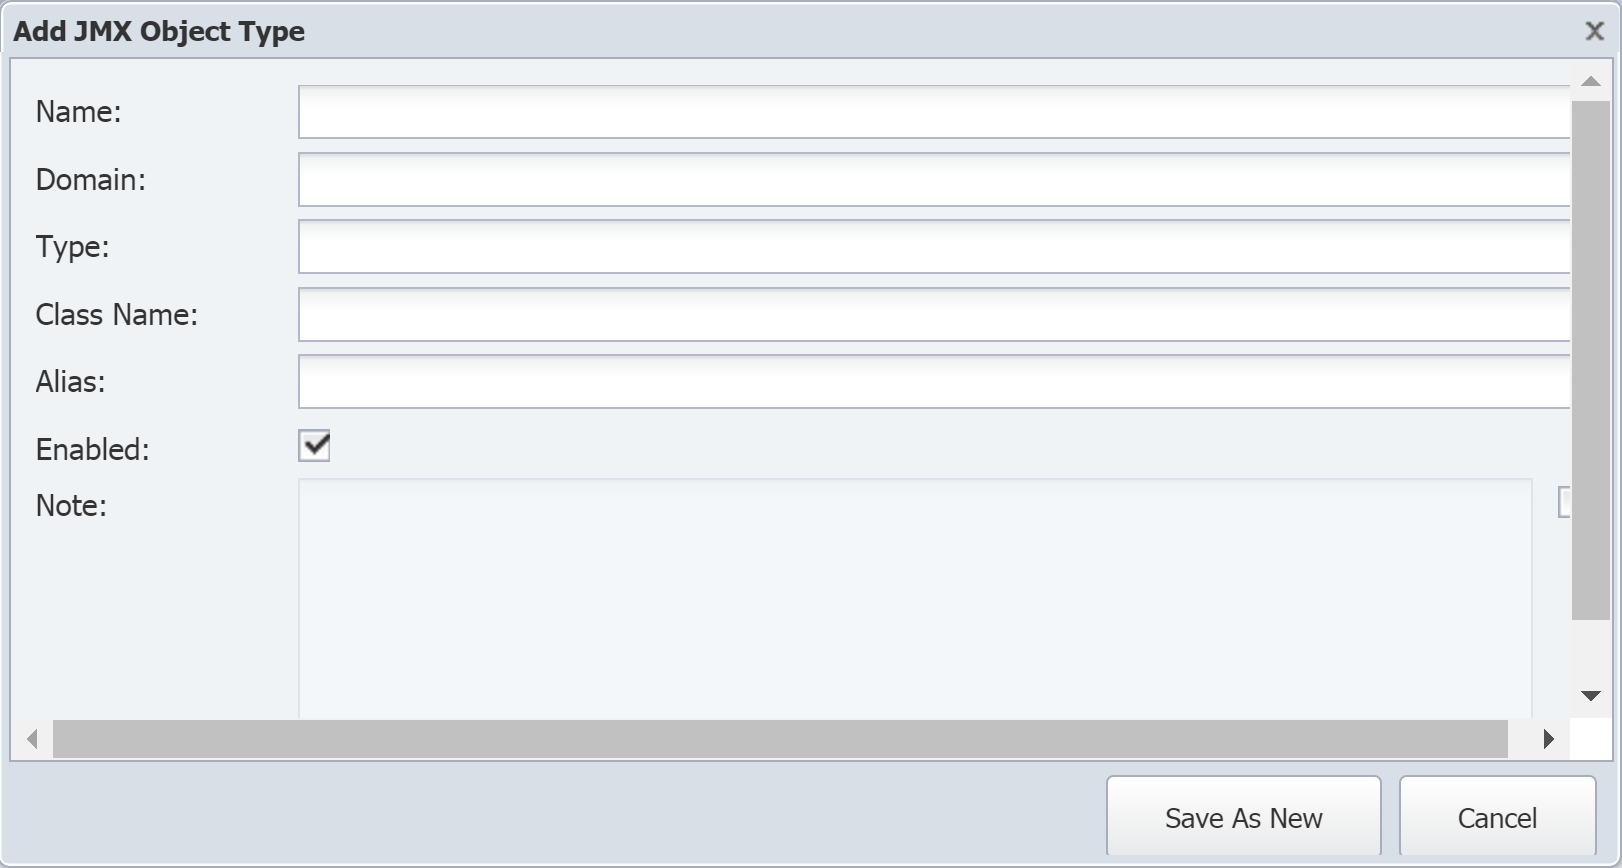
Click Add to display the Add JMX Object Type pop-up. To edit an existing object type, select the object type and click
under Actions.
-
In the Name field, enter the object type name.
-
In the Domain field, enter the object type domain.
-
In the Type field, enter the type of the object type.
-
In the Class Name field, enter the class name of the object type.
-
In the Alias field, enter the alias of the object type.
-
Select the Enabled check box to enable the JMX plugin to poll the indicator types of the object type.
-
Select the check box for the Note field to enable it for editing. Enter any additional information you would like to include.
-
Click Save As New.
JMX Indicator Types
Indicator types define the kind of metrics an object can have. This section provides the details on how to add / edit indicator types. Every indicator of an object needs an indicator type. SevOne NMS plugins such as, SNMP, JMX, etc., use indicator types to collect data from indicators on the objects that you monitor.
There are two categories of indicator types.
-
Atomic - are measured directly by plugins.
-
Synthetic - calculate values based on the values resulting from other indicator types.
Manage JMX Atomic Indicator Types
Perform the following steps on the Object Types page to add and edit JMX atomic indicator types.
-
In the Object Types hierarchy on the left, select the object type that you would like to create an indicator type for.
-
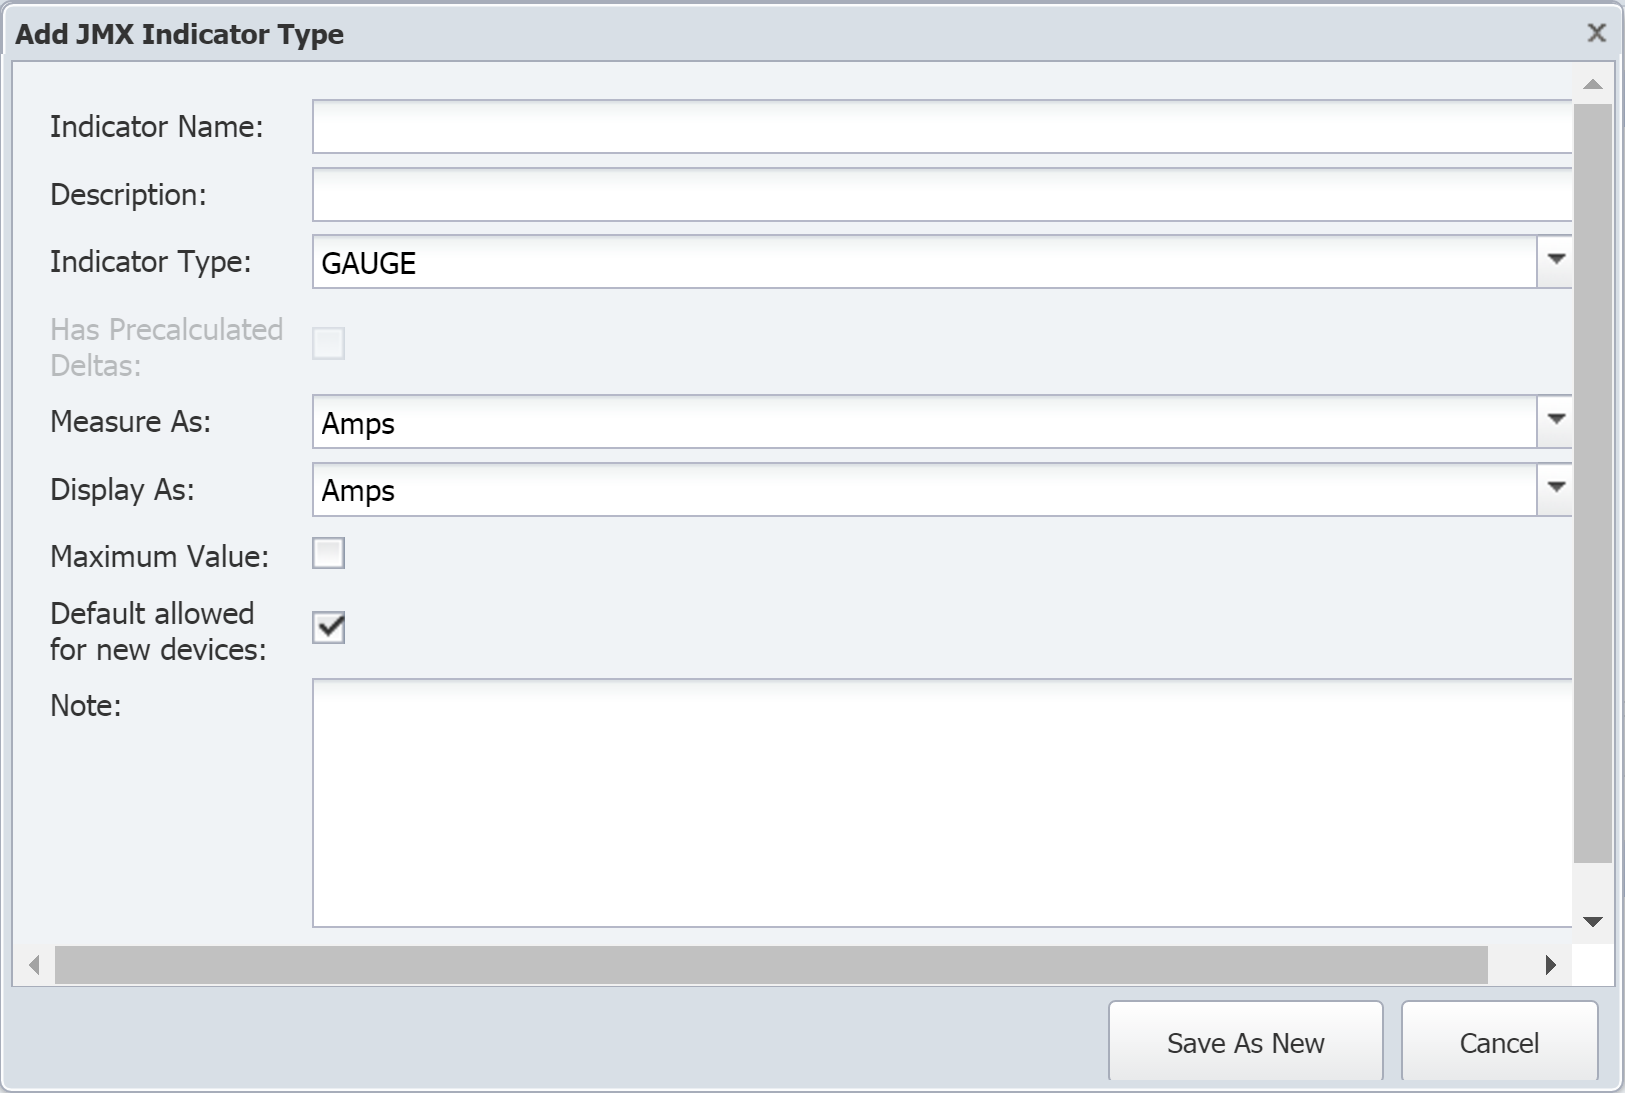
On the right side of the page, under Indicator Types, click Add Atomic Indicator Type to display the Add JMX Indicator Type pop-up. To edit an existing indicator type, select the indicator type and click
under Actions.
-
In the Indicator Name field, enter the name of the indicator type.
-
In the Description field, enter the name to display.
-
Click the Indicator Type drop-down and select one of the following options:
-
GAUGE - for indicators that have specific values when polled.
-
COUNTER32 - for 32-bit indicators that continue to increment. If you select this option, you can select the Has Precalculated Deltas check box to total the delta/differences between polls. This provides the ability to graph things like the number of errors in a day, for example.
-
COUNTER64 - for 64-bit indicators that continue to increment. If you select this option, you can select the Has Precalculated Deltas check box.
-
-
Click the Measure As drop-down and select a data unit to measure in.
-
Click the Display As drop-down and select a display unit.
-
Select the Maximum Value check box to indicate that the indicator type has a maximum value.
-
Select the Default allowed for new devices check box to have the plugin poll this indicator type by default when the object type is enabled and when the plugin for a device is enabled.
-
In the Note field, enter any additional information you would like to include.
-
Click Save As New.
Manage JMX Synthetic Indicator Types
Using synthetic indicator types, you can create your own key performance indicators (KPIs) even when those KPIs such as, Percent Usage, Percent Loss, Percent Error, and Percent Idle, do not exist for a device. For example, let's say that you want to monitor voice gateways to find out which primary rate interface (PRI) is getting the most usage. Typical poll metrics can tell you the busy status of individual bearer channels, or B channels, but they cannot tell you the sum of the statuses for all the B channels. This makes it difficult to find out the total usage of a particular PRI.
In SevOne NMS, you can create a single indicator type that tells you what percentage of a PRI is being used.
You will need the following:
-
An existing indicator type that tells you how many busy B channels there are for a given PRI. Let's call this BChannelsBusy.
-
The total number of B channels for our PRI. i.e., number 23.
Using this information, a synthetic indicator type can be created with an expression to perform the following calculation.
(BChannelsBusy*23)/100The new synthetic indicator type will tell the user what percentage of the PRI is being used. There is no need to look up the number of busy B channels and perform calculations manually.
Since synthetic indicator types are based on existing indicator types, either synthetic or atomic, there must already be at least one existing indicator type in order for you to create a new synthetic indicator type.
Perform the following steps on the Object Types page to add and edit JMX synthetic indicator types.
-
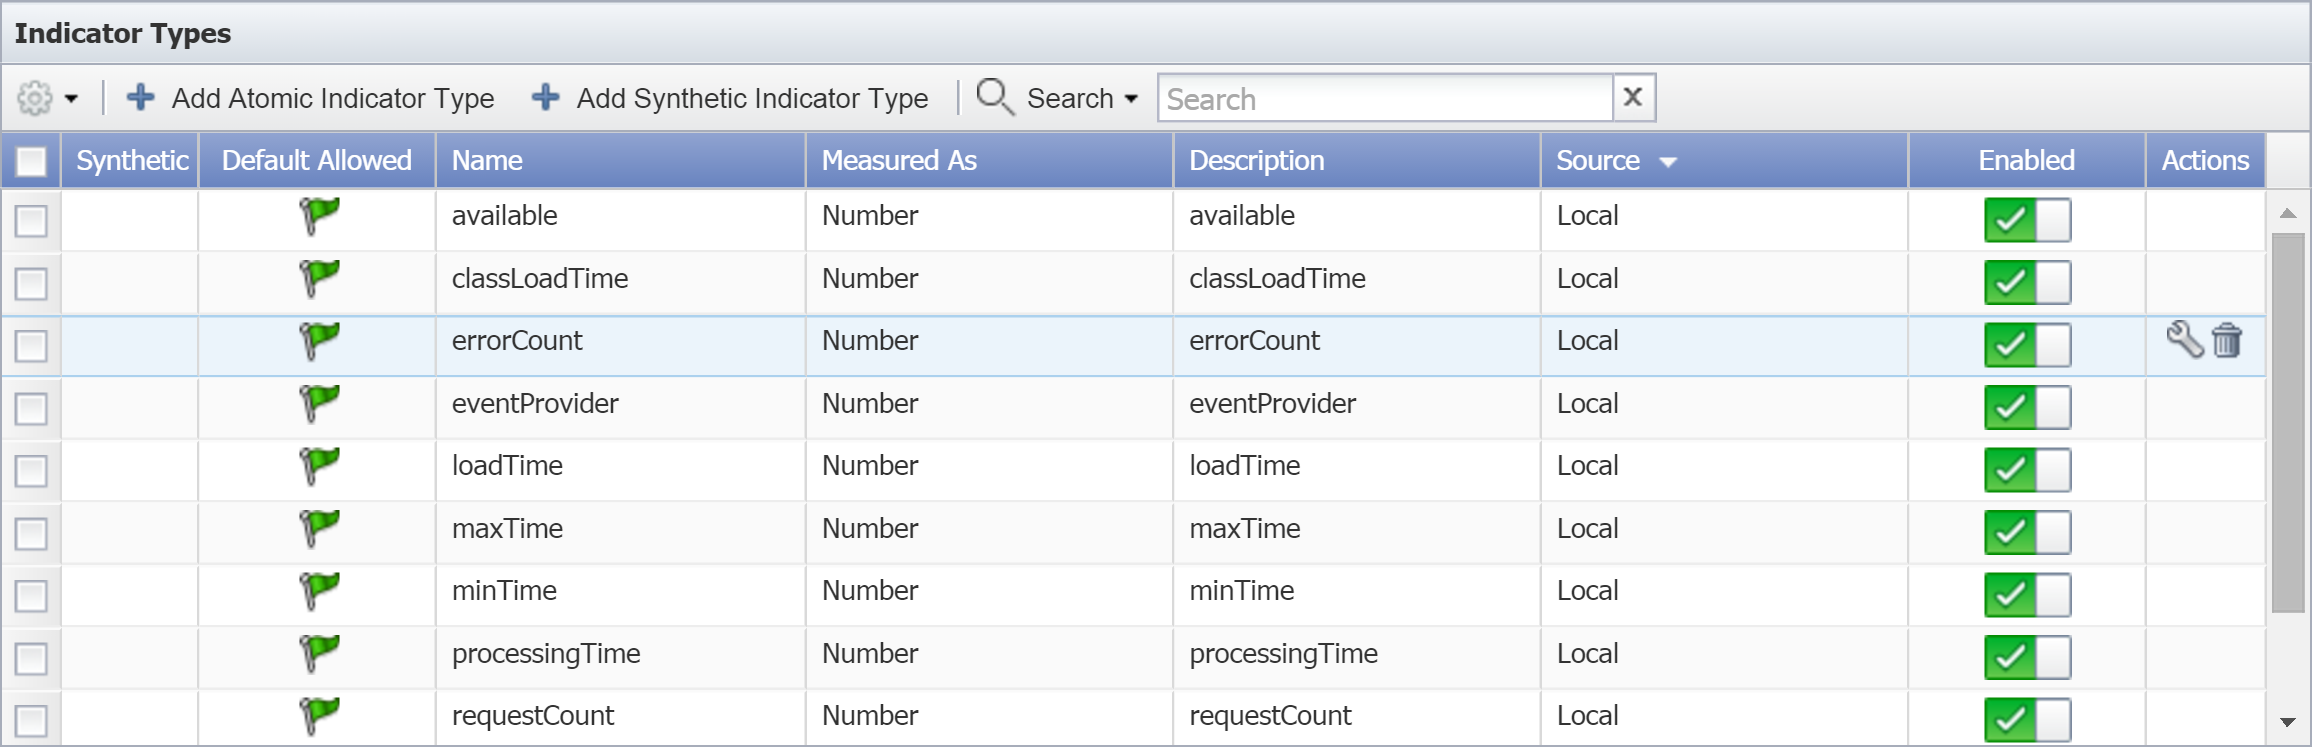
In the Object Types hierarchy on the left, click on an object type to display its indicator types on the right. If the object type does not have any indicator types, the Add Synthetic Indicator Type button will not appear.
-
Click Add Synthetic Indicator Type to display the Add Synthetic Indicator Type pop-up. To edit an existing synthetic indicator type, select the indicator type and click
under Actions.
-
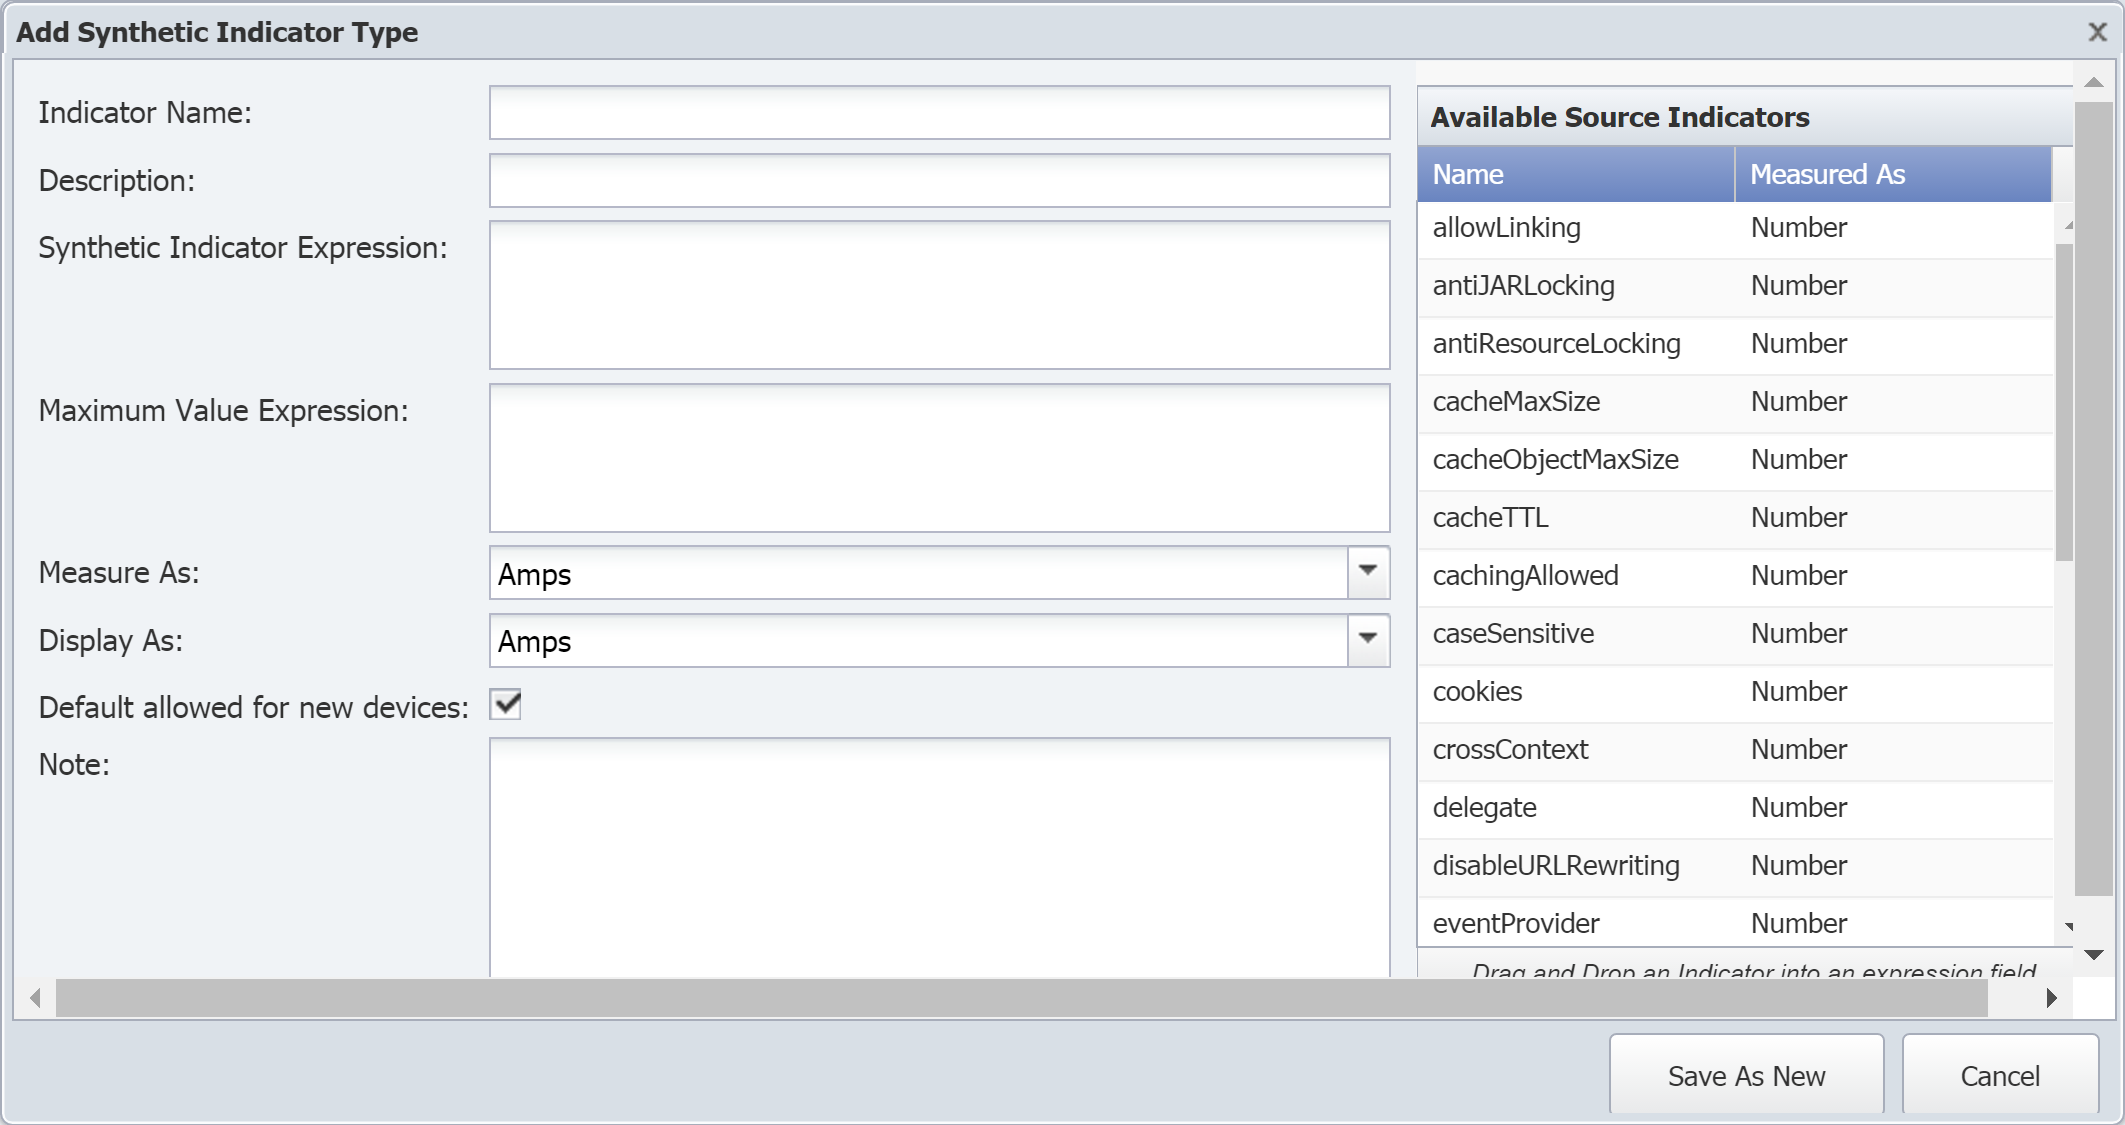
In the Indicator Name field, enter the name of the synthetic indicator type.
-
In the Description field, enter the name to display.
You will see the indicator description displayed in reports and elsewhere in the user interface. Keep this in mind when creating the indicator type description. For example, when you look at an object's indicators, you will notice that they are listed based on the first word of their description. If you have the two indicators Received Bytes and Sent Bytes, they may not appear together. However, if you use the descriptions Bytes Received and Bytes Sent, the indicators will appear in close proximity to each other.
-
The Synthetic Indicator Expression field is where you define the calculation. Perform the following actions to create the expression for this field.
A red border around the Synthetic Indicator Expression field indicates that your calculation is invalid. This also means that your graph results will be incorrect.
-
In the Available Source Indicators field on the right, select an indicator type to use in the expression. Drag and drop it into the Synthetic Indicator Expression field.
The Available Source Indicators field contains the indicator types for the object type that you selected a few steps ago.
-
Enter the applicable operators to formulate your calculation in the Synthetic Indicator Expression field. For a list of available operators, please refer to section Acceptable Operators.
-
Drag any additional indicator types from the Available Source Indicators field and enter additional mathematical symbols to complete the expression in the Synthetic Indicator Expression field.
-
-
The Maximum Value Expression field allows you define the maximum value calculation for the indicator type. Perform the following actions to create the expression for this field.
-
In the Available Source Indicators field on the right, select an indicator type to use in the expression. Drag and drop it into the Maximum Value Expression field.
-
Enter the applicable operators to formulate your calculation in the Maximum Value Expression field. For a list of available operators, please refer to section Acceptable Operators.
-
Drag any additional indicator types from the Available Source Indicators field and enter additional mathematical symbols to complete the expression in the Maximum Value Expression field.
-
-
Click the Measure As drop-down and select a data unit.
-
Click the Display As drop-down and select a display unit.
-
Select the Default allowed for new devices check box to have the plugin poll this indicator type by default when the object type is enabled and when the plugin for a device is enabled.
-
In the Note field, enter any additional information you would like to include.
-
Click Save As New.
Acceptable Operators
The following operators / characters are acceptable in the expression formula.
-
+ add
-
- subtract
-
* multiply
-
/ divide
-
&& logical AND
-
|| logical OR
-
<= less than or equal to
-
>= greater than or equal to
-
! not equal to
-
== equal to
-
> greater than
-
< less than
-
^ raise x to the power of y
-
% modulus
-
?: if...then...else
-
isnan is Not a Number. This evaluates to 1 if the value is not a number. Otherwise, it evaluates to 0.
-
isValid is valid. This evaluates to 1 if the value has been discovered and is not isnan. Otherwise, it evaluates to 0.
-
useIfValid use if valid. This evaluates to the value if it has been discovered and is not isnan. It evaluates to the second argument otherwise.
If your calculation results in either of the following invalid values, there will be a gap in your graph.
-
Not a Number (NAN)
-
Infinity (+/-INF).
The following describes how SevOne NMS attempts to prevent invalid values. These are listed in the order they are processed.
-
Zero divided by zero results in NAN.
-
Any positive value divided by zero results in +INF.
-
Any negative value divided by zero results in -INF.
-
Zero multiplied by +/-INF results in NAN.
-
Any value added to, subtracted from, multiplied by, divided by, or divided from NAN results in NAN.
-
Any value compared to NAN (<, <=, ==, >=, >) results in 0. NAN != NAN.
-
Any value compared to +INF is less than +INF, except that +INF == +INF
-
Any value compared to -INF is greater than -INF, except that -INF == -INF
-
Any value added to or subtracted from +INF results in +INF
-
Any positive value multiplied by +/-INF results in +/-INF
-
Any value divided by +/-INF results in 0
Troubleshooting
If you are unable to receive JMX data, please make sure you have entered the correct IP address / hostname for your JMX server. If you are using authentication, please check to ensure that you have entered the correct user name and password.
Terms
|
Java |
A high-level, object-oriented programming language. Java is platform-independent. |
|
JavaBean |
A reusable software component written in Java. |
|
Managed Bean (MBean) |
A JavaBean that represents a manageable resource. |