Table of Contents (Start)
- Topics
- Introducing SevOne
- Login
- Startup Wizard
- Dashboard
- Global Search - Advanced Search
- Report Manager
- Report Attachment Wizard
- Report Properties
- Report Interactions
- Instant Graphs
- TopN Reports
- Alerts
- Alert Archives
- Alert Summary
- Instant Status
- Status Map Manager
- Edit Maps
- View Maps
- FlowFalcon Reports
- NBAR Reports
- Logged Traps
- Unknown Traps
- Trap Event Editor
- Trap Destinations
- Trap Destination Associations
- Policy Browser
- Create and Edit Policies
- Webhook Definition Manager
- Threshold Browser
- Create and Edit Thresholds
- Probe Manager
- Discovery Manager
- Device Manager
- New Device
- Edit Device
- Object Manager
- High Frequency Poller
- Device Summary
- Device Mover
- Device Groups
- Object Groups
- Object Summary
- Object Rules
- VMware Browser
- AWS Plugin
- Azure Plugin (Public Preview)
- Calculation Plugin
- Database Manager
- Deferred Data Plugin
- DNS Plugin
- HTTP Plugin
- ICMP Plugin
- IP SLA Plugin
- JMX Plugin
- NAM
- NBAR Plugin
- Portshaker Plugin
- Process Plugin
- Proxy Ping Plugin
- SDWAN Plugin
- SNMP Plugin
- VMware Plugin
- Web Status Plugin
- WMI Plugin
- xStats Plugin
- Indicator Type Maps
- Device Types
- Object Types
- Object Subtype Manager
- Calculation Editor
- xStats Source Manager
- User Role Manager
- User Manager
- Session Manager
- Authentication Settings
- Preferences
- Cluster Manager
- Maintenance Windows
- Processes and Logs
- Metadata Schema
- Baseline Manager
- FlowFalcon View Editor
- Map Flow Objects
- FlowFalcon Views
- Flow Rules
- Flow Interface Manager
- MPLS Flow Mapping
- Network Segment Manager
- Flow Protocols and Services
- xStats Log Viewer
- SNMP Walk
- SNMP OID Browser
- MIB Manager
- Work Hours
- Administrative Messages
- Enable Flow Technologies
- Enable JMX
- Enable NBAR
- Enable SNMP
- Enable Web Status
- Enable WMI
- IP SLA
- SNMP
- SevOne Data Publisher
- Quality of Service
- Perl Regular Expressions
- Trap Revisions
- Integrate SevOne NMS With Other Applications
- Email Tips and Tricks
- SevOne NMS PHP Statistics
- SevOne NMS Usage Statistics
- Glossary and Concepts
- Map Flow Devices
- Trap v3 Receiver
- Guides
- Quick Start Guides
- AWS Quick Start Guide
- Azure Quick Start Guide (Public Preview)
- Data Miner Quick Start Guide
- Flow Quick Start Guide
- Group Aggregated Indicators Quick Start Guide
- IP SLA Quick Start Guide
- JMX Quick Start Guide
- Metadata Quick Start Guide
- RESTful API Quick Start Guide
- Self-monitoring Quick Start Guide
- SevOne NMS Admin Notifications Quick Start Guide
- SNMP Quick Start Guide
- Synthetic Indicator Types Quick Start Guide
- Topology Quick Start Guide
- VMware Quick Start Guide
- Web Status Quick Start Guide
- WMI Quick Start Guide
- xStats Quick Start Guide
- xStats Adapter - Accedian Vision EMS (TM) Quick Start Guide
- Deployment Guides
- Automated Build / Rebuild (Customer) Instructions
- Generate a Self-Signed Certificate or a Certificate Signing Request
- SevOne Best Practices Guide - Cluster, Peer, and HSA
- SevOne Data Platform Security Guide
- SevOne NMS Implementation Guide
- SevOne NMS Installation Guide - Virtual Appliance
- SevOne NMS Advanced Network Configuration Guide
- SevOne NMS Installation Guide
- SevOne NMS Port Number Requirements Guide
- SevOne NMS Upgrade Process Guide
- SevOne Physical Appliance Pre-Build BIOS and RAID Configuration Guide
- SevOne SAML Single Sign-On Setup Guide
- Cloud Platforms
- Other Guides
- Quick Start Guides
Threshold Browser
The Threshold Browser enables you to manage thresholds. A threshold is the value that triggers an alert or a trap. The Threshold Browser enables you to define standalone thresholds to apply to a single device. The Policy Browser enables you to create thresholds that apply to multiple devices.
To access the Threshold Browser from the navigation bar, click the Events menu, select Configuration, and then select Threshold Browser.
The Welcome Dashboard provides a Thresholds link to access the Threshold Browser.
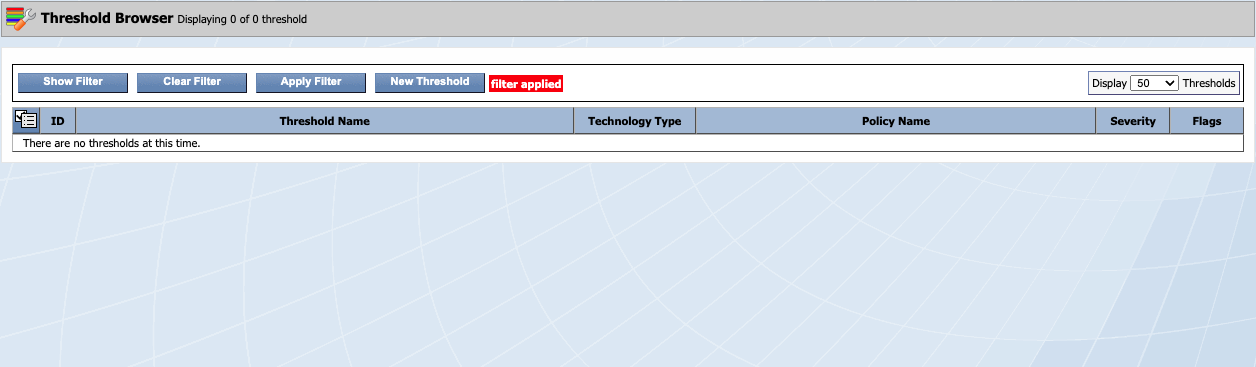
Click button Show Filter to expand the filter section. It displays controls that enable you to filter the list. When you click this button, tabs General and Specific are available.
Click Hide Filter button to collapse the filter section.
Click Apply Filter button to apply the filter settings.
Click Clear Filter button to remove all filters and to display all thresholds in the list.
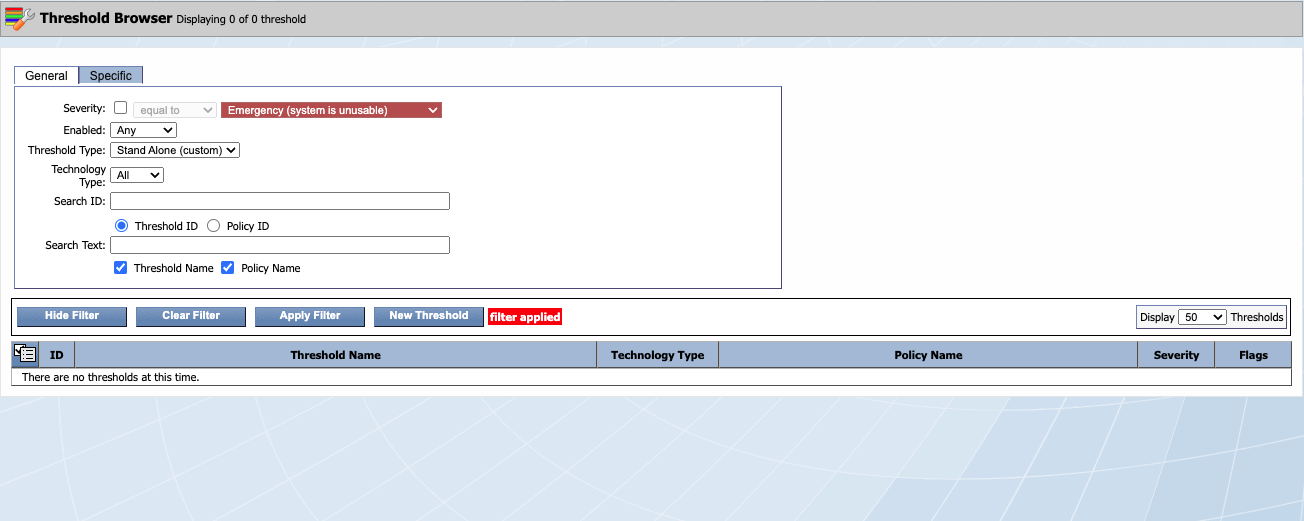
'General' Tab
In the filters section, the General tab provides the following general filters.
-
Select the Severity check box, then click the drop-down and select a comparison operator. Click the second drop-down and select a severity.
-
Click the Enabled drop-down.
-
Select Any to display both enabled and disabled thresholds.
-
Select Enabled to display only thresholds that are enabled.
-
Select Disabled to display only thresholds that are disabled.
-
-
Click the Threshold Type drop-down.
-
Select Stand Alone (custom) to display thresholds that are not associated with a policy.
-
Select Policy Based to display thresholds that policies create.
-
Select All types to display thresholds that meet the other filter criteria.
-
-
Click the Technology Type drop-down.
-
Select All to display all policies.
-
Select Flow to display thresholds that trigger based on flow data.
-
Select Metric to display thresholds that trigger based on non-flow data.
-
-
In the Search ID field, enter the threshold identifier and select the Threshold ID option or enter the policy identifier and select the Policy ID option.
-
In the Search Text field, enter text that appears in the threshold name and/or the policy name and select the corresponding Threshold Name and/or Policy Name check box.
-
Click Apply Filter to apply filter set. Click Clear Filter to clear the filter set.
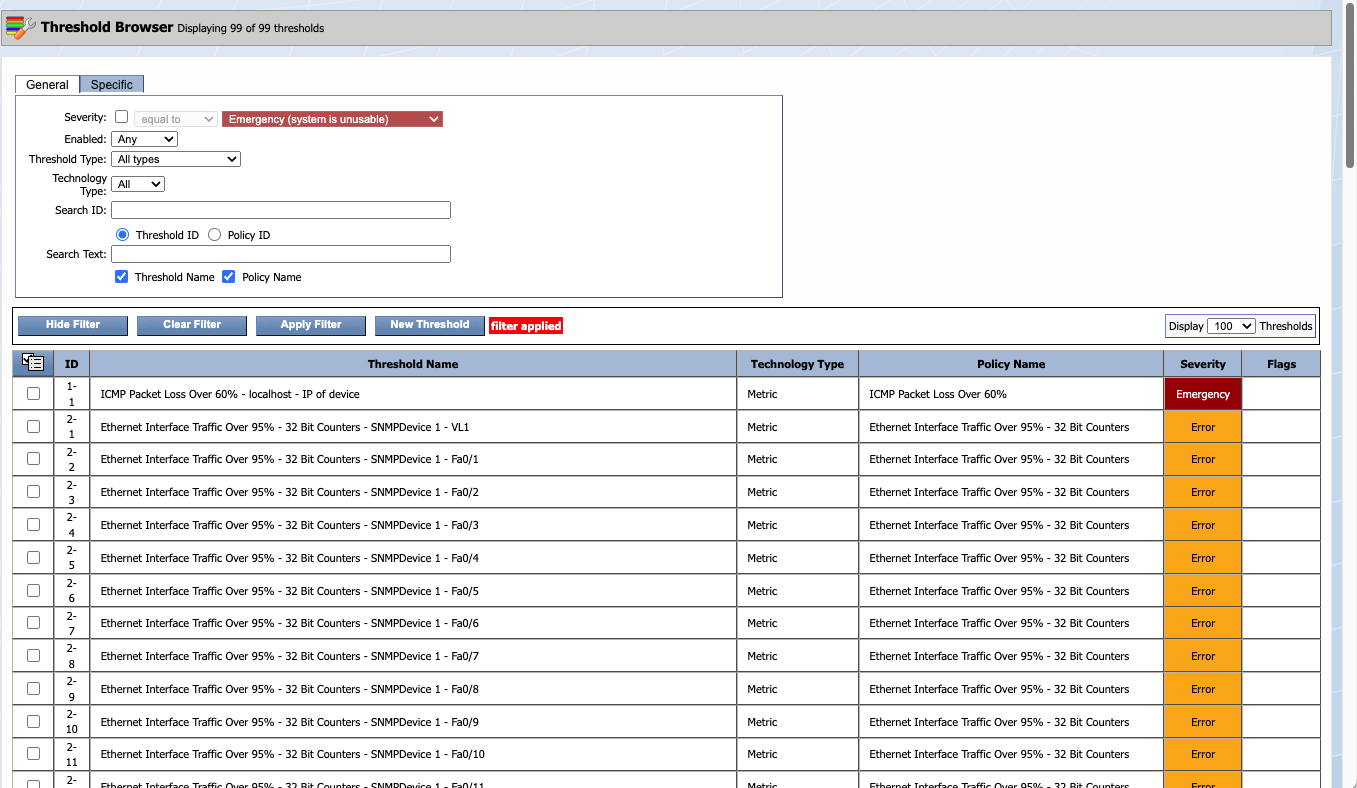
Choose option All types from Threshold Type drop-down list and click button Apply Filter to view the list of thresholds that apply to the filter set.
'Specific' Tab
In the filters section, the Specific tab provides the following filters. Most selections are dependent on the preceding selection.
-
Click the Technology type drop-down.
-
Select All to display all policies.
-
Select Flow to display devices that trigger flow alerts.
-
Select Metric to display devices that trigger non-flow alerts.
-
-
Click the Device drop-down and select the device that contains the indicator for the threshold you seek.
-
Click the Plugin drop-down and select the plugin that polls the indicator.
-
Click the Object drop-down and select the object that contains the indicator.
-
Click the Indicator drop-down and select the indicator that triggers the threshold.
-
Click Apply Filter to apply filter set. Click Clear Filter to clear the filter set.
Manage Thresholds
New Threshold
-
Click New Threshold button to create a new threshold. For details, please refer to Threshold Editor.
Existing Threshold(s)
After applying the filter, you receive a list of thresholds that apply to the filter set. Threshold list appears in the bottom-half of Threshold Browser page with the following columns.
-
ID - Displays the internal threshold identifier. ID format is x-y where x = Peer ID and y = Threshold ID.
-
Threshold Name - Displays the threshold name.
-
Technology Type - Displays Flow for thresholds triggered by flow data or displays Metric for thresholds triggered by all other non-flow data.
-
Policy Name - Displays the name of the policy that created the threshold. Displays Stand Alone when the threshold is not created from a policy.
-
Severity - Displays the severity level for alerts the threshold triggers.
-
Flags - Displays flags when you define the threshold to be emailed or to be scheduled.
-
 - Email
 -
 - Schedule
-
Click a name in Threshold Name column to view the details for the selected threshold. Please refer to Threshold Editor for details.
Other
Select the check box for each threshold to manage, click  , and select one of the following options.
-
Select Delete Selected to delete the thresholds selected in the list.
-
Select Disable Selected to disable the thresholds selected in the list. Disabled thresholds display in light text and do not trigger alerts or traps.
-
Select Enable Selected to enable the thresholds selected.