Table of Contents (Start)
- Topics
- Introducing SevOne
- Login
- Startup Wizard
- Dashboard
- Global Search - Advanced Search
- Report Manager
- Report Attachment Wizard
- Report Properties
- Report Interactions
- Instant Graphs
- TopN Reports
- Alerts
- Alert Archives
- Alert Summary
- Instant Status
- Status Map Manager
- Edit Maps
- View Maps
- FlowFalcon Reports
- NBAR Reports
- Logged Traps
- Unknown Traps
- Trap Event Editor
- Trap Destinations
- Trap Destination Associations
- Policy Browser
- Create and Edit Policies
- Webhook Definition Manager
- Threshold Browser
- Create and Edit Thresholds
- Probe Manager
- Discovery Manager
- Device Manager
- New Device
- Edit Device
- Object Manager
- High Frequency Poller
- Device Summary
- Device Mover
- Device Groups
- Object Groups
- Object Summary
- Object Rules
- VMware Browser
- AWS Plugin
- Azure Plugin (Public Preview)
- Calculation Plugin
- Database Manager
- Deferred Data Plugin
- DNS Plugin
- HTTP Plugin
- ICMP Plugin
- IP SLA Plugin
- JMX Plugin
- NAM
- NBAR Plugin
- Portshaker Plugin
- Process Plugin
- Proxy Ping Plugin
- SDWAN Plugin
- SNMP Plugin
- VMware Plugin
- Web Status Plugin
- WMI Plugin
- xStats Plugin
- Indicator Type Maps
- Device Types
- Object Types
- Object Subtype Manager
- Calculation Editor
- xStats Source Manager
- User Role Manager
- User Manager
- Session Manager
- Authentication Settings
- Preferences
- Cluster Manager
- Maintenance Windows
- Processes and Logs
- Metadata Schema
- Baseline Manager
- FlowFalcon View Editor
- Map Flow Objects
- FlowFalcon Views
- Flow Rules
- Flow Interface Manager
- MPLS Flow Mapping
- Network Segment Manager
- Flow Protocols and Services
- xStats Log Viewer
- SNMP Walk
- SNMP OID Browser
- MIB Manager
- Work Hours
- Administrative Messages
- Enable Flow Technologies
- Enable JMX
- Enable NBAR
- Enable SNMP
- Enable Web Status
- Enable WMI
- IP SLA
- SNMP
- SevOne Data Publisher
- Quality of Service
- Perl Regular Expressions
- Trap Revisions
- Integrate SevOne NMS With Other Applications
- Email Tips and Tricks
- SevOne NMS PHP Statistics
- SevOne NMS Usage Statistics
- Glossary and Concepts
- Map Flow Devices
- Trap v3 Receiver
- Guides
- Quick Start Guides
- AWS Quick Start Guide
- Azure Quick Start Guide (Public Preview)
- Data Miner Quick Start Guide
- Flow Quick Start Guide
- Group Aggregated Indicators Quick Start Guide
- IP SLA Quick Start Guide
- JMX Quick Start Guide
- Metadata Quick Start Guide
- RESTful API Quick Start Guide
- Self-monitoring Quick Start Guide
- SevOne NMS Admin Notifications Quick Start Guide
- SNMP Quick Start Guide
- Synthetic Indicator Types Quick Start Guide
- Topology Quick Start Guide
- VMware Quick Start Guide
- Web Status Quick Start Guide
- WMI Quick Start Guide
- xStats Quick Start Guide
- xStats Adapter - Accedian Vision EMS (TM) Quick Start Guide
- Deployment Guides
- Automated Build / Rebuild (Customer) Instructions
- Generate a Self-Signed Certificate or a Certificate Signing Request
- SevOne Best Practices Guide - Cluster, Peer, and HSA
- SevOne Data Platform Security Guide
- SevOne NMS Implementation Guide
- SevOne NMS Installation Guide - Virtual Appliance
- SevOne NMS Advanced Network Configuration Guide
- SevOne NMS Installation Guide
- SevOne NMS Port Number Requirements Guide
- SevOne NMS Upgrade Process Guide
- SevOne Physical Appliance Pre-Build BIOS and RAID Configuration Guide
- SevOne SAML Single Sign-On Setup Guide
- Cloud Platforms
- Other Guides
- Quick Start Guides
WMI Quick Start Guide
SevOne Documentation
All documentation is available from the IBM SevOne Support customer portal.
© Copyright International Business Machines Corporation 2024.
All right, title, and interest in and to the software and documentation are and shall remain the exclusive property of IBM and its respective licensors. No part of this document may be reproduced by any means nor modified, decompiled, disassembled, published or distributed, in whole or in part, or translated to any electronic medium or other means without the written consent of IBM.
IN NO EVENT SHALL IBM, ITS SUPPLIERS, NOR ITS LICENSORS BE LIABLE FOR ANY DAMAGES, WHETHER ARISING IN TORT, CONTRACT OR ANY OTHER LEGAL THEORY EVEN IF IBM HAS BEEN ADVISED OF THE POSSIBILITY OF SUCH DAMAGES, AND IBM DISCLAIMS ALL WARRANTIES, CONDITIONS OR OTHER TERMS, EXPRESS OR IMPLIED, STATUTORY OR OTHERWISE, ON SOFTWARE AND DOCUMENTATION FURNISHED HEREUNDER INCLUDING WITHOUT LIMITATION THE WARRANTIES OF DESIGN, MERCHANTABILITY OR FITNESS FOR A PARTICULAR PURPOSE, AND NONINFRINGEMENT.
IBM, the IBM logo, and SevOne are trademarks or registered trademarks of International Business Machines Corporation, in the United States and/or other countries. Other product and service names might be trademarks of IBM or other companies. A current list of IBM trademarks is available on ibm.com/trademark.
About
WMI
Windows Management Instrumentation (WMI) is based on the Common Information Model (CIM). In the 1990s, the Distributed Management Task Force (DMTF) worked on an industry-wide standard for managing objects across networks and to accommodate all kinds of devices, from networking equipment to servers, and individual computers. For this, Common Information Model (CIM) was introduced.
The CIM is a hierarchical, object-oriented schema made up of three main class levels.
-
Core level - is technology-neutral and includes general classes that apply to all areas of management. For example, Component, Collection, and Statistical Information.
-
Common level - is vendor-neutral and extends from the Core level. Common classes include networks, systems, devices, databases, and users.
-
Extension level - is vendor-specific. Extension classes extend from common classes although, they can also extend from core classes. Win32_BaseService and Win32_ComputerSystem are examples of Windows extension classes.
WMI incorporates components of CIM, such as systems, devices, and applications. It also has the extensibility of the CIM. The newest generation of WMI is known as Windows Management Infrastructure (rather than Instrumentation), or MI for short, starting with Windows 8 and Server 2012. The term WMI is still in wide use, though.
How WMI Works
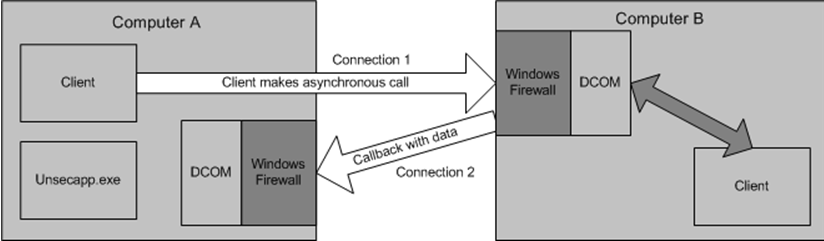
In the diagram below, two devices talking to each other, Computer A and Computer B. Computer A is simply a device that sends WMI queries to another device. In this example,
-
Computer A is the WMI proxy server - please refer to section Configuration for setup.
-
Computer B is the device that receives the WMI queries and sends back answers.
Let's assume that Computer B is a Windows 7 machine. Computer A sends a WMI query to Computer B. It may ask who is logged in to Computer B right now. Computer B receives the request, then sends an answer back to Computer A.
In the diagram, Connection 1 represents the part where Computer A says to Computer B Hey, who's logged in right now?
To do this, WMI has to establish a DCOM connection from Computer A to Computer B. You will need to configure the Windows Firewall and DCOM on Computer B during configuration. Connection 2 represents Computer B's response to Computer A. Generally speaking, both connections (1 and 2) are asynchronous.
WMI Classes
WMI has several classes. If you visit Microsoft's Win32 Provider page, you will find four broad class categories. Click on Operating System Classes, and you will see a long list of WMI classes representing objects related to the operating system. From there, click on the class Win32_ComputerSystem. This will bring up a long list to learn about a particular Windows device. For instance, you can find out whether a computer belongs to a domain, how many processors it has, its power status, its time zone, the name of the user currently logged on, etc.
Win32_ComputerSystem is one of many operating system classes. If you jump over to the Computer System Hardware Classes, you will see a lot of hardware-related classes. Check out the class Win32_NetworkAdapter, for example. You can use this class to find out more about a computer's network adapter.
SevOne's WMI plugin takes full advantage of WMI's power and flexibility. Once you set up your devices for WMI polling, you can create hundreds of indicator types based on WMI classes. These indicator types provide you all kinds of statistics such as, CPU usage, hard drive usage, memory usage, and ASP.NET.
SevOne NMS only ingests Win32_PerfFormattedData classes.
Classes in Action
(Optional) If you would like to see WMI classes in action, open up PowerShell and try out the following commands. Otherwise, proceed to the next section to get started with WMI monitoring using SevOne NMS.
-
The extension class Win32_ComputerSystem represents a computer system running Windows. It is extended from a class called CIM_UnitaryComputerSystem. The CIM_UnitaryComputerSystem class represents any number of single-node computer systems, including desktops, laptops, servers, etc. The following command returns the manufacturer and model of a computer.
Get-WmiObject Win32_ComputerSystem | Select Manufacturer,Model -
Now try something from the Windows Performance Counter Classes. The following command employs the Win32_PerFormattedData_PerfProc_Process extension class and returns the amount of non-paged pool memory in bytes.
Get-WmiObject Win32_PerfFormattedData_PerfProc_Process | Select PoolNonpagedBytes
Internal testing shows that th e proxy service can handle 500 client load with 4500 objects.
The WMI Proxy server used was Window Server 2012 VM with 4 vCPUs, 8GB RAM, and 40GB Hard Drive.
Prerequisites
Before getting started, you will need the following information handy for the proxy server as well as for any devices that you plan to monitor using WMI.
Proxy Server
-
Name
-
IP address
-
Port number to use (default is 3000)
Devices Monitored via WMI
-
User name and password
-
Name of workgroup or domain
-
Authentication protocol: NT LAN Manager (NTLM) or Kerberos?
Configuration
This section provides details on how to set up your devices to be monitored with SevOne's WMI plugin.
Set up a WMI proxy server
The proxy server is the Windows device that sends WMI queries to any Windows devices you would like to monitor with SevOne's WMI plugin. SevOne NMS provides a Windows service for your proxy server, and installation of this is part of the setup. During the setup process, you will be going back and forth between SevOne NMS and your proxy server.
-
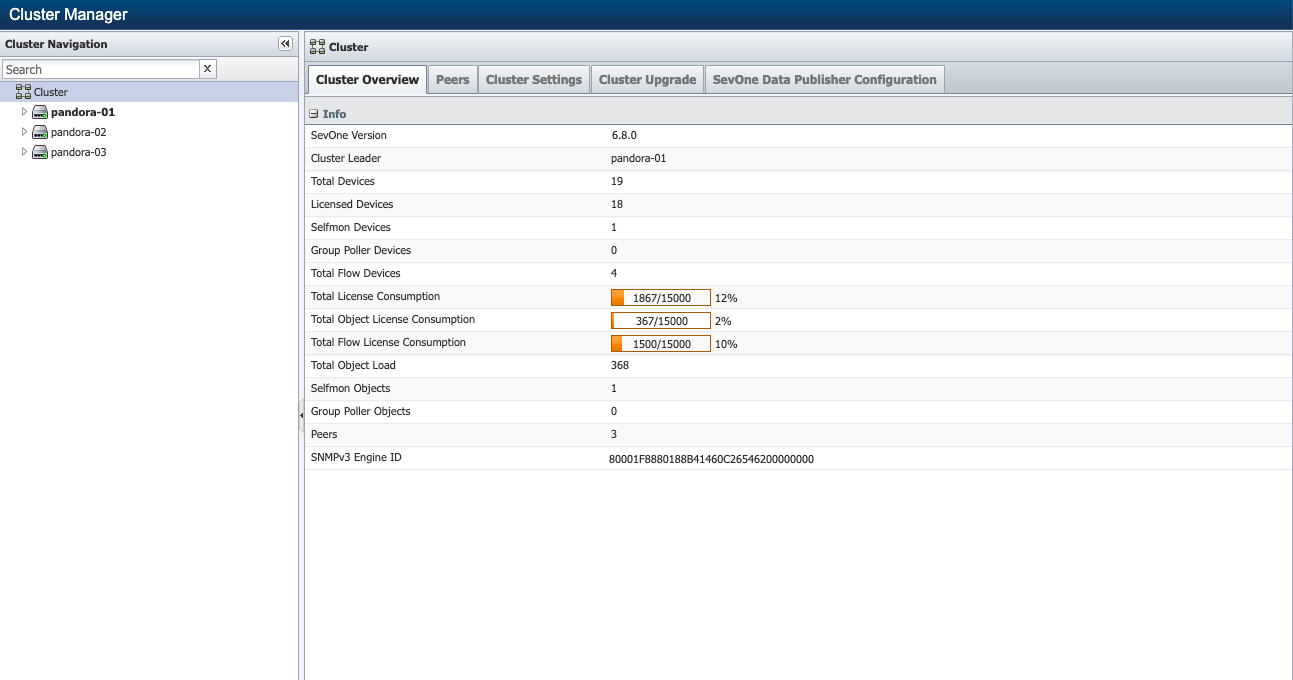
In SevOne NMS, click the Administration menu and select Cluster Manager.
-
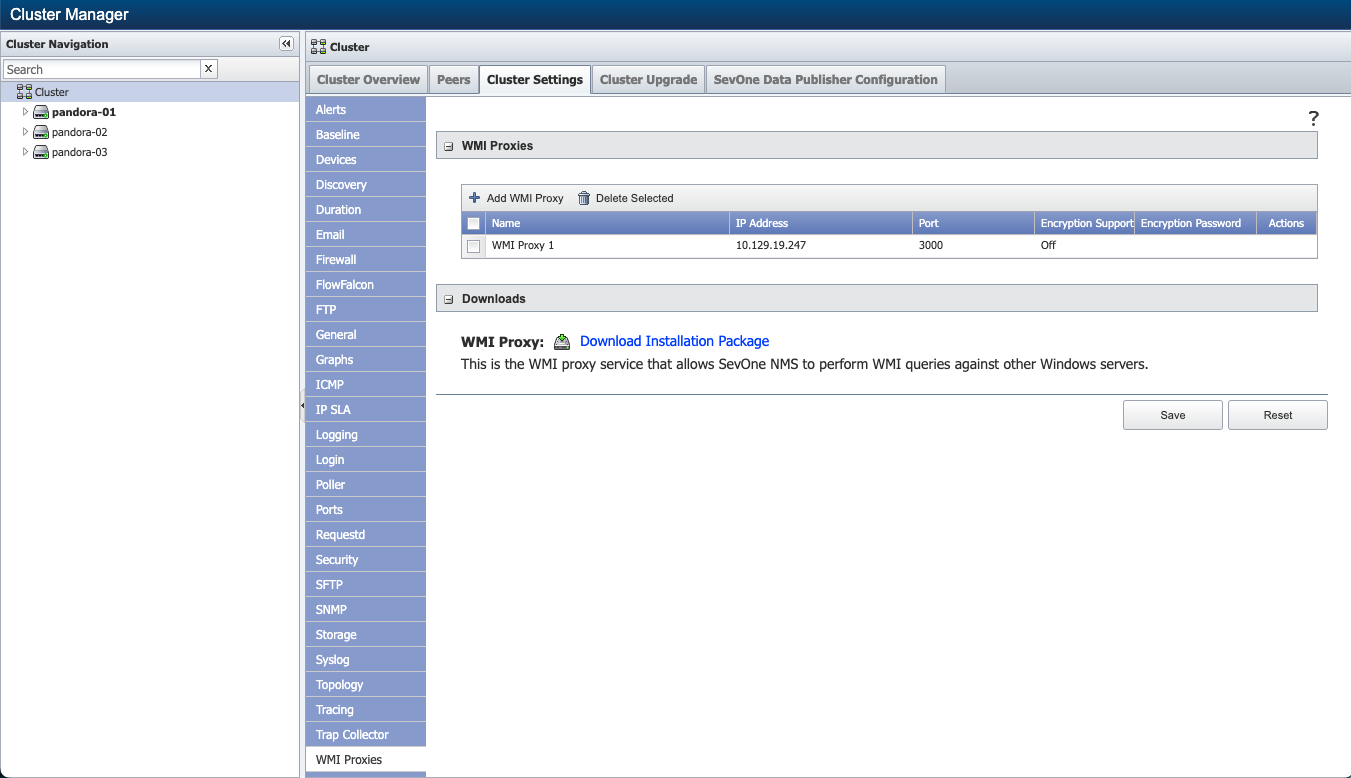
Select the Cluster Settings tab.
-
On the left, scroll down and select the WMI Proxies subtab.
-
Under Downloads, next to WMI Proxy, click the Download Installation Package link. Then save the file WMIServerServiceSetup.exe to your proxy server.
-
If the proxy server is not running the Microsoft .NET 3.5 framework, you will need to download it. Next to .NET 3.5 Framework, click the Download Installation Package link. Then save the file setup.exe to the proxy server.
-
Go to your proxy server.
-
Log in as the local administrator.
-
If needed, run the .NET 3.5 Framework setup.exe.
-
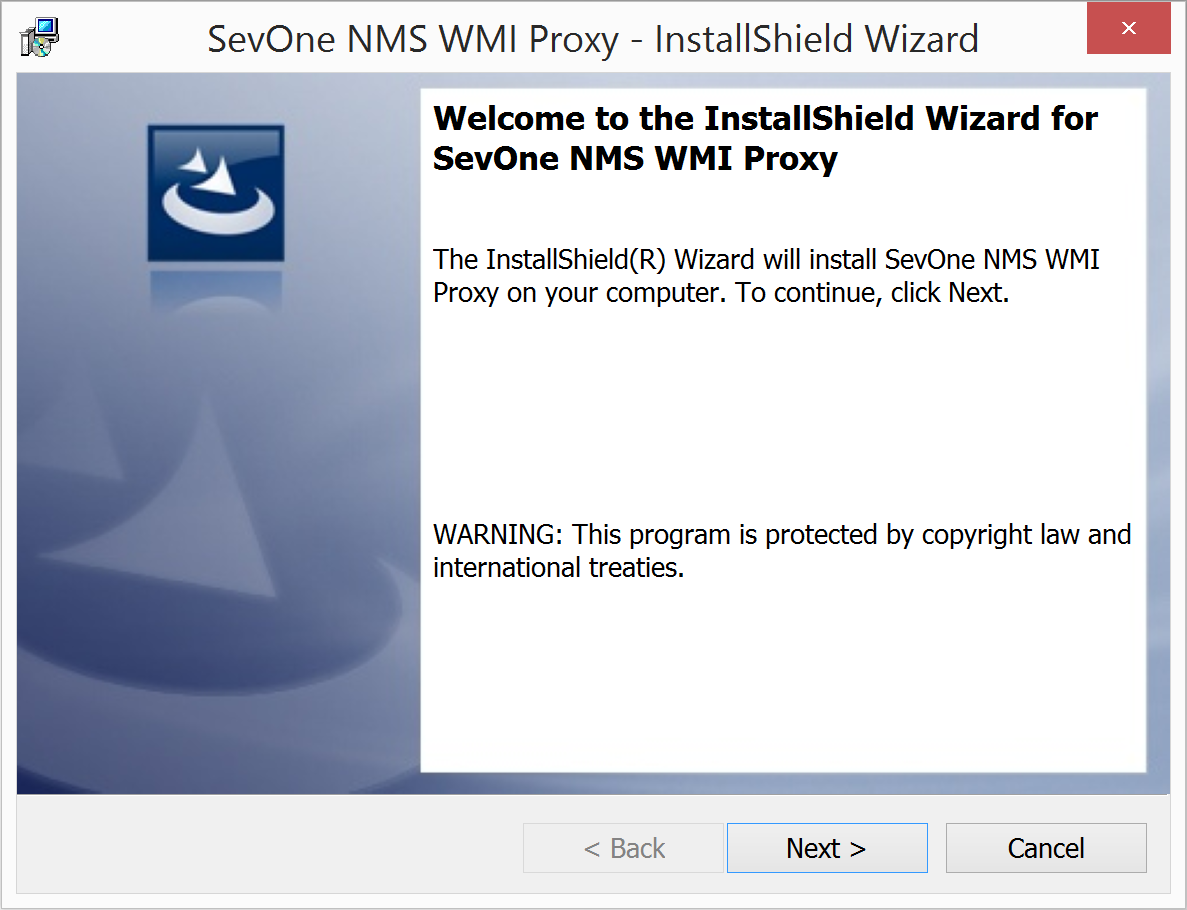
Run the file WMIServerServiceSetup.exe to install SevOne NMS WMI Proxy.
-
In Windows, click the Start button to display the Start menu.
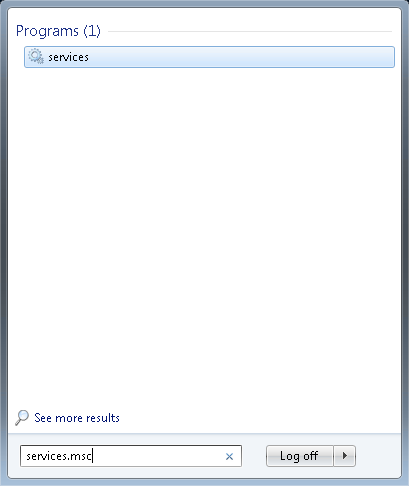
-
In the search field, type services.msc and hit Enter to display Windows Services.
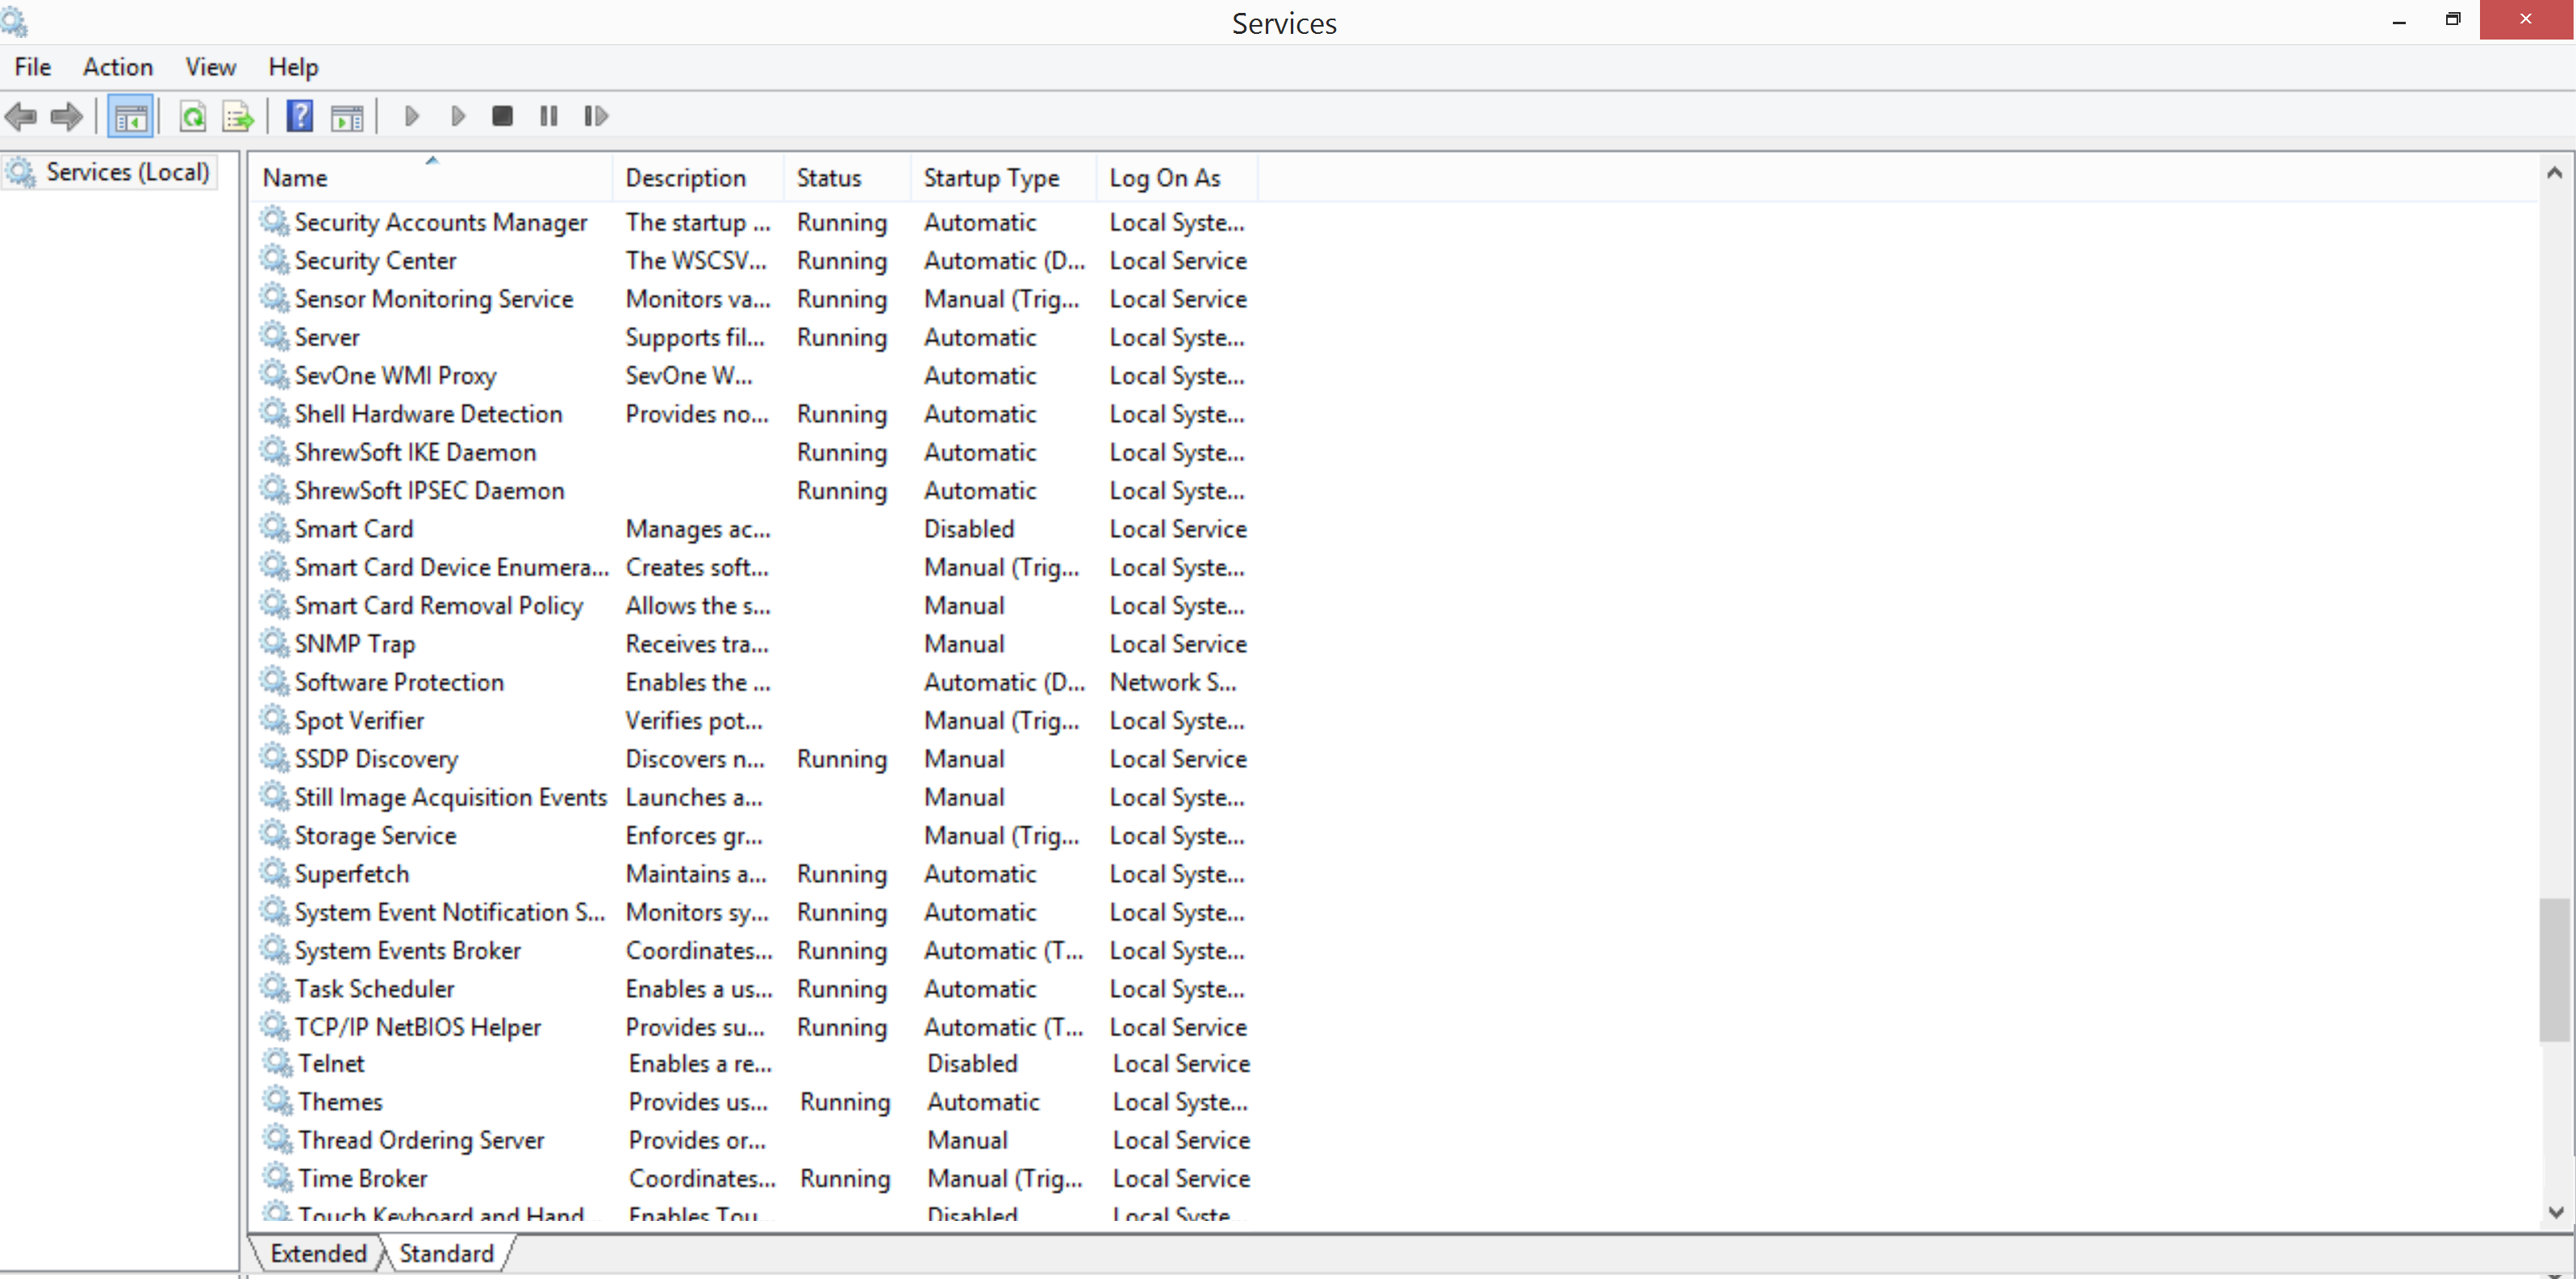
-
The services are listed in the right pane. Right-click on SevOne WMI Proxy and select Start.
-
Return to SevOne NMS.
-
On the Cluster Settings tab > WMI Proxies subtab, click Add WMI Proxy to display the Add WMI Proxy pop-up.
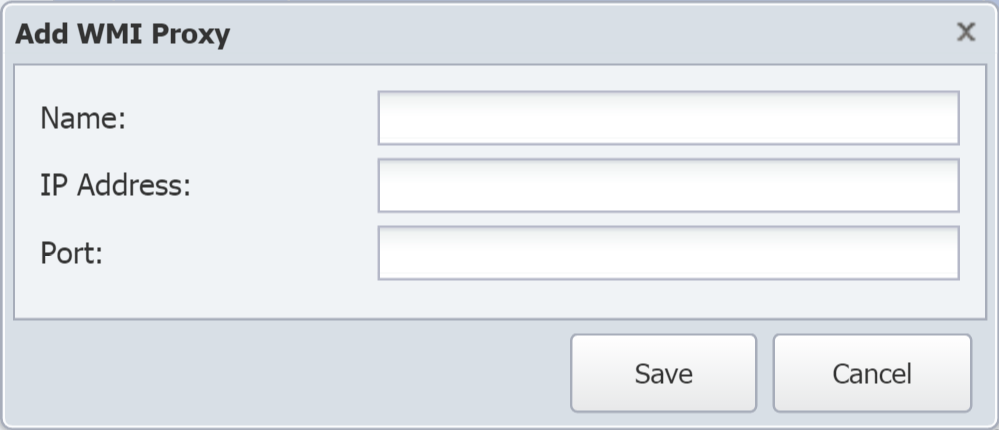
-
In the Name field, enter the name of the proxy server.
-
In the IP address field, enter the proxy server IP address.
-
In the Port field, enter the port that the proxy server will use to communicate with SevOne NMS. The default is 3000.
-
Click Save.
-
At the bottom right of the page, click Save to save your settings.
Configure Windows Devices
In this section, you will configure the Windows devices that you are going to monitor.
Your proxy server is set up and ready to start asking some questions. Now, configure the devices you plan to monitor so they can send responses back to the proxy. All the steps in this subsection will be performed within Windows. Once done, you would have accomplished the following.
-
Enable WMI on the devices you plan to monitor
-
Allow remote administration on those same devices
-
Enable the devices to communicate back to the WMI proxy
The details below are outside of SevOne NMS and may require additional steps depending on your specific device and operating system. The steps below are based on Windows 7 and should work with Windows 8 as well. Deprecated versions of the CLI commands are included in case you have an older version of Windows.
Enable WMI
Start the WMI service for the Windows devices you want to monitor. Perform the following steps for each device.
-
Click the Start button to display the Start menu.
-
In the search field, type services.msc and hit Enter to display Windows Services.
-
In the right pane, right-click on WMI Performance Adapter and select Properties.
-
Select the General tab.
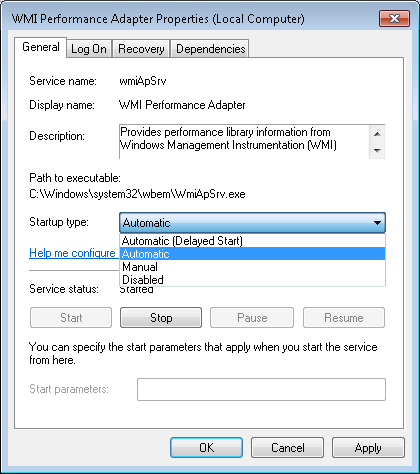
-
Click the Startup type drop-down and select Automatic. This will set the service to start every time the computer starts.
-
Click OK to apply the change and close the pop-up.
Allow Remote Administration
After you have enabled WMI on a device, you will need to configure it to be managed remotely. You can do this either through the Control Panel or using the command line. The following instructions are based on Windows 7 and should work with Windows 8 as well.
Option 1: GUI
-
Click the Start button to display the Start menu.
-
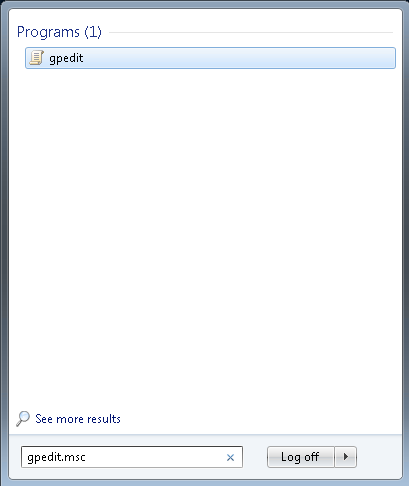
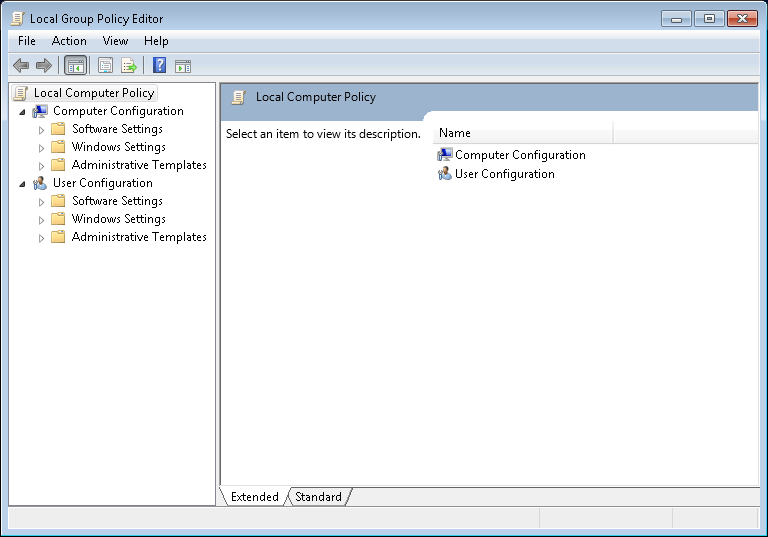
In the search field, type gpedit.msc and hit Enter to display the Local Group Policy Editor.
-
In the left pane, expand Computer Configuration.
-
Expand Administrative Templates.
-
Expand Network.
-
Expand Network Connections.
-
Expand Windows Firewall, then perform one of the following actions.
-
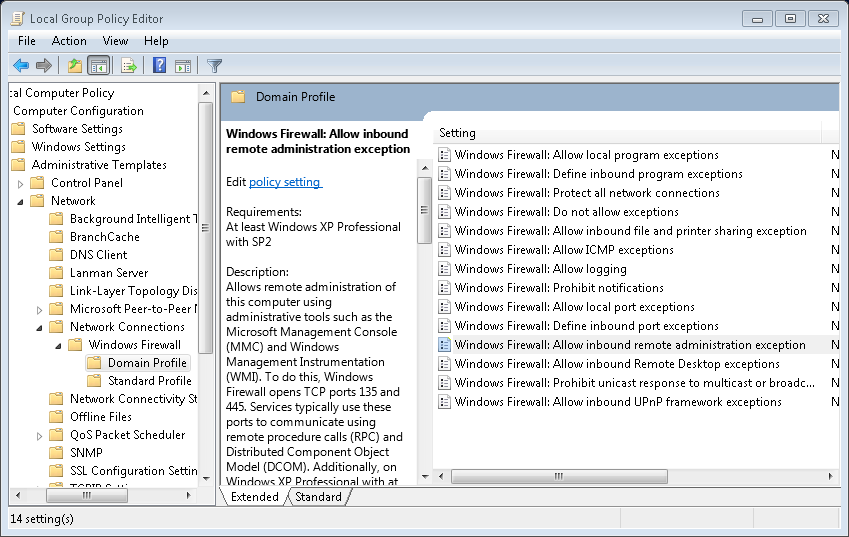
If the device belongs to the domain, select the Domain Profile folder.
-
If the device does not belong to the domain, select the Standard Profile folder.
-
-
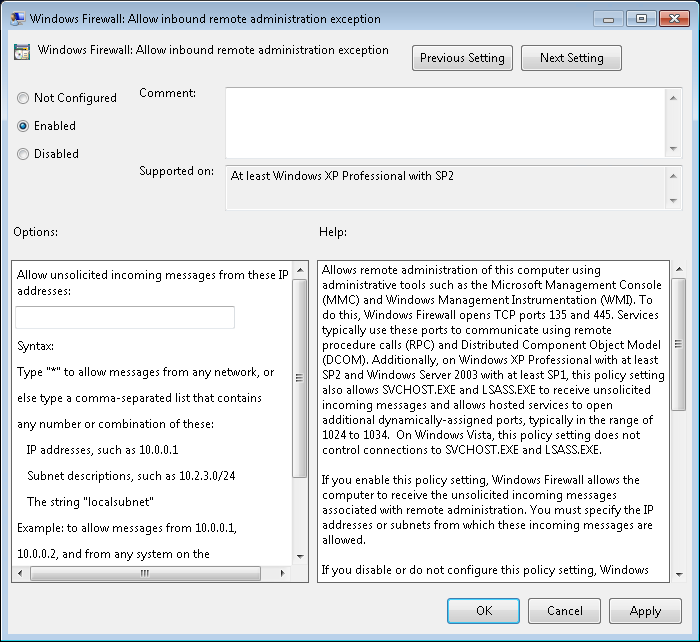
In the right pane, you will see a list of policy settings. Double-click on the one that says Windows Firewall: Allow inbound remote administration exception.
-
This will display a pop-up where you can edit the policy setting. In the upper-left area of the pop-up, select the Enabled radio button.
-
Click OK to apply the change and save.
Option 2: Command Line
This option is only available if you are using Windows 10 version 21H1 or older.
Perform the following steps.
-
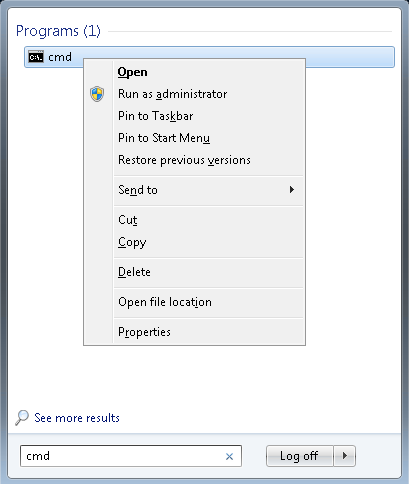
In Windows, click the Start button. Then type cmd in the search bar, but do not hit Enter.
-
Under Programs, right click on cmd and select Run as administrator. If you are not logged in as an administrator, you will need to enter administrator credentials.
-
At the command prompt, type the following command, then hit Enter.
ExampleC:\Windows\system32> netsh advfirewall firewallsetrule group="Windows Remote Management"newenable=yesUpdated 4 rule(s).Ok.C:\Windows\system32>
The following is the deprecated version of the command.
ExampleC:\Windows\system32> netsh firewallsetservice RemoteAdminenable
Enable Windows Devices to respond to the WMI Proxy
WMI plugin must be enabled for the devices you want to monitor.
Going back to the diagram above, the connection from Computer B to Computer A (Connection 2) is only necessary when the client script or application on Computer A makes an asynchronous call to Computer B. If Computer B belongs to a workgroup or a domain that is not trusted by Computer A, then Connection 2 becomes an anonymous connection.
-
If Windows Firewall is enabled on the proxy (Computer A from the diagram), run the following command on it to enable Allow remote administration exception and to open DCOM port TCP 135 on the proxy.
ExampleC:\Windows\system32> netsh advfirewall firewall add ruledir=inname="DCOM"\program=%systemroot%\system32\svchost.exe service=rpcss action=allow \protocol=TCP localport=135Ok.
The following is the deprecated version of the command.
ExampleC:\Windows\system32> netsh firewall add portopening protocol=tcp port=135 name=DCOM_TCP135 -
Add the client application script, Unsecapp.exe, to the Windows Firewall Exception List on the proxy (Computer A). Unsecapp.exe acts as the WMI callback client and it is used specifically for asynchronous operations. If a process does not have DCOM permission, unsecapp.exe is used to send data back to the client because it takes callbacks from everyone.
ExampleC:\Windows\system32> netsh advfirewall firewall add ruledir=inname="UnsecApp"\program=%systemroot%\system32\wbem\unsecapp.exe action=allowOk.
The following is the deprecated version of the command.
ExampleC:\Windows\system32> netsh firewall add allowedprogram program=%windir%\system32\wbem\unsecapp.exe \name=UNSECAPP
Additional Details: Try out WMIC Commands
(Optional) You can use WMIC commands to test the WMI setup on the devices to be monitored. To do this, find a computer that is on the same network as the device you want to send commands to. This computer would play the role of Computer A from the diagram above.
Before getting started, you must know the host name of the computer you are sending commands to. i.e., the device playing the role of Computer B and, if possible, its IP address. Also, make sure that computer is powered on.
-
Open the command line interface (CLI) on your computer (Computer A).
Run the CLI as an administrator if you are not already logged into Windows as an admin.
-
At the command prompt, type in wmic, then hit Enter.
C:\Windows\system32> wmicwmic:root\cli> -
At the WMIC prompt, type the following command and hit Enter. Replace [host name] with the computer's host name or IP address. This should return the user name.
wmic:root\cli>/node:<enter IP address orhostname> computersystem get usernamewmic:root\cli>/node:192.168.56.1 computersystem get usernameUserNameagoodman-yoga\xsmith -
The following command returns the machine's serial number.
wmic:root\cli>/node:<enter IP address orhostname> bios get serialnumber
Enable WMI Plugin
The WMI plugin enables you to monitor Windows Management Instrumentation data, including CPU usage, ASP.NET, hard drive usage, and memory usage. By default, it is disabled on new devices because it requires device-specific configuration.
Perform the following steps to enable the WMI plugin for devices.
-
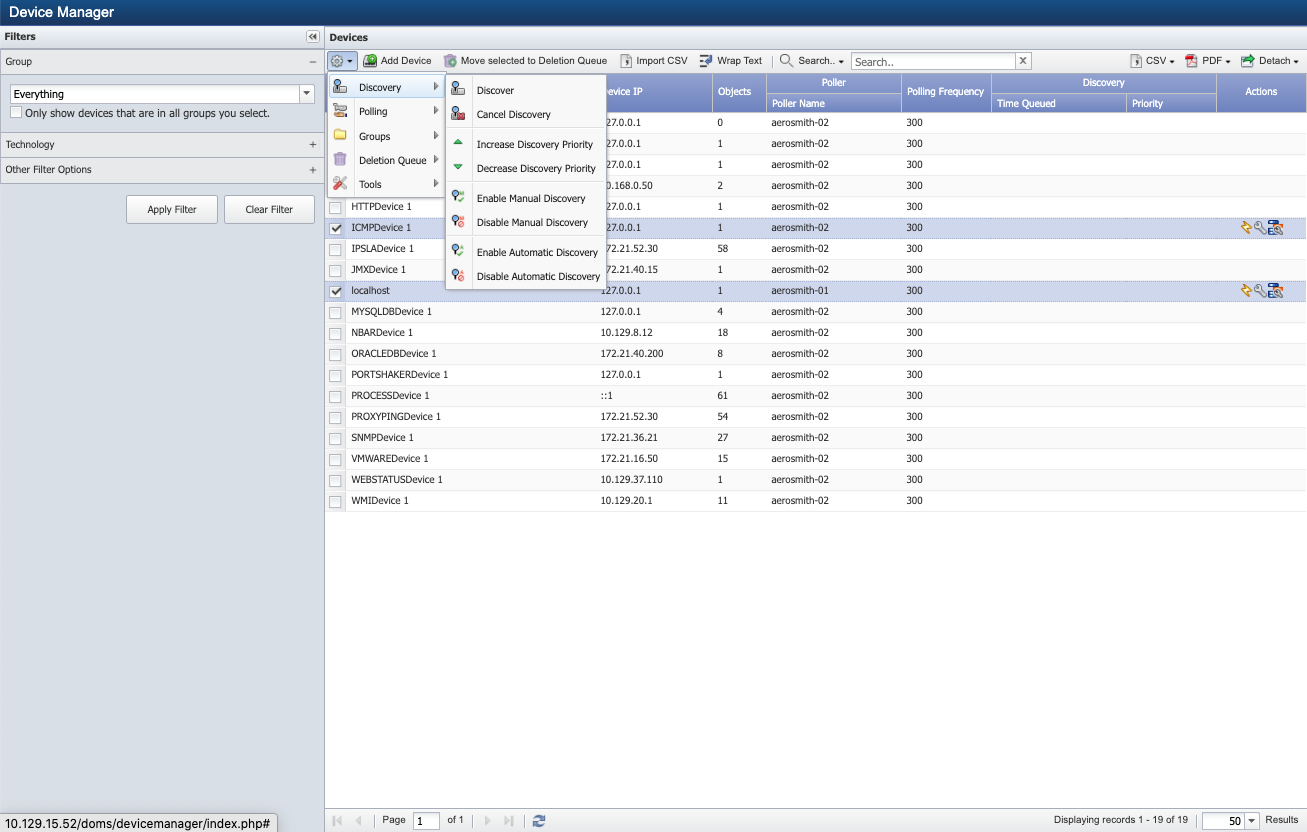
From the navigation bar, click Devices and select Device Manager.
-
Perform one of the following actions.
-
To add a new device, click Add Device under Devices to display the New Device page. For additional details, please refer to SevOne NMS User Guide > topic New Device.
-
To edit an existing device, select the device and click
 to display the Edit Device page.
-
-
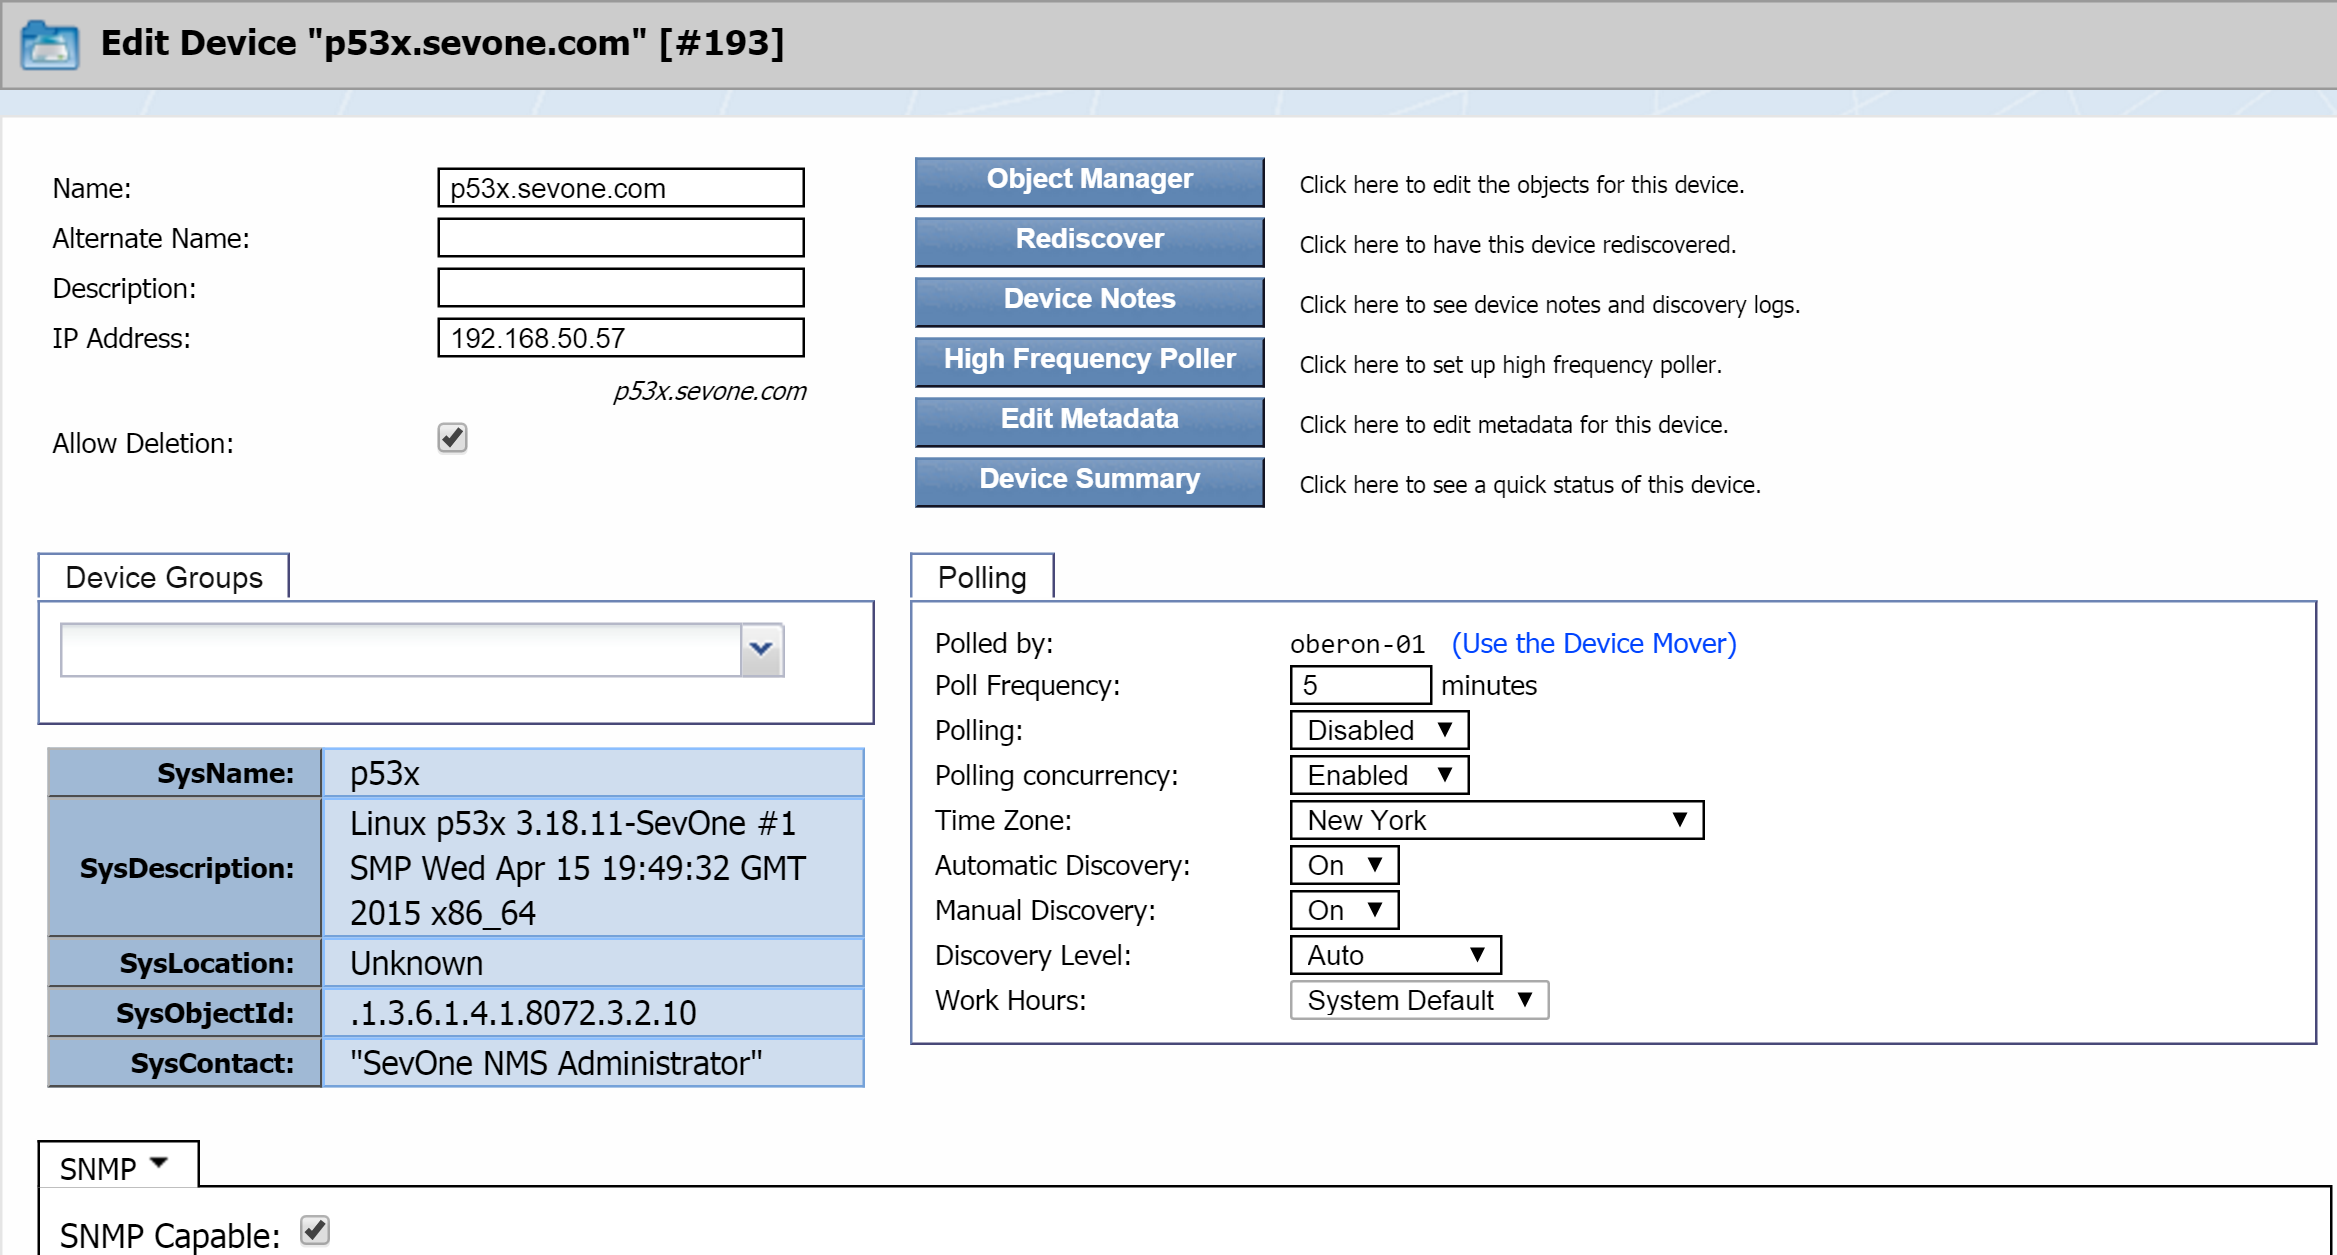
The plugin section appears in the lower half of the page. It is set to SNMP by default.
-
Next to SNMP, click the drop-down and select WMI.

-
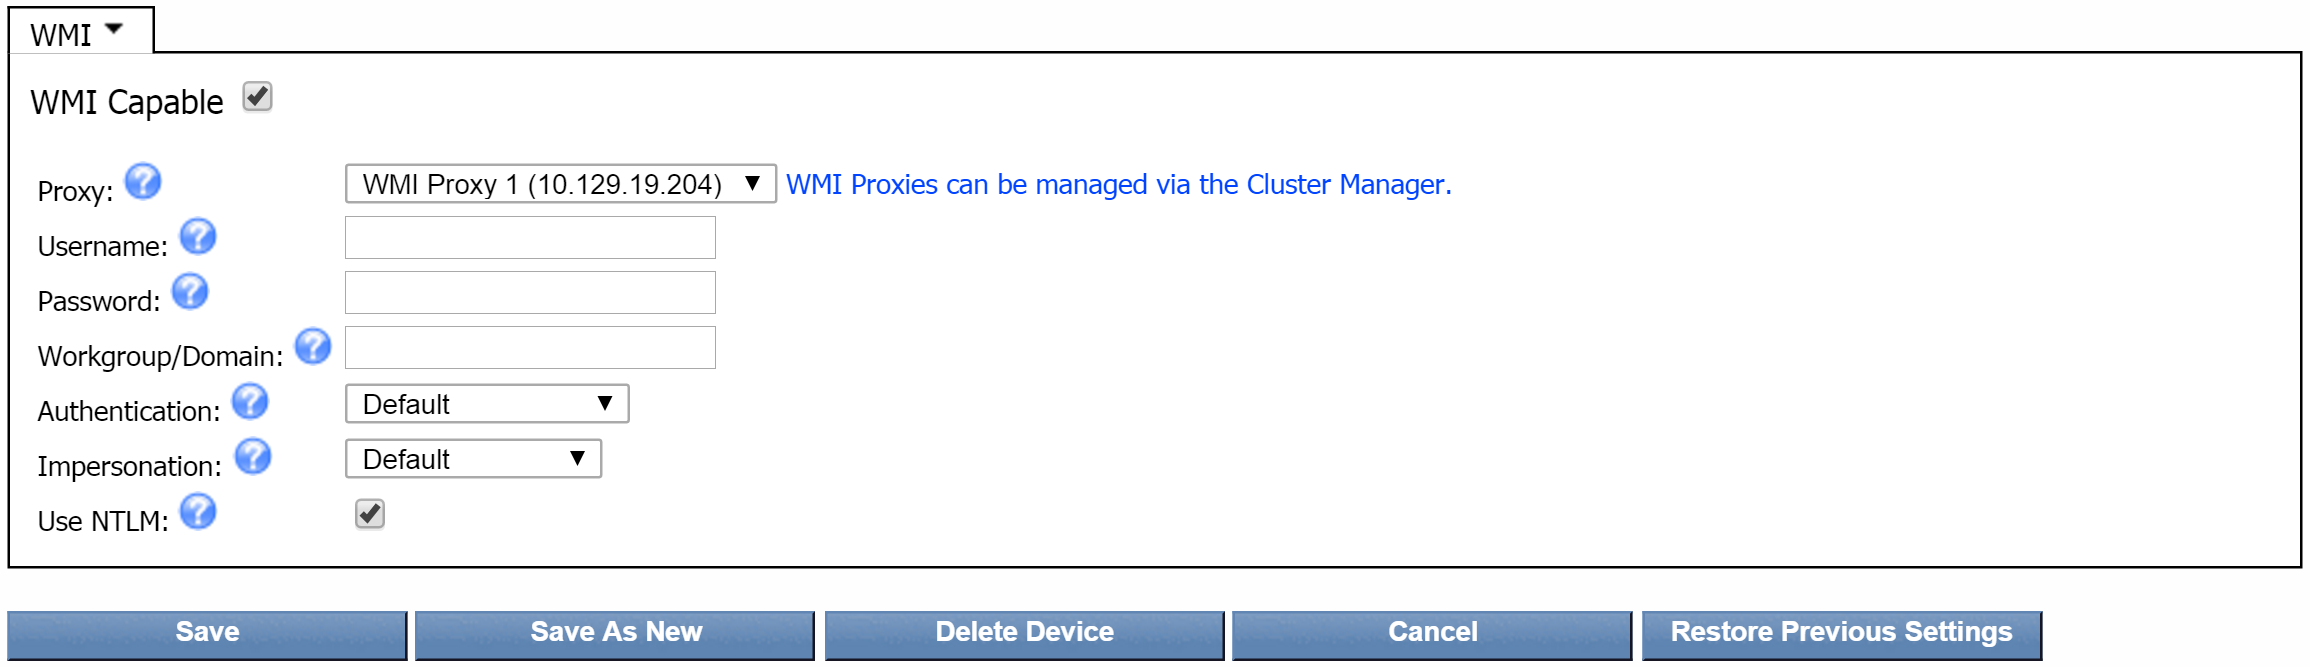
Select the WMI Capable check box.
-
Click the Proxy drop-down and select a proxy server to poll WMI data for your device. If you do not see the proxy server that you are looking for, click the WMI Proxies can be managed via the Cluster Manager link to the right of the Proxy field. This will take you to the Cluster Manager, where you can add and edit proxy servers.
-
In the Username field, enter the user name that the proxy needs to authenticate onto the device.
-
In the Password field, enter the password that the proxy needs to authenticate onto the device.
-
In the Workgroup/Domain field, enter the workgroup or domain that the device belongs to.
-
Click the Authentication drop-down and select the authentication level required to access the device. This is typically set to Default or Packet. You may need to experiment with one of the Advanced methods.
-
Click the Impersonation drop-down and select the impersonation level for accessing the device. This is typically set to Default or Impersonate.
-
Select the Use NTLM check box to use Microsoft's NT LAN Manager (NTLM). Leave this check box clear if your network uses Kerberos.
Kerberos has replaced NTLM as the default authentication protocol in an Active Directory-based single sign-on scheme.
-
Click Save.
Manage WMI Object Types
For this section, go to Object Types, where you can manage WMI object types. Object types let you determine which objects are discovered on a device. The WMI plugin discovers the WMI indicator types for the object types you enable. WMI object types are disabled by default. Object Rules allows you to define rules to disable polling of objects, and the Object Manager lets you manage the objects on each device.
Perform the following steps to add and edit WMI object types.
-
From the navigation bar, click Administration and select Monitoring Configuration, then Object Types.
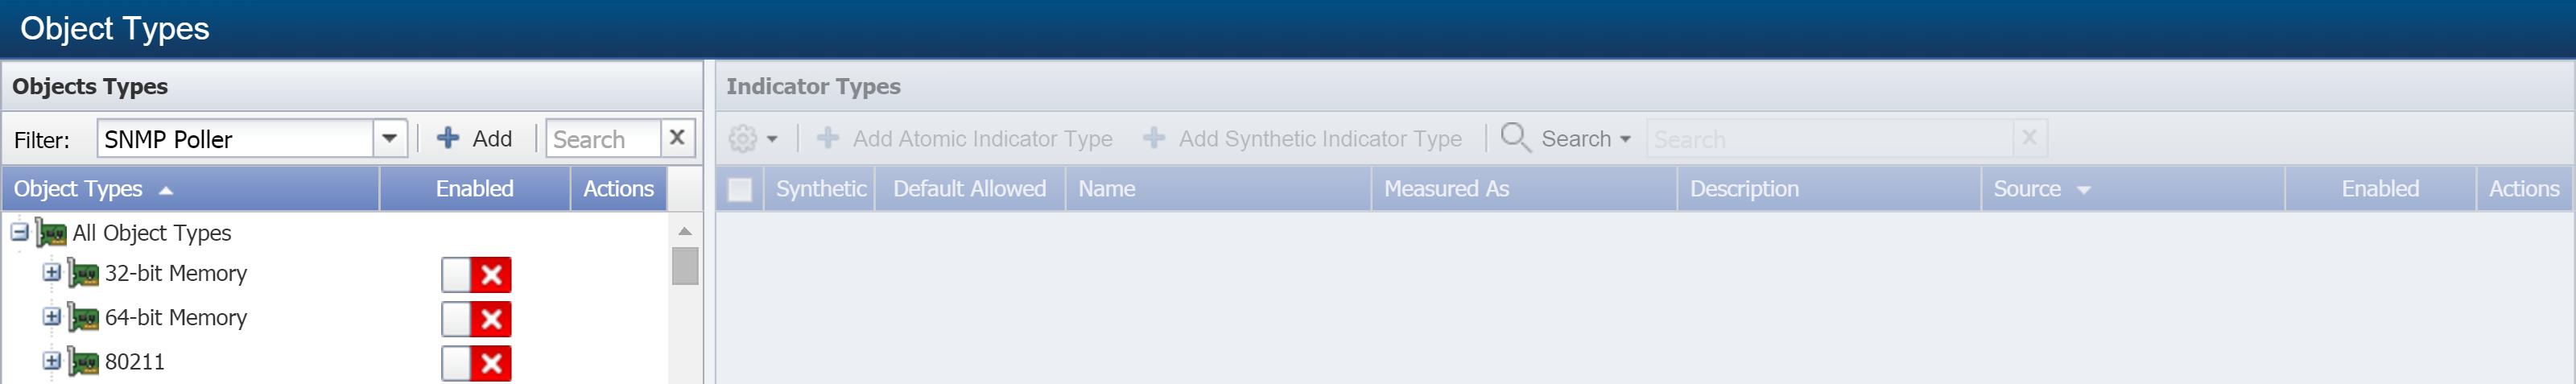
-
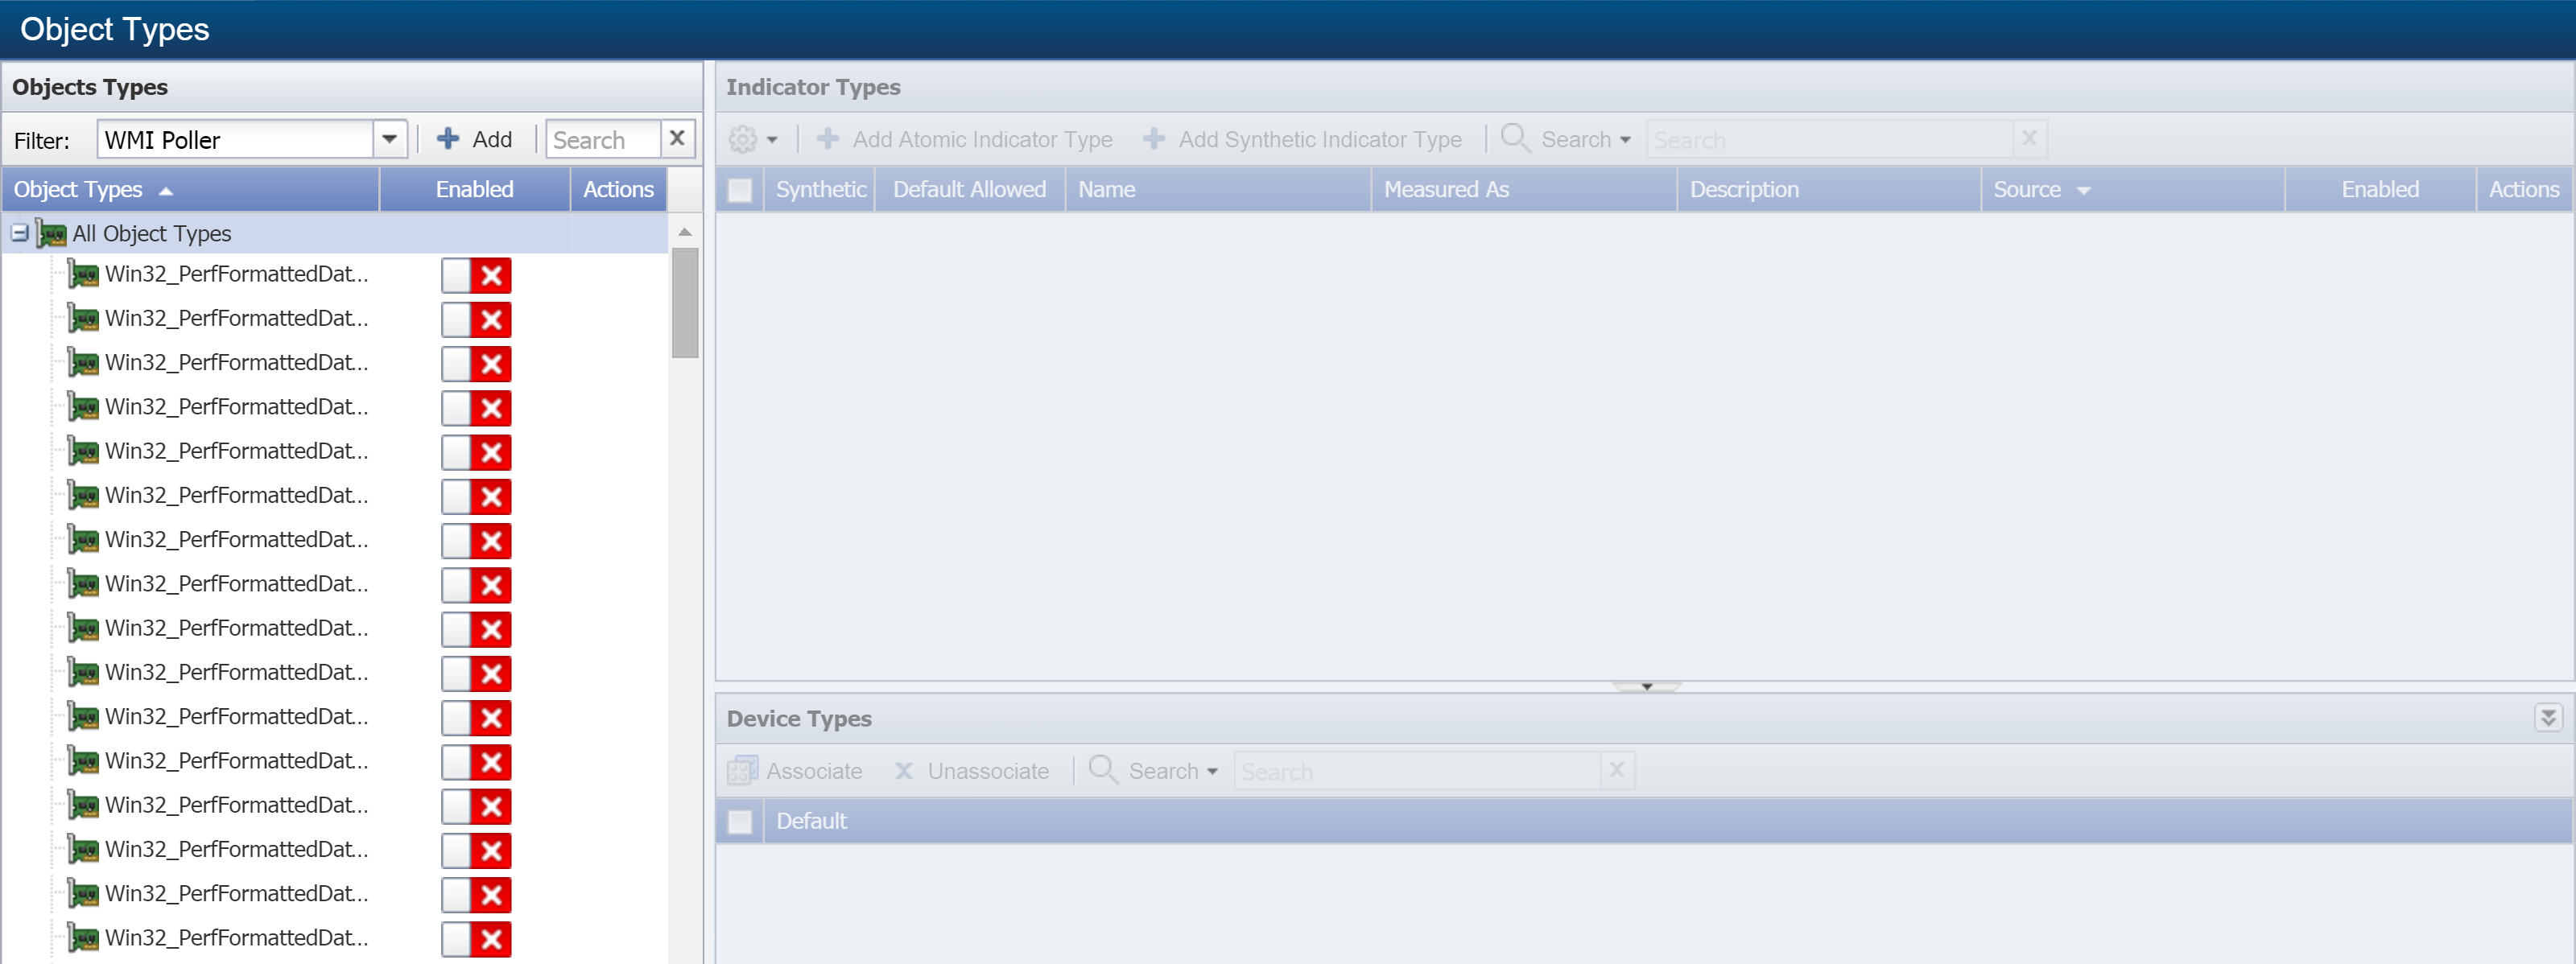
Click the Filter drop-down and select WMI Poller. In the Object Types hierarchy on the left, you will see the object types that the WMI plugin can poll.
-
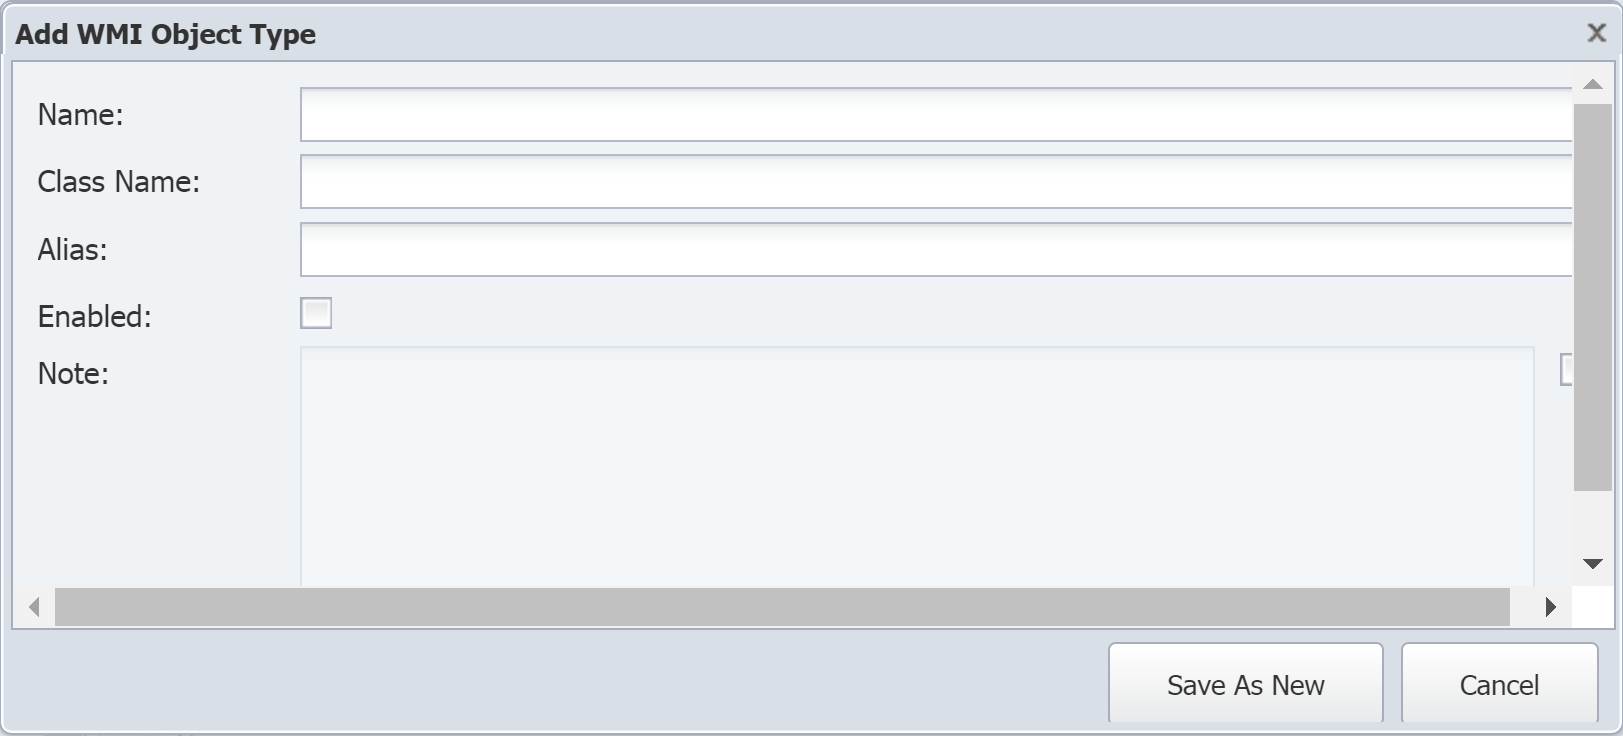
Click Add to display the Add WMI Object Type pop-up. To edit an existing object type, select the object type and click
 under Actions.
-
In the Name field, enter the object type name.
-
In the Class Name field, enter the object type class name.
-
In the Alias field, enter an alias for the object type.
-
Select the Enabled check box to enable the WMI plugin to poll the indicator types for this object type.
-
Select the check box for the Note field to enable it for editing. Enter any additional information you would like to include.
-
Click Save As New.
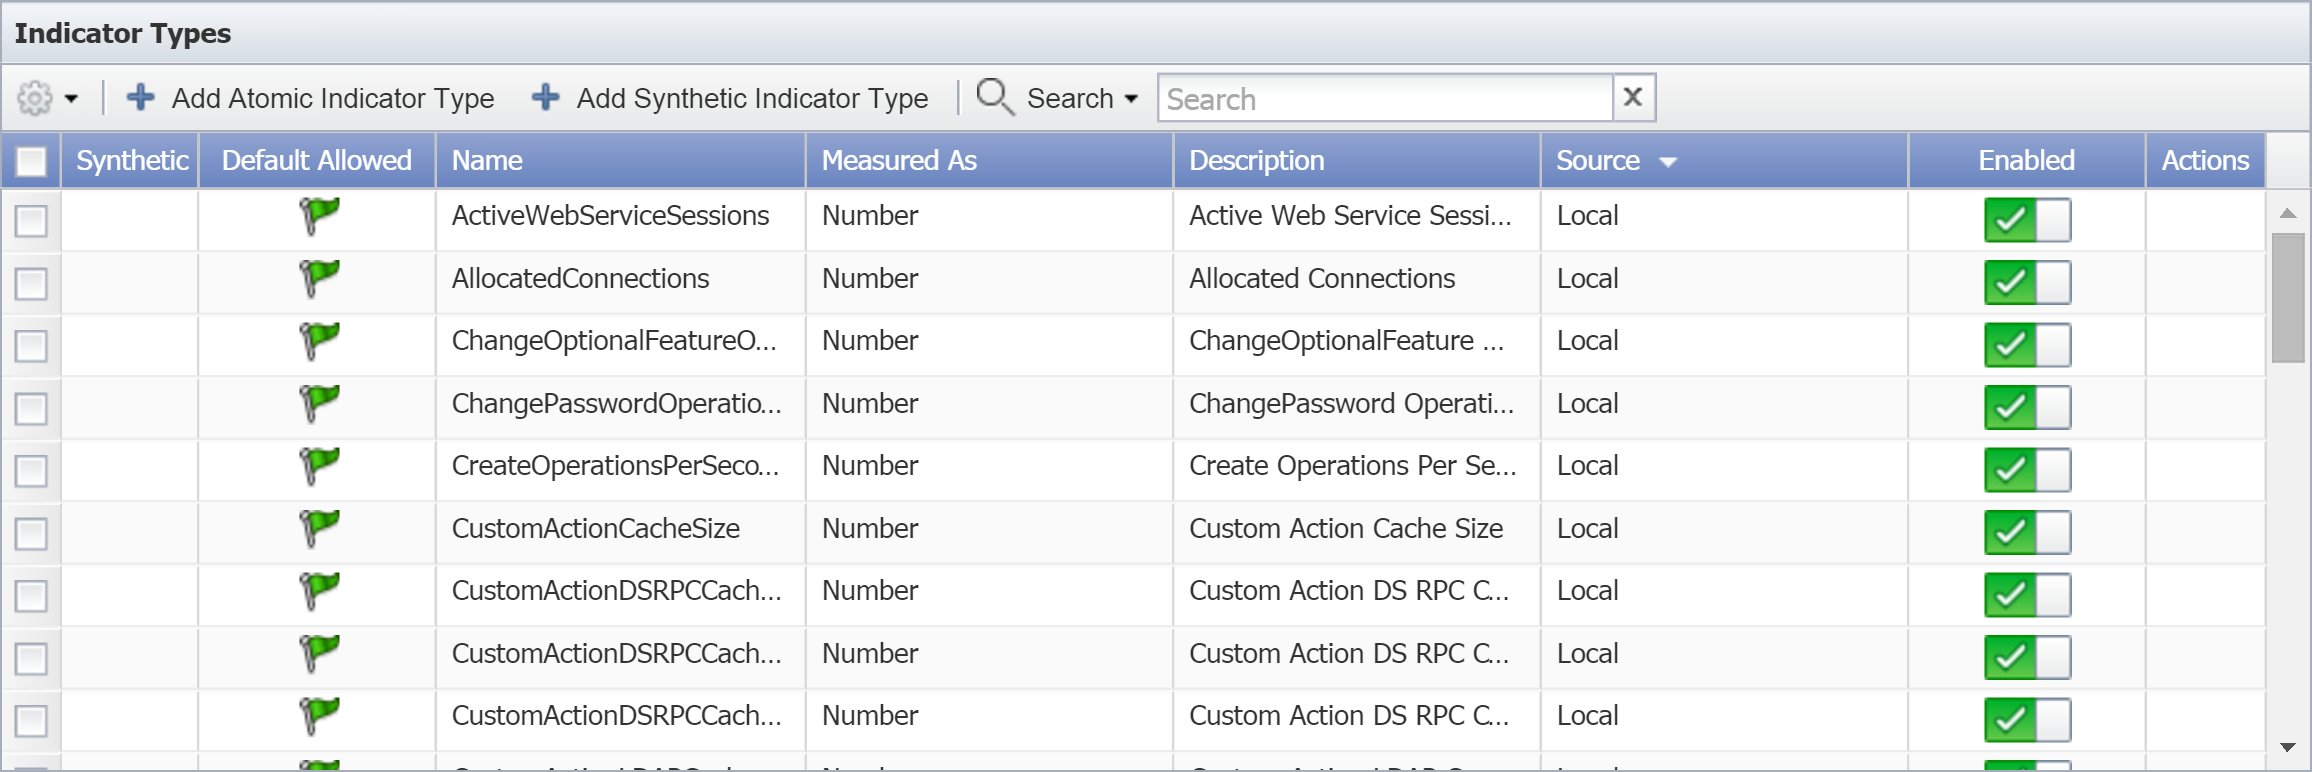
Manage WMI Indicator Types
Indicator types define the kind of metrics an object can have. This section provides steps on how to add / edit indicator types. Every indicator of an object needs an indicator type. SevOne NMS plugins such as, SNMP, WMI, etc., use indicator types to collect data from indicators on the objects that you monitor. For example, the WMI DHCP Server object type has an indicator type to measure how many packets are received per second.
There are two categories of indicator types.
-
Atomic indicator types are measured directly by plugins.
-
Synthetic indicator types calculate values based on the values resulting from other indicator types.
WMI Atomic Indicator Types
Perform the following steps on the Object Types page to add / edit WMI atomic indicator types.
-
In the Object Types hierarchy on the left, select the object type that you would like to create an indicator type for.
-
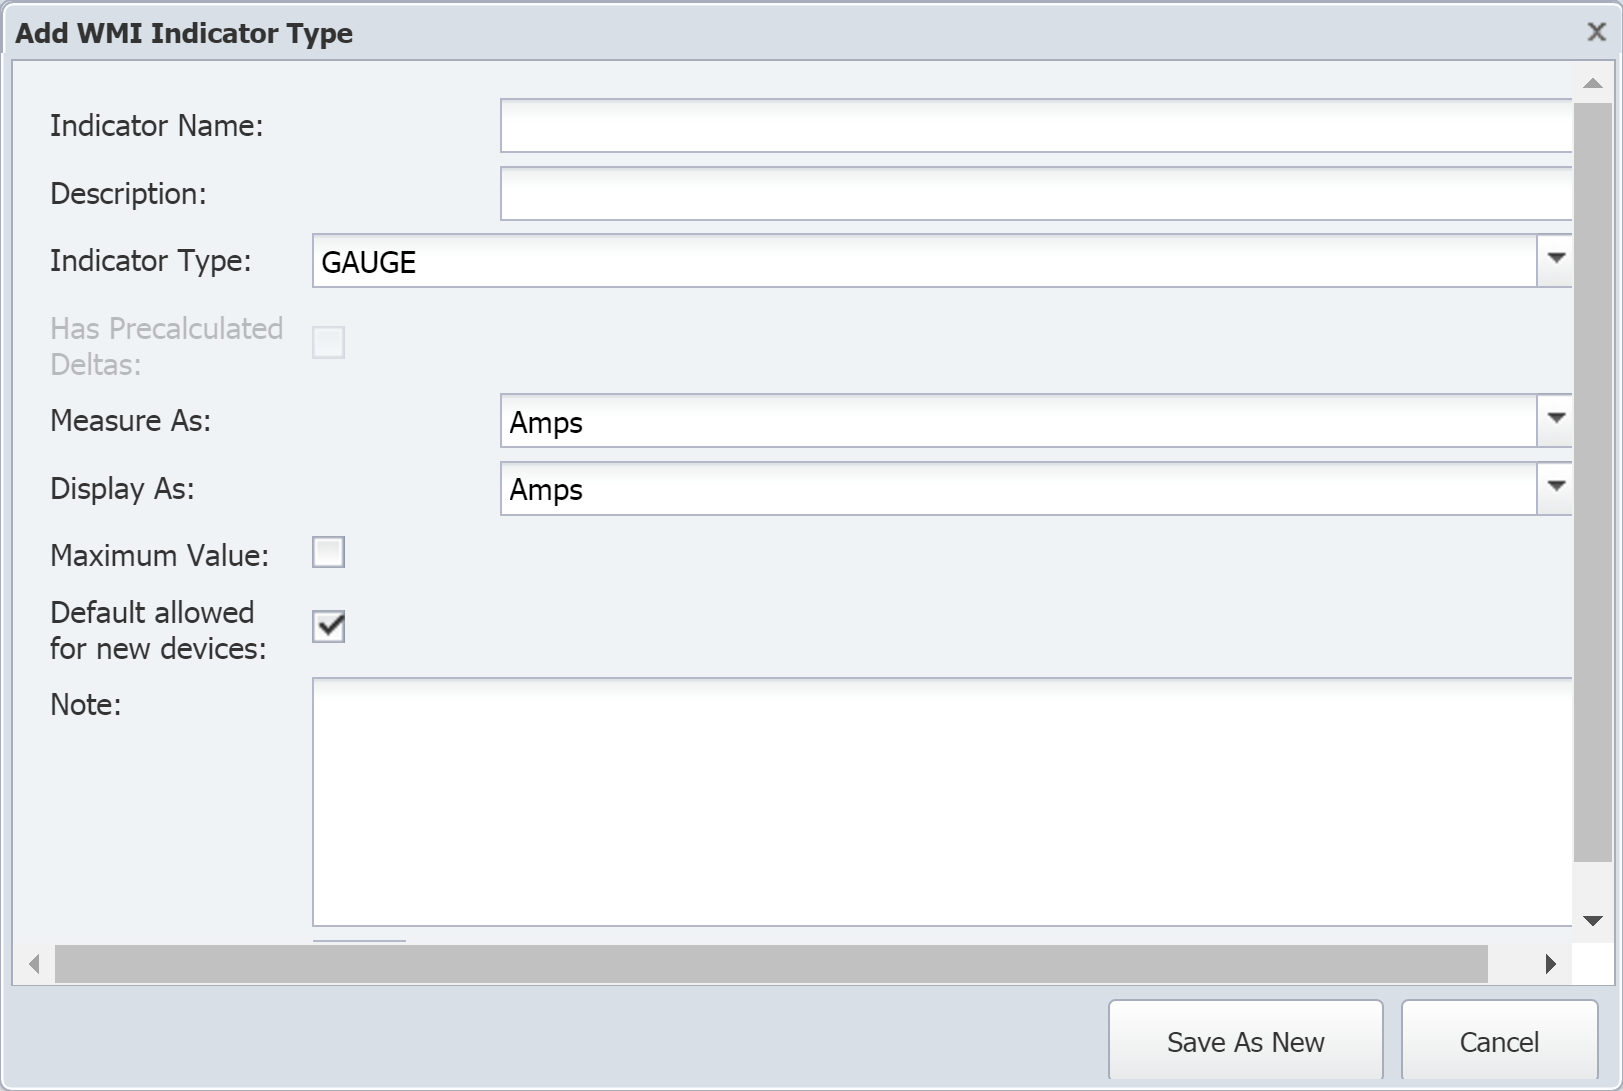
On the right side of the page, under Indicator Types, click Add Atomic Indicator Type to display the Add WMI Indicator Type pop-up. To edit an existing indicator type, select the indicator type and click
under Actions.
-
In the Indicator Name field, enter the name of the indicator type.
-
In the Description field, enter the name to display.
You will see the indicator description displayed in reports and elsewhere in the user interface. When creating the indicator type description, please keep this in mind. For example, when you look at an object's indicators, you will notice that they are listed based on the first word of their description. If you have the two indicators Queued Bytes and Transmitted Bytes, they may not appear together. However, if you use the descriptions Bytes Queued and Bytes Transmitted, the indicators will appear in close proximity to each other.
-
Click the Indicator Type drop-down and select one of the following options.
-
GAUGE - for indicators that have specific values when polled.
-
COUNTER32 - for 32-bit indicators that continue to increment. If you select this option, you can select the Has Precalculated Deltas check box to total the delta/differences between polls. This provides the ability to graph things like the number of errors in a day, for example.
-
COUNTER64 - for 64-bit indicators that continue to increment. If you select this option, you can select the Has Precalculated Deltas check box.
-
-
Click the Measure As drop-down and select a unit to measure data as bits, bytes, percent, seconds, etc., for example.
-
Click the Display As drop-down and select a unit to display results as. The options available here are based on your selection for the Measure As field.
-
Select the Maximum Value check box to indicate that the indicator type has a maximum value.
-
Select the Default allowed for new devices check box to have the plugin poll this indicator type by default when the object type is enabled and when the plugin for a device is enabled.
-
In the Note field, enter any additional information you would like to include.
-
Click Save As New.
WMI Synthetic Indicator Types
Using synthetic indicator types, you can create your own key performance indicators (KPIs) even when those KPIs such as, Percent Usage, Percent Loss, Percent Error, and Percent Idle, do not exist on a device. For example, let's say that you want to monitor voice gateways to find out which primary rate interface (PRI) is getting the most usage. Typical poll metrics can tell you the busy status of individual bearer channels, or B channels, but they cannot tell you the sum of the statuses for all the B channels. This makes it difficult to find out the total usage of a particular PRI.
In SevOne NMS, you can create a single indicator type that tells you what percentage of a PRI is being used.
You will need the following.
-
An existing indicator type that tells you how many busy B channels there are for a given PRI. Let's call this BChannelsBusy.
-
The total number of B channels for our PRI. That number is 23.
Using this information, a synthetic indicator type can be created with an expression to perform the following calculation.
(BChannelsBusy*23)/100
Now you have a new indicator type, a synthetic indicator type, that tells you what percentage of the PRI is being used. There is no need to look up the number of busy B channels and perform calculations manually.
Since synthetic indicator types are based on existing indicator types, either atomic or synthetic, there must already be at least one existing indicator type in order for you to create a new synthetic indicator type.
Perform the following steps on the Object Types page to add / edit WMI synthetic indicator types.
-
In the Object Types hierarchy on the left, click on an object type to display its indicator types on the right. If the object type does not have any indicator types, the Add Synthetic Indicator Type button will not appear.
-
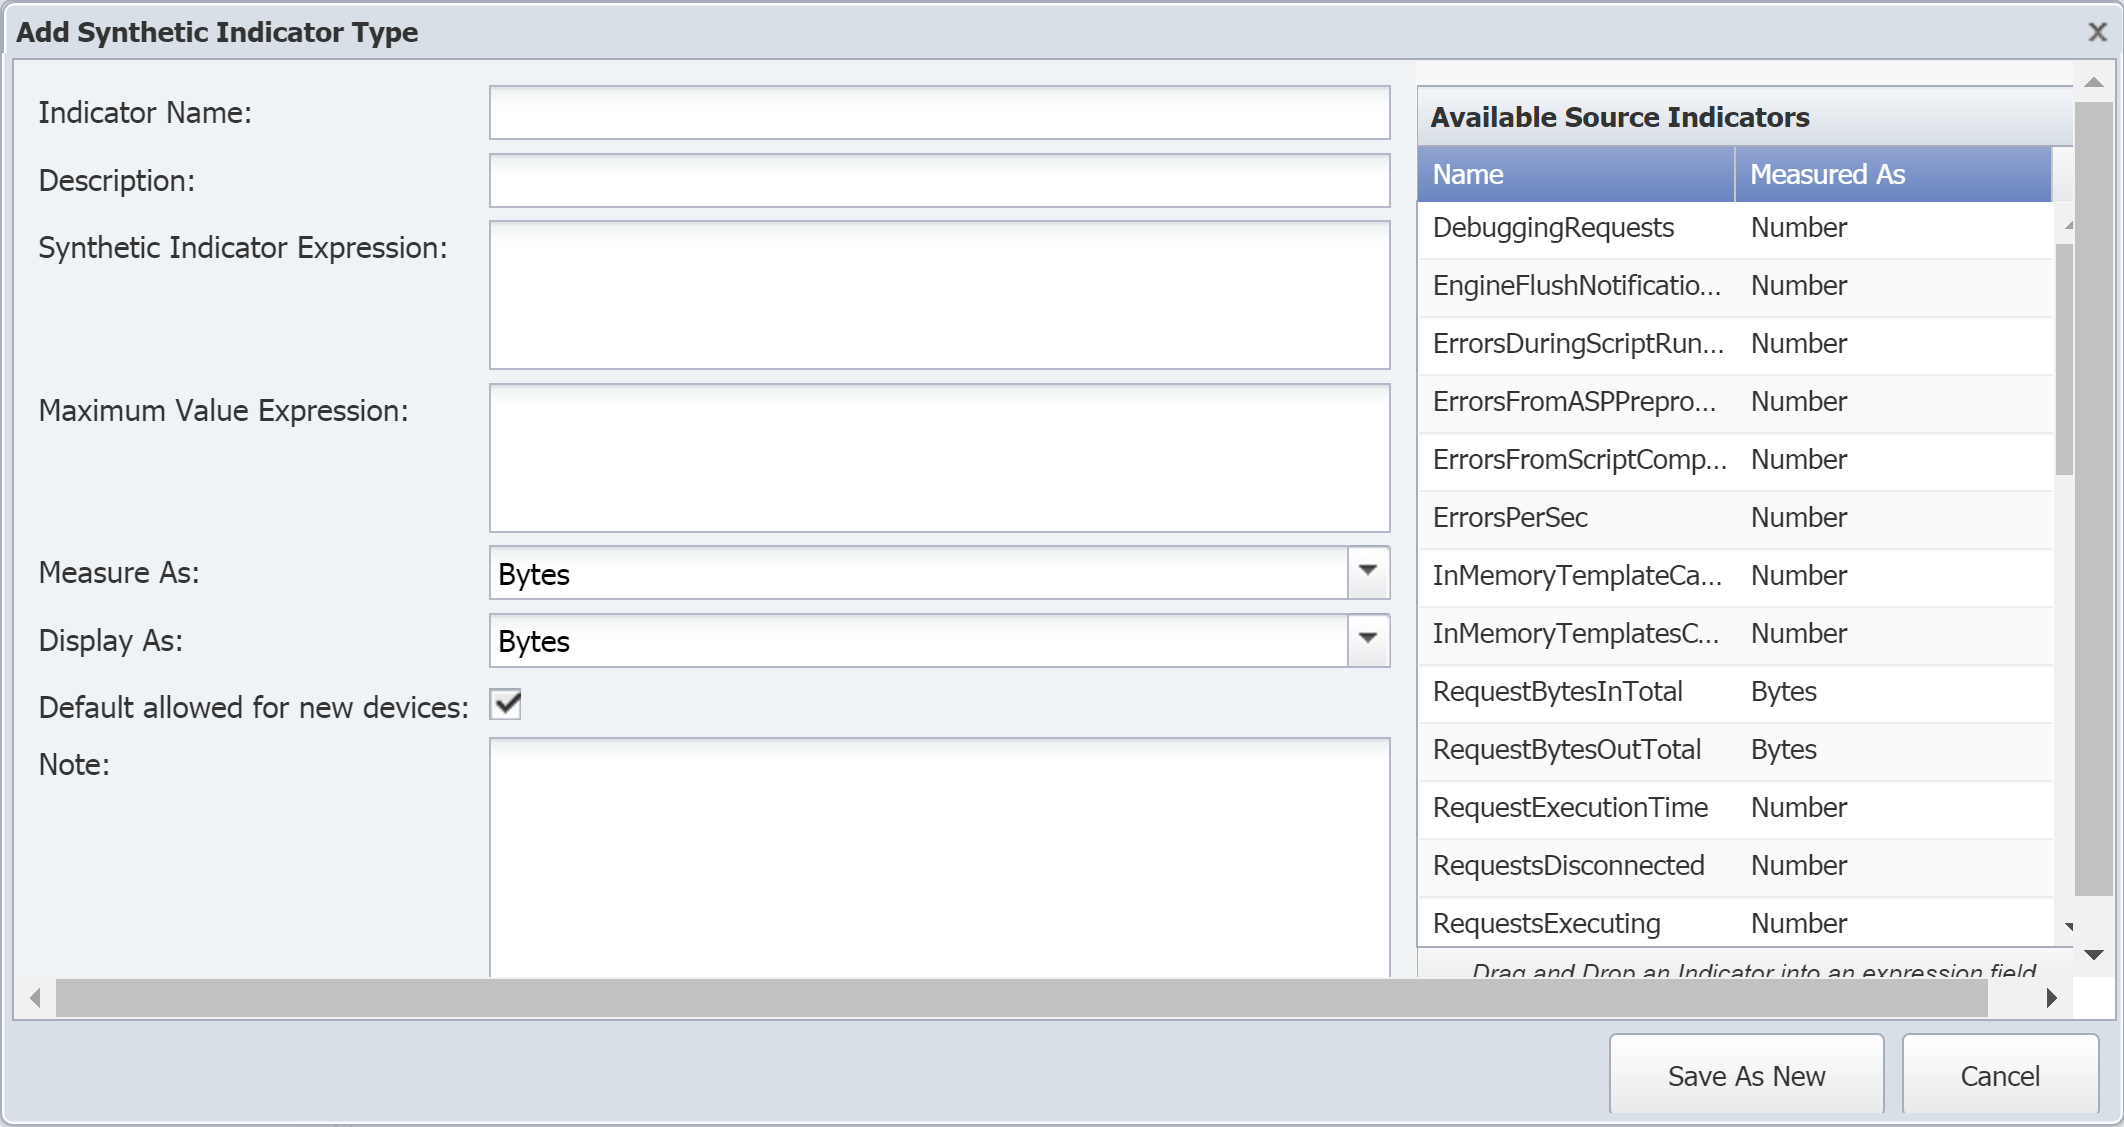
Click Add Synthetic Indicator Type to display the Add Synthetic Indicator Type pop-up. To edit an existing synthetic indicator type, select the indicator type and click
under Actions.
-
In the Indicator Name field, enter the name of the synthetic indicator type.
-
In the Description field, enter the name to display.
You will see the indicator description displayed in reports and elsewhere in the user interface. When creating the indicator type description, please keep this in mind. For example, when you look at an object's indicators, you will notice that they are listed based on the first word of their description. If you have the two indicators Queued Bytes and Transmitted Bytes, they may not appear together. However, if you use the descriptions Bytes Queued and Bytes Transmitted, the indicators will appear in close proximity to each other.
-
The Synthetic Indicator Expression field is where you define the calculation. Perform the following actions to create the expression for this field.
A red border around the Synthetic Indicator Expression field indicates that your calculation is invalid. This also means that your graph results will be incorrect.
-
In the Available Source Indicators field on the right, select an indicator type to use in the expression. Drag and drop it into the Synthetic Indicator Expression field.
The Available Source Indicators field contains the indicator types for the object type that you selected a few steps ago.
-
Enter the applicable operators to formulate your calculation in the Synthetic Indicator Expression field. For a list of available operators, see Acceptable Operators below.
-
Drag any additional indicator types from the Available Source Indicators field and enter additional mathematical symbols to complete the expression in the Synthetic Indicator Expression field.
-
-
The Maximum Value Expression field lets you define a maximum value calculation for the indicator type. Perform the following actions to create the expression for this field.
-
In the Available Source Indicators field on the right, select an indicator type to use in the expression. Drag and drop it into the Maximum Value Expression field.
-
Next, enter the applicable operators to formulate your calculation in the Maximum Value Expression field. For a list of available operators, see Acceptable Operators below.
-
Drag any additional indicator types from the Available Source Indicators field and enter additional mathematical symbols to complete the expression in the Maximum Value Expression field.
-
-
Click the Measure As drop-down and select a unit to measure data as–for example, bits, bytes, percent, seconds, etc.
-
Click the Display As drop-down and select a unit to display results as. The options available here are based on your selection for the Measure As field.
-
Select the Default allowed for new devices check box to have the plugin poll this indicator type by default when the object type is enabled and when the plugin for a device is enabled.
-
In the Note field, enter any additional information you would like to include.
-
Click Save As New.
Acceptable Operators
Your expression formula can include the following characters.
|
Operator |
Description |
|
+ |
add |
|
- |
subtract |
|
* |
multiply |
|
/ |
divide |
|
&& |
logical AND |
|
|| |
logical OR |
|
<= |
less than or equal to |
|
>= |
greater than or equal to |
|
!= |
not equal to |
|
== |
equal to |
|
> |
greater than |
|
< |
less than |
|
^ |
raise x to the power of y |
|
% |
modulus |
|
?: |
if-then-else |
|
isnan |
is Not a Number. |
|
isValid |
is valid. |
|
useIfValid |
use if valid. |
If your calculation results in either of the following invalid values, there will be a gap in your graph.
-
Not a Number (NAN)
-
Infinity (+/-INF).
The following describes how SevOne NMS attempts to prevent invalid values. These are listed in the order that they are processed.
-
Zero divided by zero results in NAN.
-
Any positive value divided by zero results in +INF.
-
Any negative value divided by zero results in -INF.
-
Zero multiplied by +/-INF results in NAN.
-
Any value added to, subtracted from, multiplied by, divided by, or divided from NAN results in NAN.
-
Any value compared to NAN (<, <=, ==, >=, >) results in 0. NAN != NAN.
-
Any value compared to +INF is less than +INF, except that +INF == +INF
-
Any value compared to -INF is greater than -INF, except that -INF == -INF
-
Any value added to or subtracted from +INF results in +INF
-
Any positive value multiplied by +/-INF results in +/-INF
-
Any value divided by +/-INF results in 0
For optimal performance, the following is recommended.
-
Always make sure that communication is possible between SevOne NMS and the proxy server.
-
Always make sure that communication is possible between the proxy server and all monitored WMI servers.
-
Configuring Authentication and Impersonation may be tricky. Try a few combinations when attempting to discover new WMI servers. As a general rule, when it works for one WMI server, it will likely work for the rest of them.
Terms & References
Terms
|
Common Information Model (CIM) |
An open standard that provides a schema for organizing managed objects on a network. |
|
Distributed Component Object Model (DCOM) |
A Microsoft technology that enables software to communicate across a network. |
|
Distributed Management Task Force (DMTF) |
An organization that develops and implements standards for simplified management of network technologies. |
|
Windows Management Instrumentation (WMI) |
A collection of tools and extensions that enable both local and remote management of Windows-based systems and applications. |
References
Win32 Provider - Microsoft page for the Win32 Provider component. (http://msdn.microsoft.com/en-us/library/aa394388(v=vs.85).aspx)