Table of Contents (Start)
- Topics
- Introducing SevOne
- Login
- Startup Wizard
- Dashboard
- Global Search - Advanced Search
- Report Manager
- Report Attachment Wizard
- Report Properties
- Report Interactions
- Instant Graphs
- TopN Reports
- Alerts
- Alert Archives
- Alert Summary
- Instant Status
- Status Map Manager
- Edit Maps
- View Maps
- FlowFalcon Reports
- NBAR Reports
- Logged Traps
- Unknown Traps
- Trap Event Editor
- Trap Destinations
- Trap Destination Associations
- Policy Browser
- Create and Edit Policies
- Webhook Definition Manager
- Threshold Browser
- Create and Edit Thresholds
- Probe Manager
- Discovery Manager
- Device Manager
- New Device
- Edit Device
- Object Manager
- High Frequency Poller
- Device Summary
- Device Mover
- Device Groups
- Object Groups
- Object Summary
- Object Rules
- VMware Browser
- AWS Plugin
- Azure Plugin (Public Preview)
- Calculation Plugin
- Database Manager
- Deferred Data Plugin
- DNS Plugin
- HTTP Plugin
- ICMP Plugin
- IP SLA Plugin
- JMX Plugin
- NAM
- NBAR Plugin
- Portshaker Plugin
- Process Plugin
- Proxy Ping Plugin
- SDWAN Plugin
- SNMP Plugin
- VMware Plugin
- Web Status Plugin
- WMI Plugin
- xStats Plugin
- Indicator Type Maps
- Device Types
- Object Types
- Object Subtype Manager
- Calculation Editor
- xStats Source Manager
- User Role Manager
- User Manager
- Session Manager
- Authentication Settings
- Preferences
- Cluster Manager
- Maintenance Windows
- Processes and Logs
- Metadata Schema
- Baseline Manager
- FlowFalcon View Editor
- Map Flow Objects
- FlowFalcon Views
- Flow Rules
- Flow Interface Manager
- MPLS Flow Mapping
- Network Segment Manager
- Flow Protocols and Services
- xStats Log Viewer
- SNMP Walk
- SNMP OID Browser
- MIB Manager
- Work Hours
- Administrative Messages
- Enable Flow Technologies
- Enable JMX
- Enable NBAR
- Enable SNMP
- Enable Web Status
- Enable WMI
- IP SLA
- SNMP
- SevOne Data Publisher
- Quality of Service
- Perl Regular Expressions
- Trap Revisions
- Integrate SevOne NMS With Other Applications
- Email Tips and Tricks
- SevOne NMS PHP Statistics
- SevOne NMS Usage Statistics
- Glossary and Concepts
- Map Flow Devices
- Trap v3 Receiver
- Guides
- Quick Start Guides
- AWS Quick Start Guide
- Azure Quick Start Guide (Public Preview)
- Data Miner Quick Start Guide
- Flow Quick Start Guide
- Group Aggregated Indicators Quick Start Guide
- IP SLA Quick Start Guide
- JMX Quick Start Guide
- Metadata Quick Start Guide
- RESTful API Quick Start Guide
- Self-monitoring Quick Start Guide
- SevOne NMS Admin Notifications Quick Start Guide
- SNMP Quick Start Guide
- Synthetic Indicator Types Quick Start Guide
- Topology Quick Start Guide
- VMware Quick Start Guide
- Web Status Quick Start Guide
- WMI Quick Start Guide
- xStats Quick Start Guide
- xStats Adapter - Accedian Vision EMS (TM) Quick Start Guide
- Deployment Guides
- Automated Build / Rebuild (Customer) Instructions
- Generate a Self-Signed Certificate or a Certificate Signing Request
- SevOne Best Practices Guide - Cluster, Peer, and HSA
- SevOne Data Platform Security Guide
- SevOne NMS Implementation Guide
- SevOne NMS Installation Guide - Virtual Appliance
- SevOne NMS Advanced Network Configuration Guide
- SevOne NMS Installation Guide
- SevOne NMS Port Number Requirements Guide
- SevOne NMS Upgrade Process Guide
- SevOne Physical Appliance Pre-Build BIOS and RAID Configuration Guide
- SevOne SAML Single Sign-On Setup Guide
- Cloud Platforms
- Other Guides
- Quick Start Guides
Topology Quick Start Guide
SevOne Documentation
All documentation is available from the IBM SevOne Support customer portal.
© Copyright International Business Machines Corporation 2024.
All right, title, and interest in and to the software and documentation are and shall remain the exclusive property of IBM and its respective licensors. No part of this document may be reproduced by any means nor modified, decompiled, disassembled, published or distributed, in whole or in part, or translated to any electronic medium or other means without the written consent of IBM.
IN NO EVENT SHALL IBM, ITS SUPPLIERS, NOR ITS LICENSORS BE LIABLE FOR ANY DAMAGES, WHETHER ARISING IN TORT, CONTRACT OR ANY OTHER LEGAL THEORY EVEN IF IBM HAS BEEN ADVISED OF THE POSSIBILITY OF SUCH DAMAGES, AND IBM DISCLAIMS ALL WARRANTIES, CONDITIONS OR OTHER TERMS, EXPRESS OR IMPLIED, STATUTORY OR OTHERWISE, ON SOFTWARE AND DOCUMENTATION FURNISHED HEREUNDER INCLUDING WITHOUT LIMITATION THE WARRANTIES OF DESIGN, MERCHANTABILITY OR FITNESS FOR A PARTICULAR PURPOSE, AND NONINFRINGEMENT.
IBM, the IBM logo, and SevOne are trademarks or registered trademarks of International Business Machines Corporation, in the United States and/or other countries. Other product and service names might be trademarks of IBM or other companies. A current list of IBM trademarks is available on ibm.com/trademark.
About
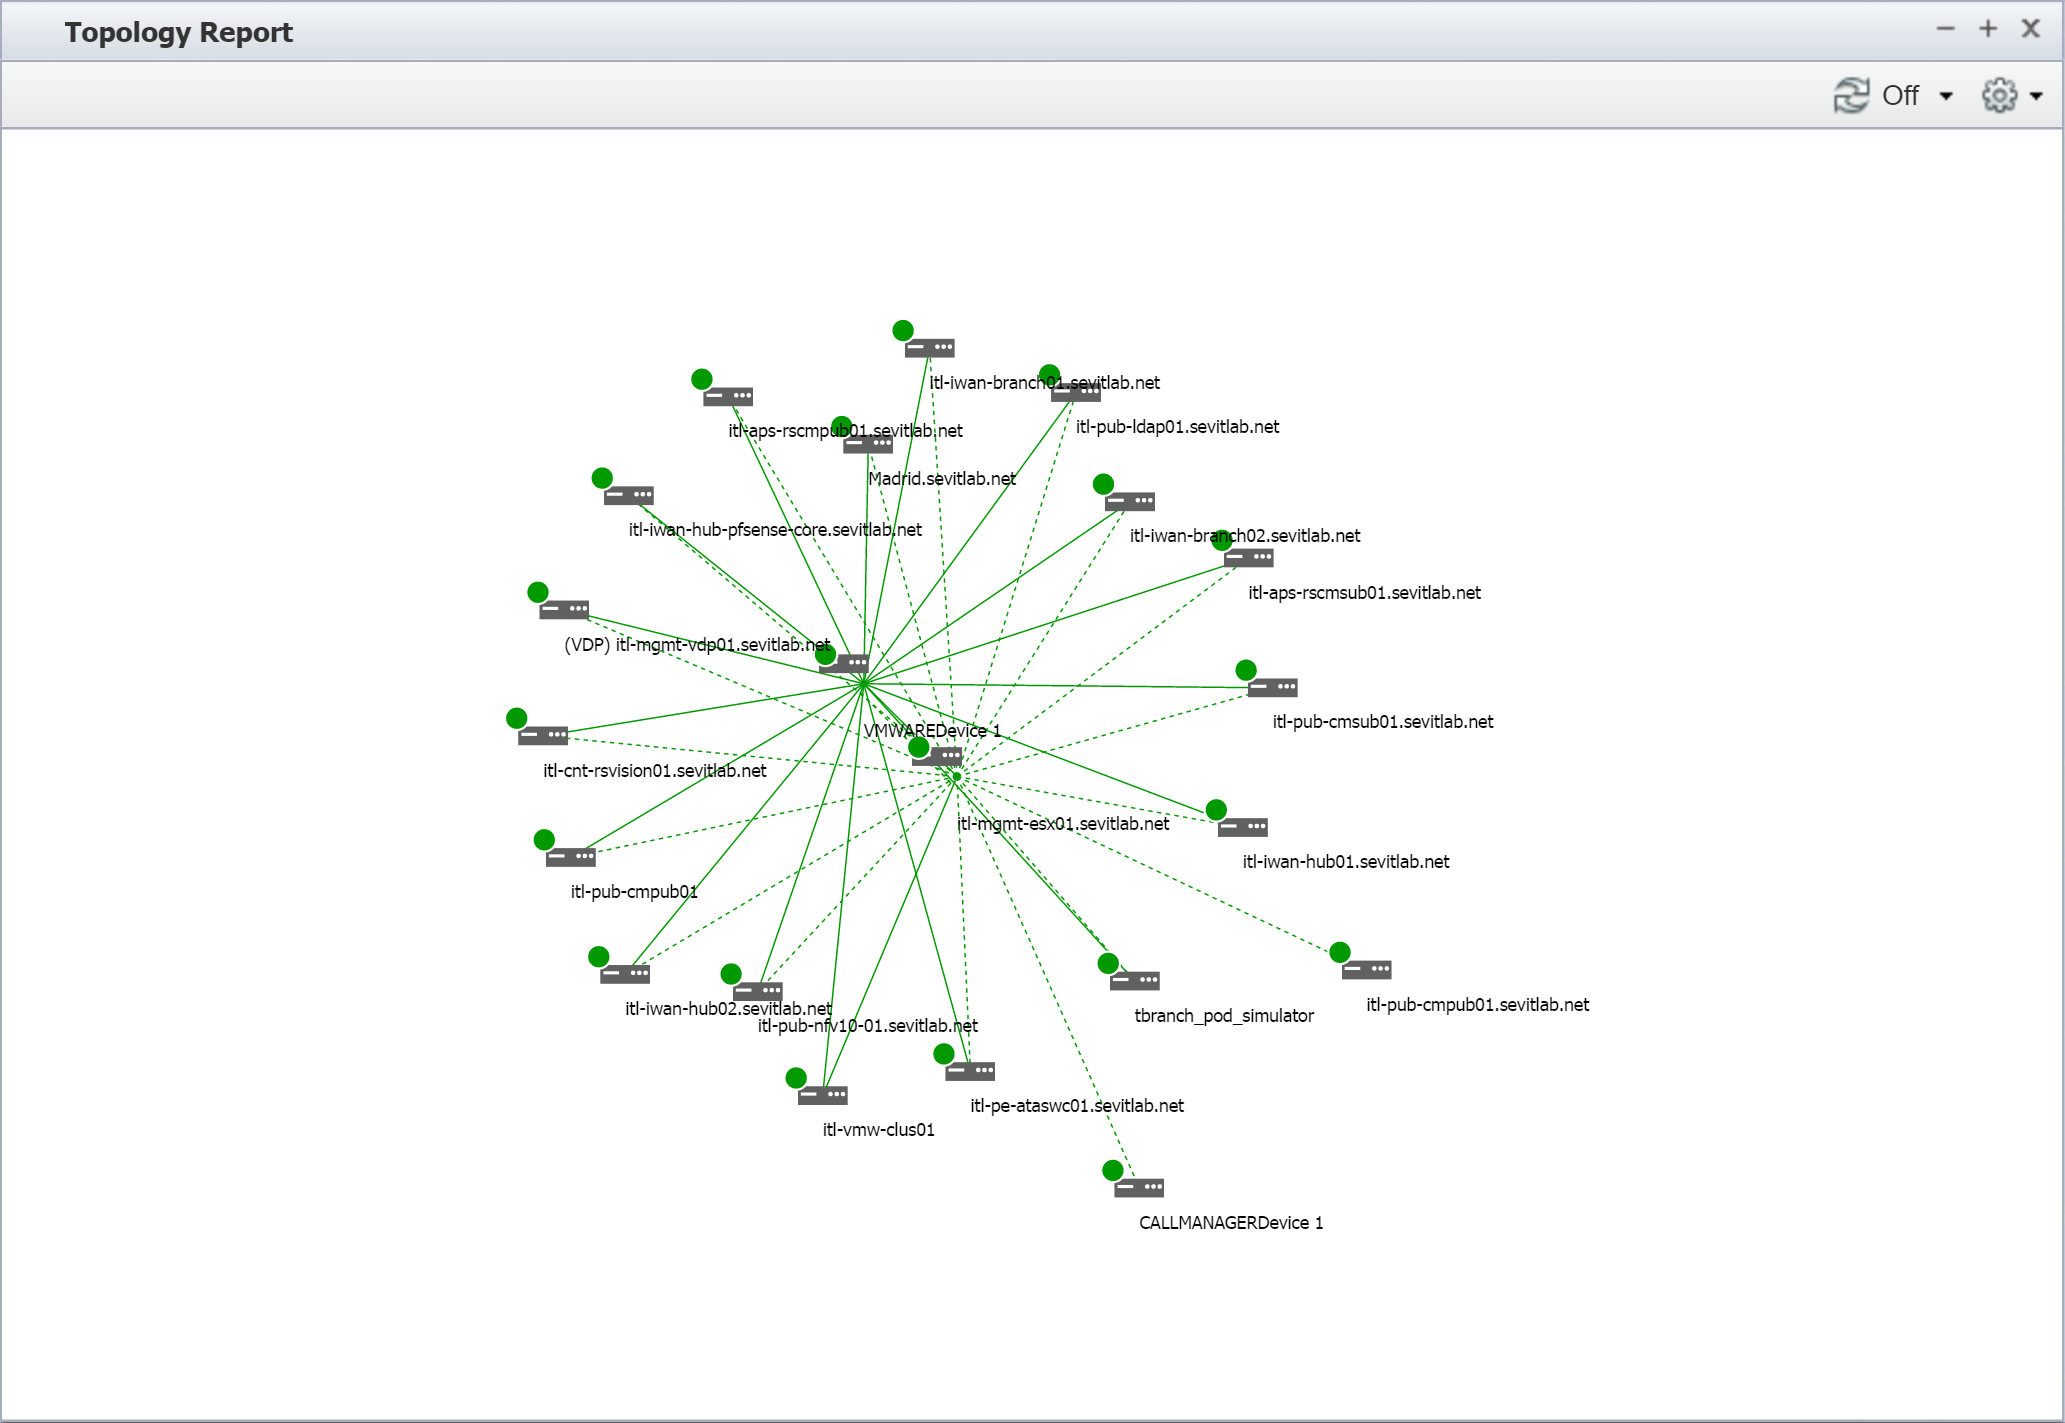
SevOne's Topology reports enable you to automatically view the physical, logical, and session connections between devices in your network. This allows you to view portions of your infrastructure within context, which can be helpful when troubleshooting. For example, you can determine the impact of a device being down by seeing which devices, applications, and services are downstream of that device.
Let's look at how topology works. Since each topology source is unique, we are going to use ARP for our example.
For our example, we have two devices, Device A and Device B. Our devices are connected via ARP. When SevOne NMS discovers Device A, discovery walks a MIB on the device for all attached endpoints (ARP table). Discovery looks for a device-object–for example, eth0 on Device B–that has a MAC address stored in metadata. When the matching device-object is found–again, using the example of eth0 on Device B–SevOne's topology creates a half-link between Device A, object Gi1/1 and Device B, object eth0.
Now, let's assume that Device B also has an ARP table that corroborates this connection. When discovery runs on Device B, it finds the same connection in reverse–Device B, object eth0 to Device A, object Gi1/1. When an ARP entry is found, the same process is repeated to return a device-object match for the MAC address of Gi1/1. If the match is returned, topology records the link in the opposite direction, and the link is now considered a full link.
Topology Sources
The following topology source protocols/link types are used to discover inter-device relationships at discovery time.
Backed by SNMP
The following protocols are backed by SNMP.
-
ARP Cache
-
BGP
-
CDP
-
EIGRP
-
IS-IS
-
LLDP
-
MPLS LDP
-
OSPF
-
STP
-
STP Trunk
Other Technologies
SevOne supports additional technologies other than SNMP.
-
Intra Device
-
VMware (Logical)
-
VMware (Physical)
-
User-defined relations - these can be any non-traditional relations defined by the user and can be set via REST API and/or SOAP API.
Configuration Steps
Enable/Disable Discovery of Topology Sources
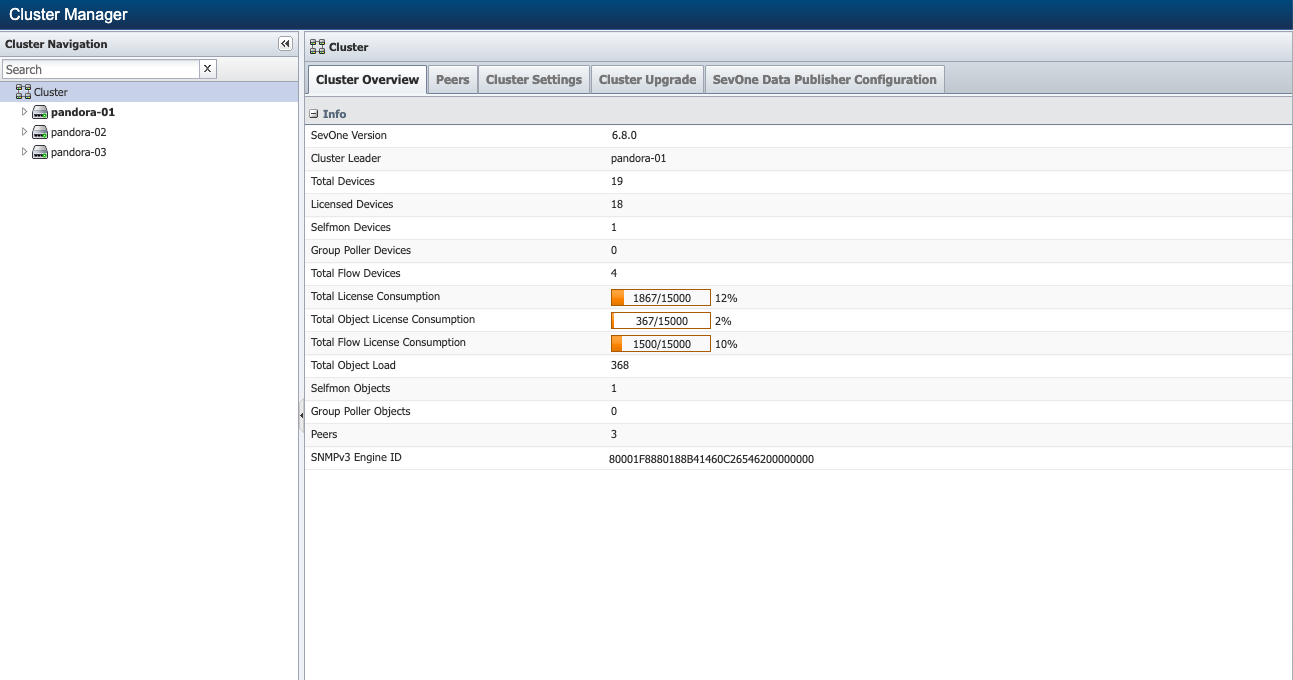
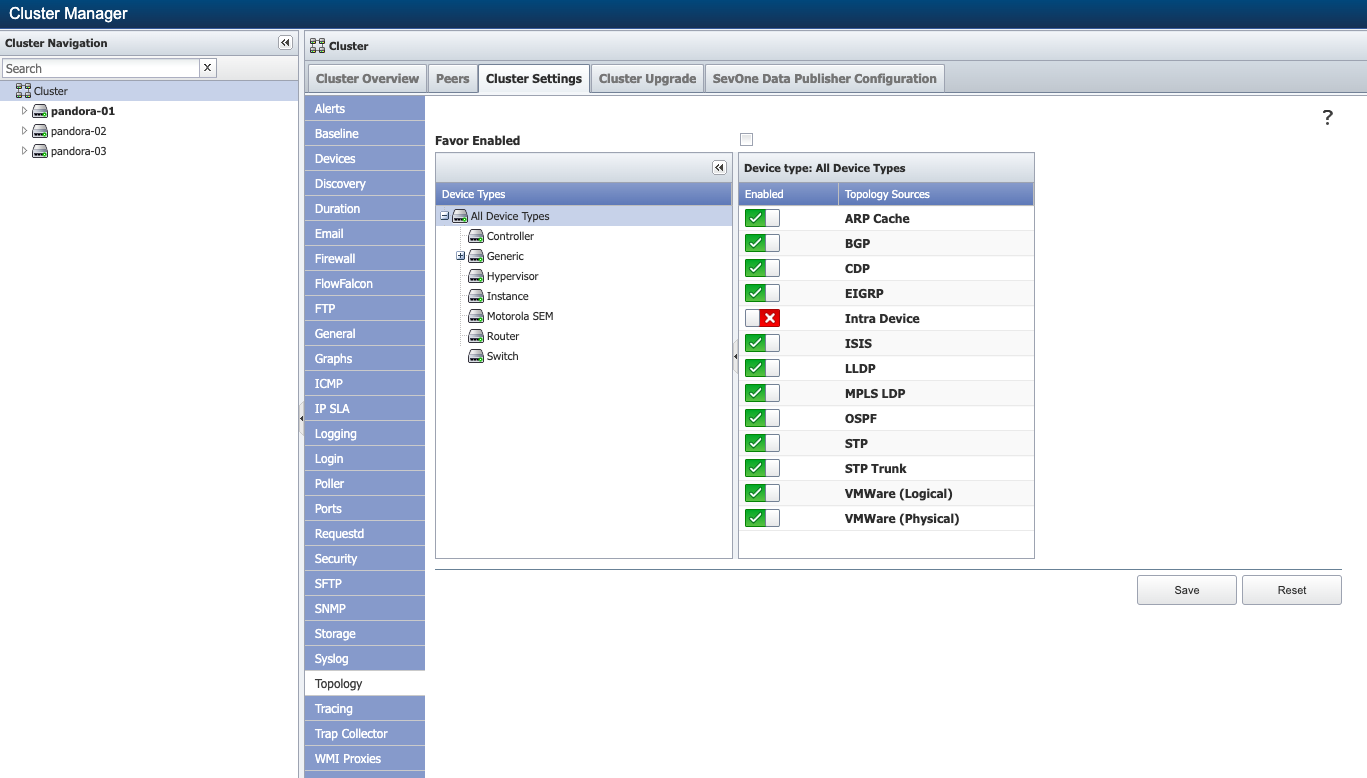
On the Cluster Manager page, you can enable or disable the discovery of topology sources for all device types or specific device types.
With all topology sources enabled, there will be a 10 to 15% performance impact on discovery time. As a result, some devices may take 10 to 15% longer to discover if all topology sources are enabled.
-
From the navigation bar, click Administration and select Cluster Manager.
-
On the right side of the page, select the Cluster Settings tab.
-
On the Cluster Settings tab, scroll down and select the Topology subtab.
-
Under Device Types, select a device type. To enable or disable a topology source for all device types, select All Device Types.
-
In the table on the right (Device type: ...), is a list of the available topology sources and their status for the device type that you selected:
-
 - indicates that discovery of the topology source is enabled for the selected device type.
-
 - indicates that discovery of the topology source is disabled for the selected device type
-
-
Select a topology source. Under Enabled, click on the current status of the topology source to change it from enabled to disabled or vice versa.
-
Click Save to save your changes.
Create a Topology Source Report
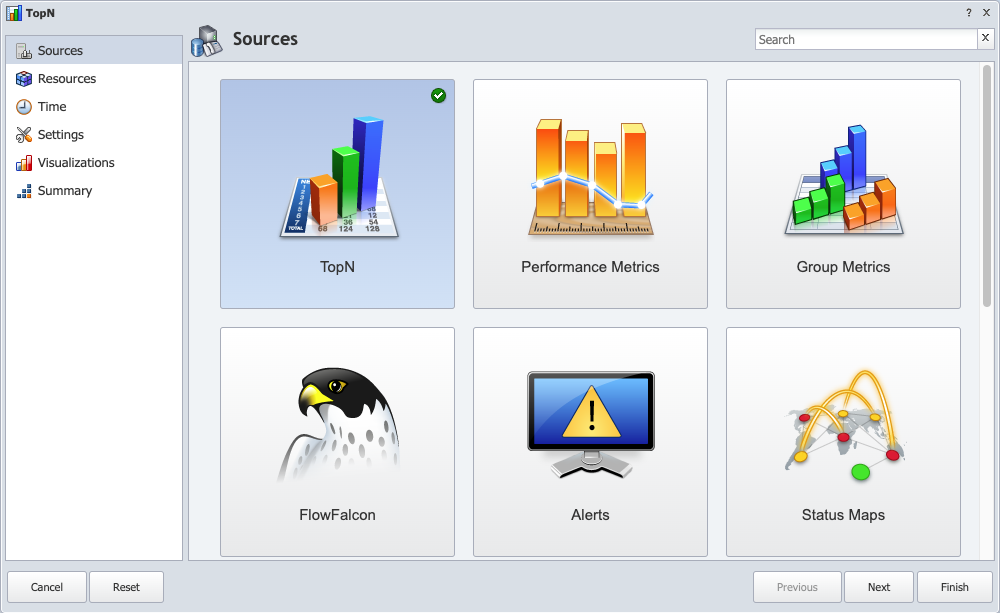
Perform the following steps to create a Topology source report using the Report Attachment Wizard.
Sources
-
From the navigation bar, click Reports and select Create Report.
-
On the Sources page, scroll down and select Topology.
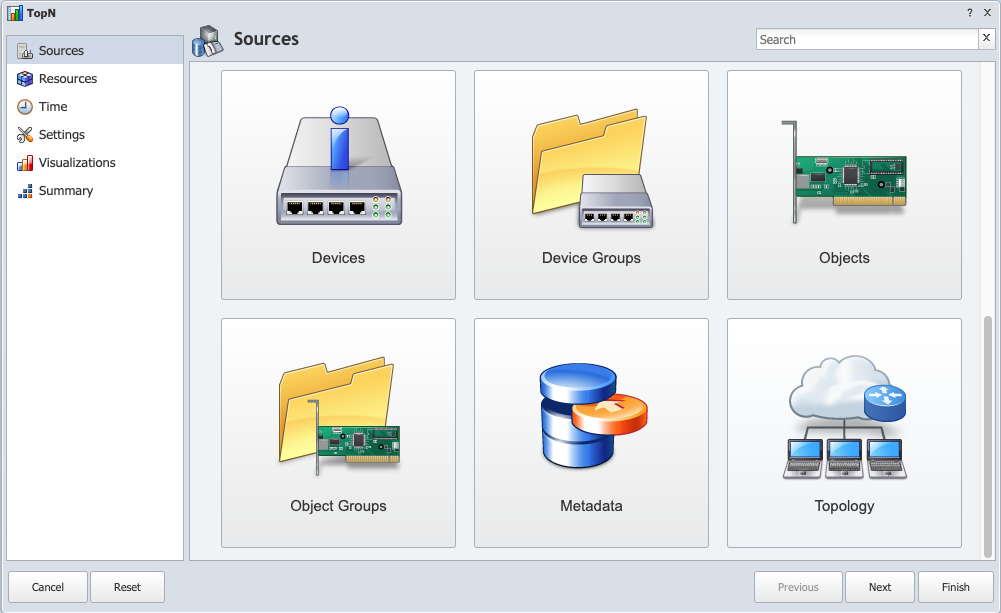
-
Continue to the next subsection, Resources.
Resources
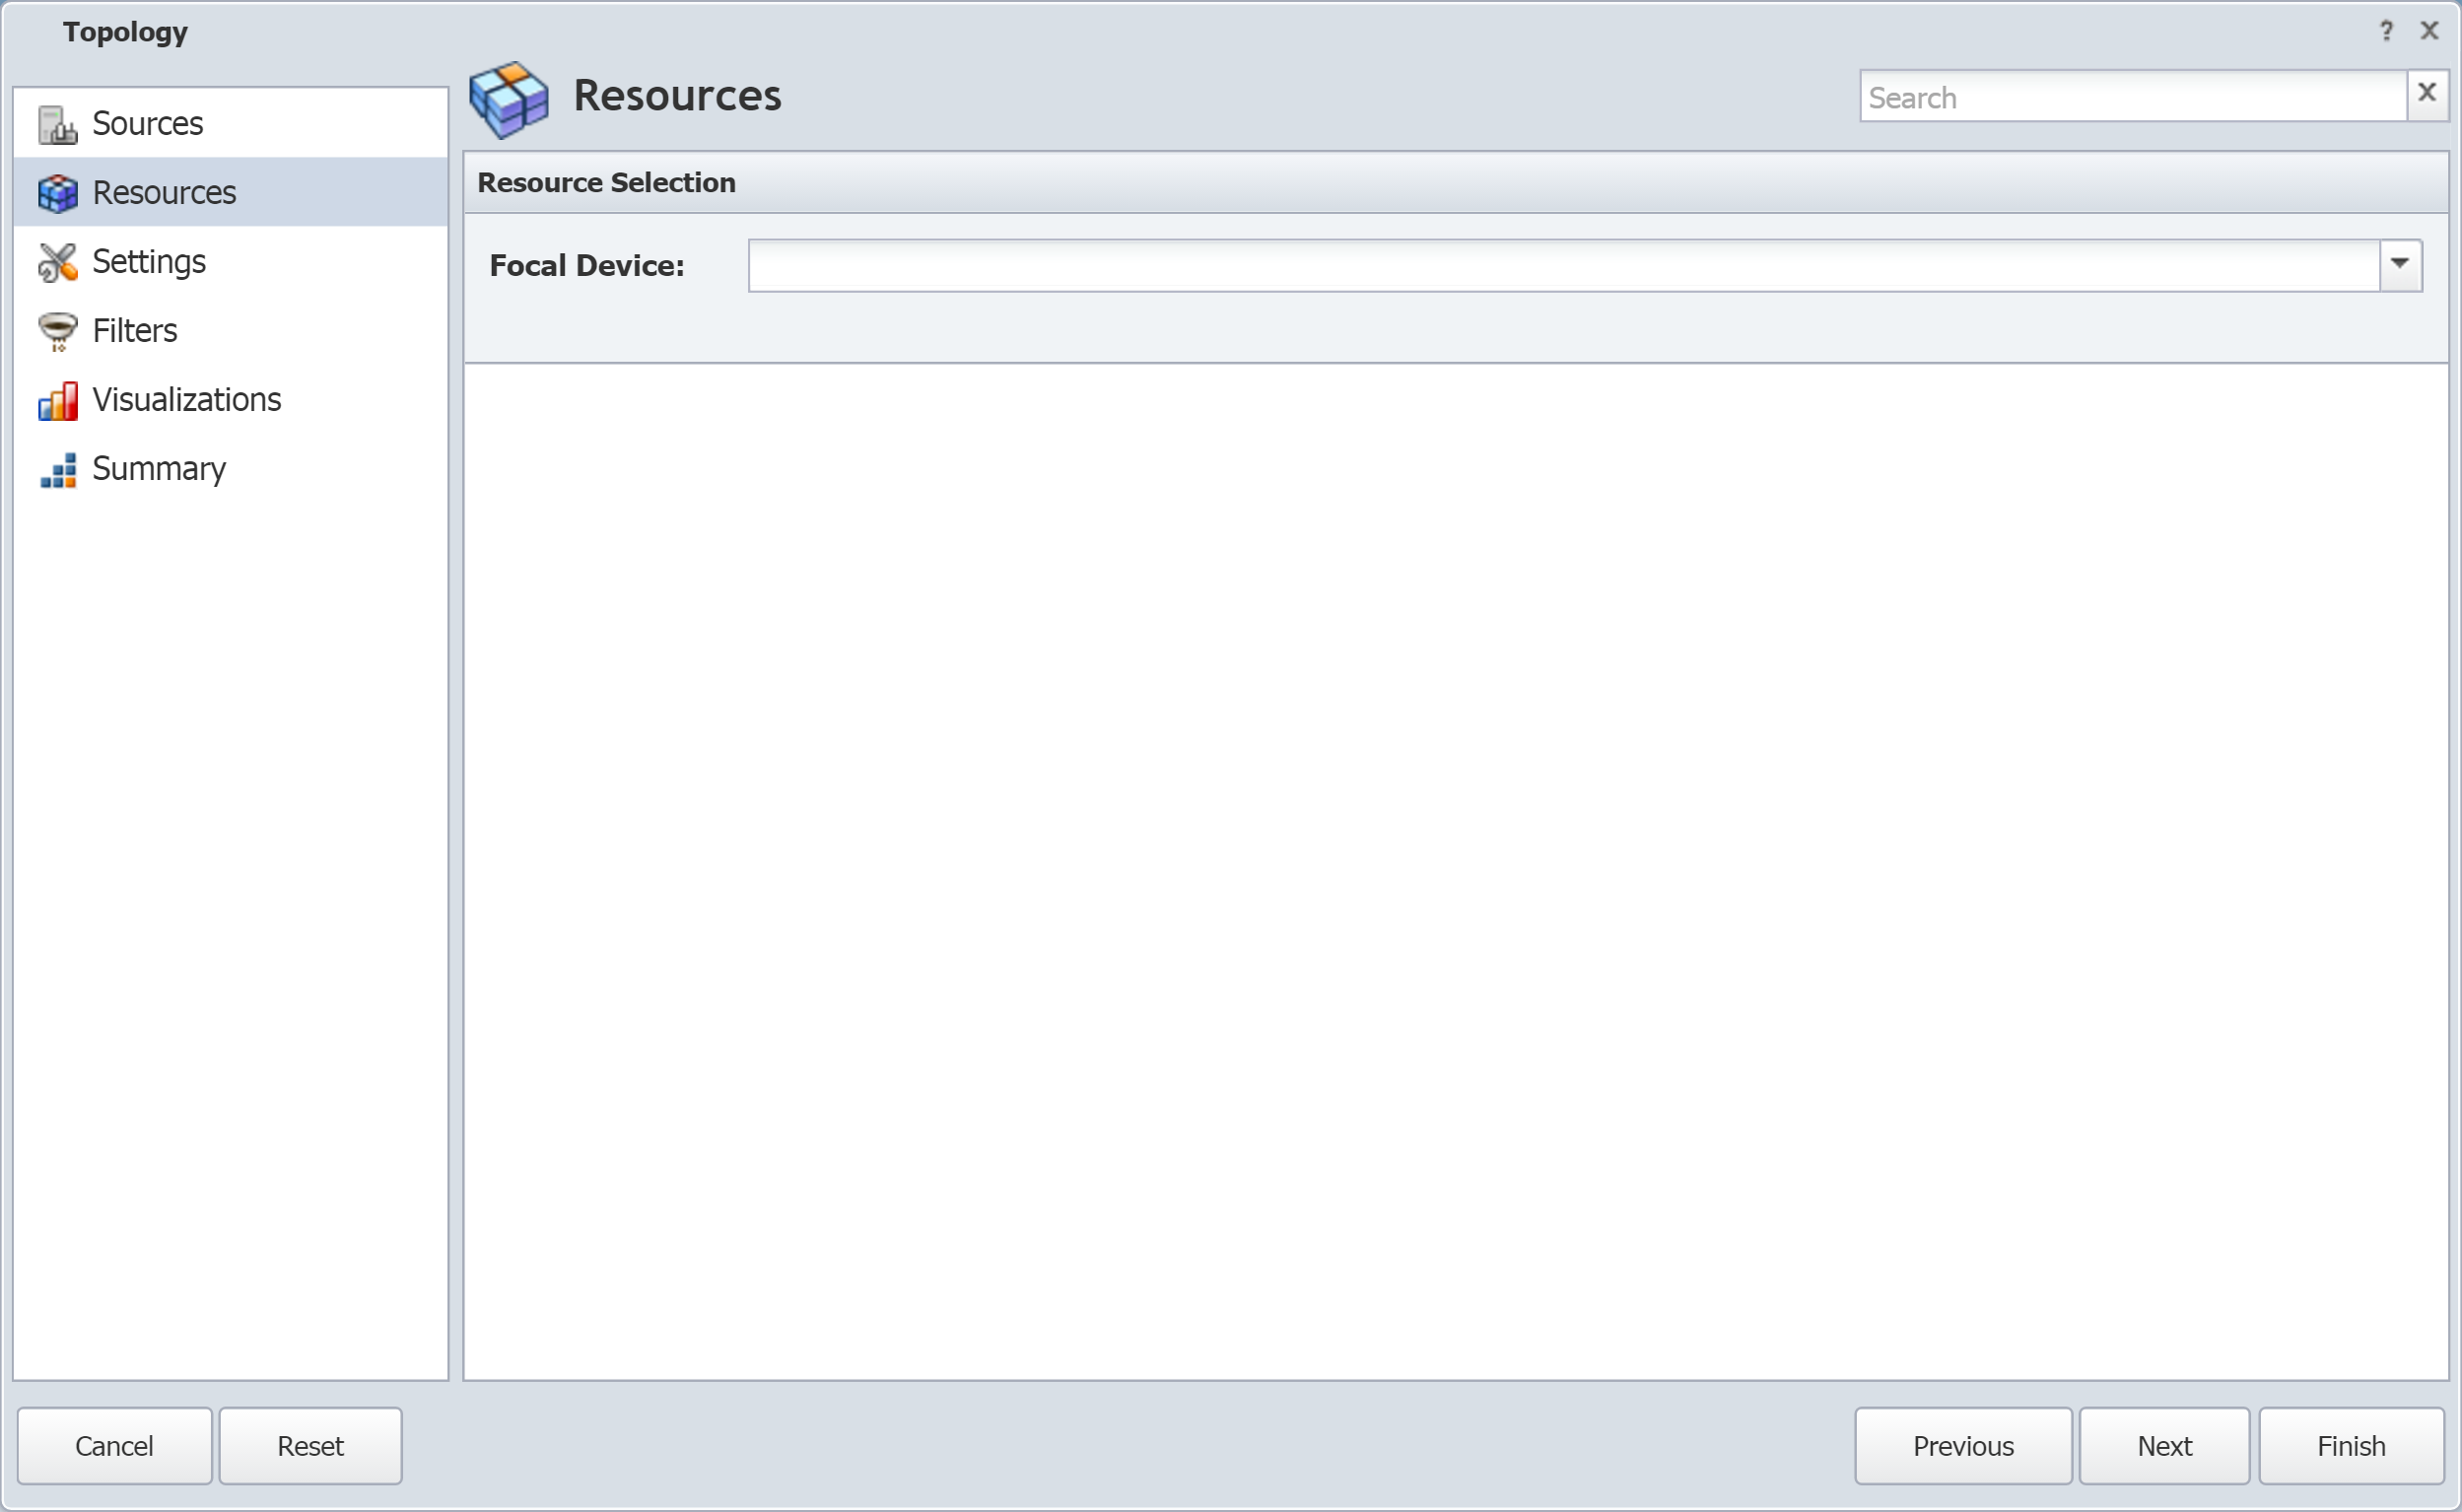
-
Click the Focal Device drop-down and select the focal device for your topology report.
-
Click Next and continue to the next subsection, Settings.
Settings
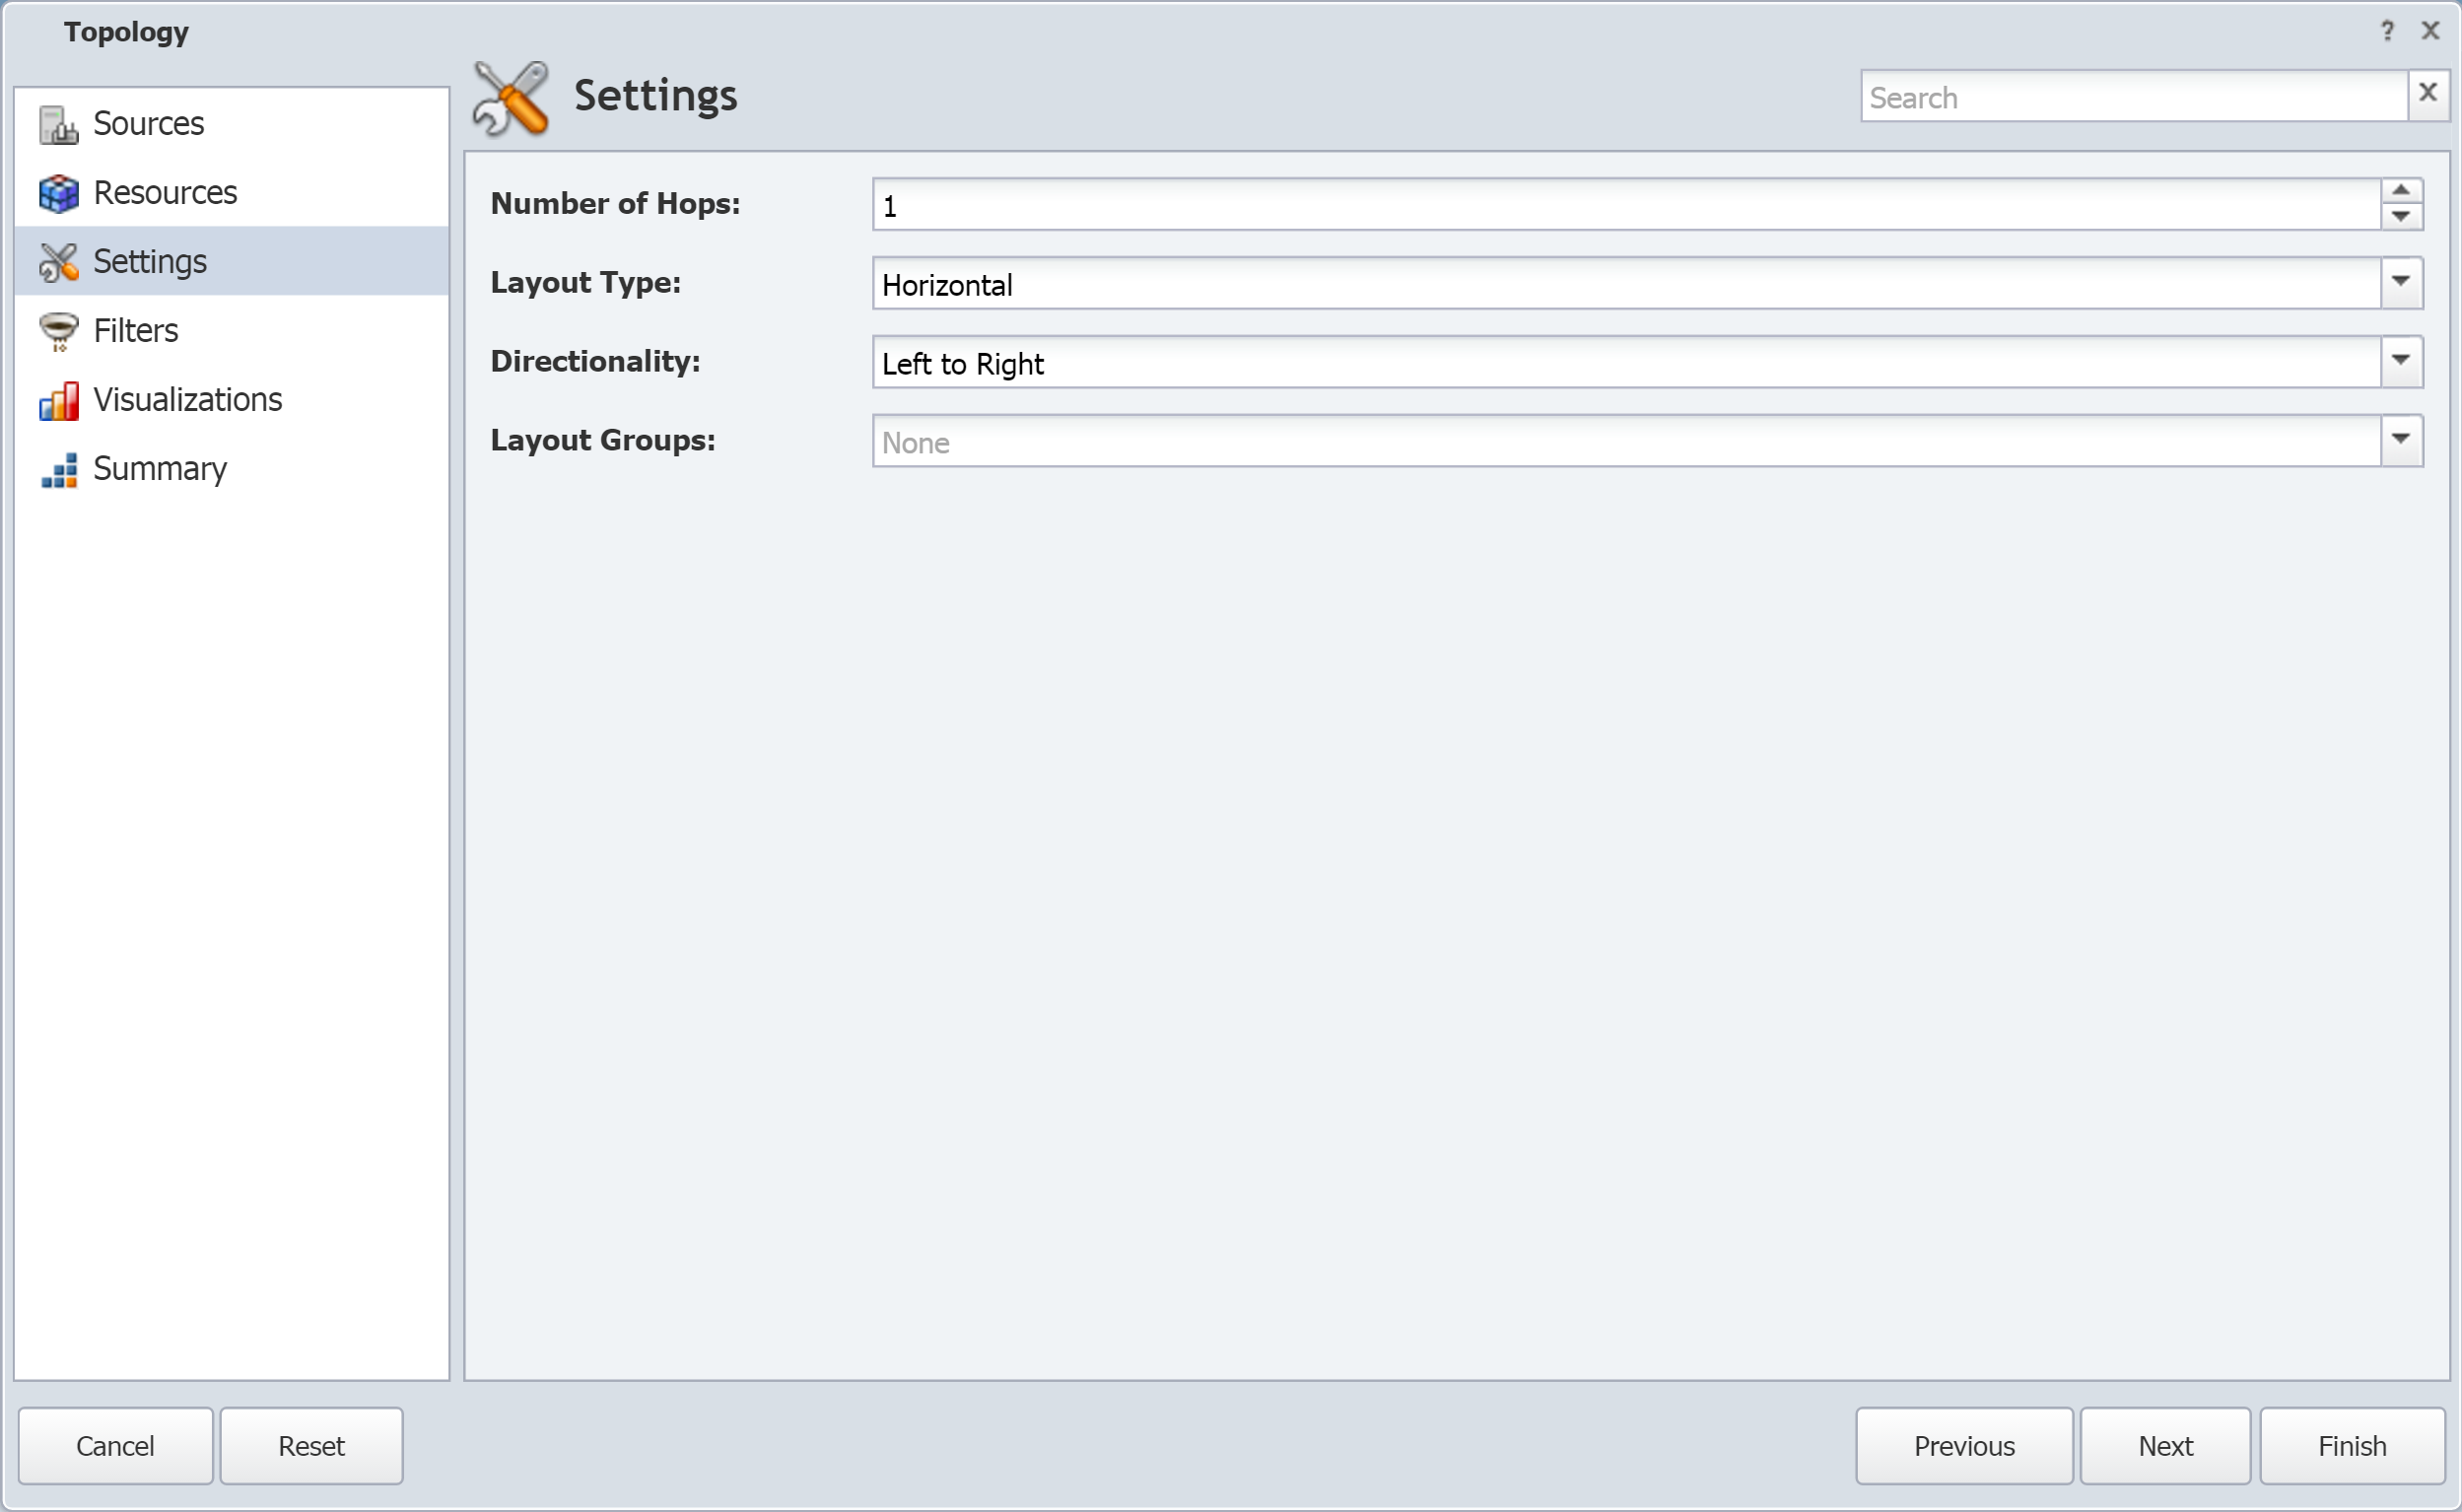
-
In the Number of Hops field, enter the number of hops to display.
-
Click the Layout Type drop-down and select Horizontal, Vertical, or Concentric.
-
Click the Directionality drop-down and select one of the following options, depending on what you selected for Layout Type.
-
Left to Right - applies to Horizontal layout type.
-
Right to Left - applies to Horizontal layout type.
-
Top to Bottom - applies to Vertical layout type.
-
Bottom to Top - applies to Vertical layout type.
-
-
Click the Layout Groups drop-down and select a layout group.
-
Click Next and continue to the next subsection, Filters.
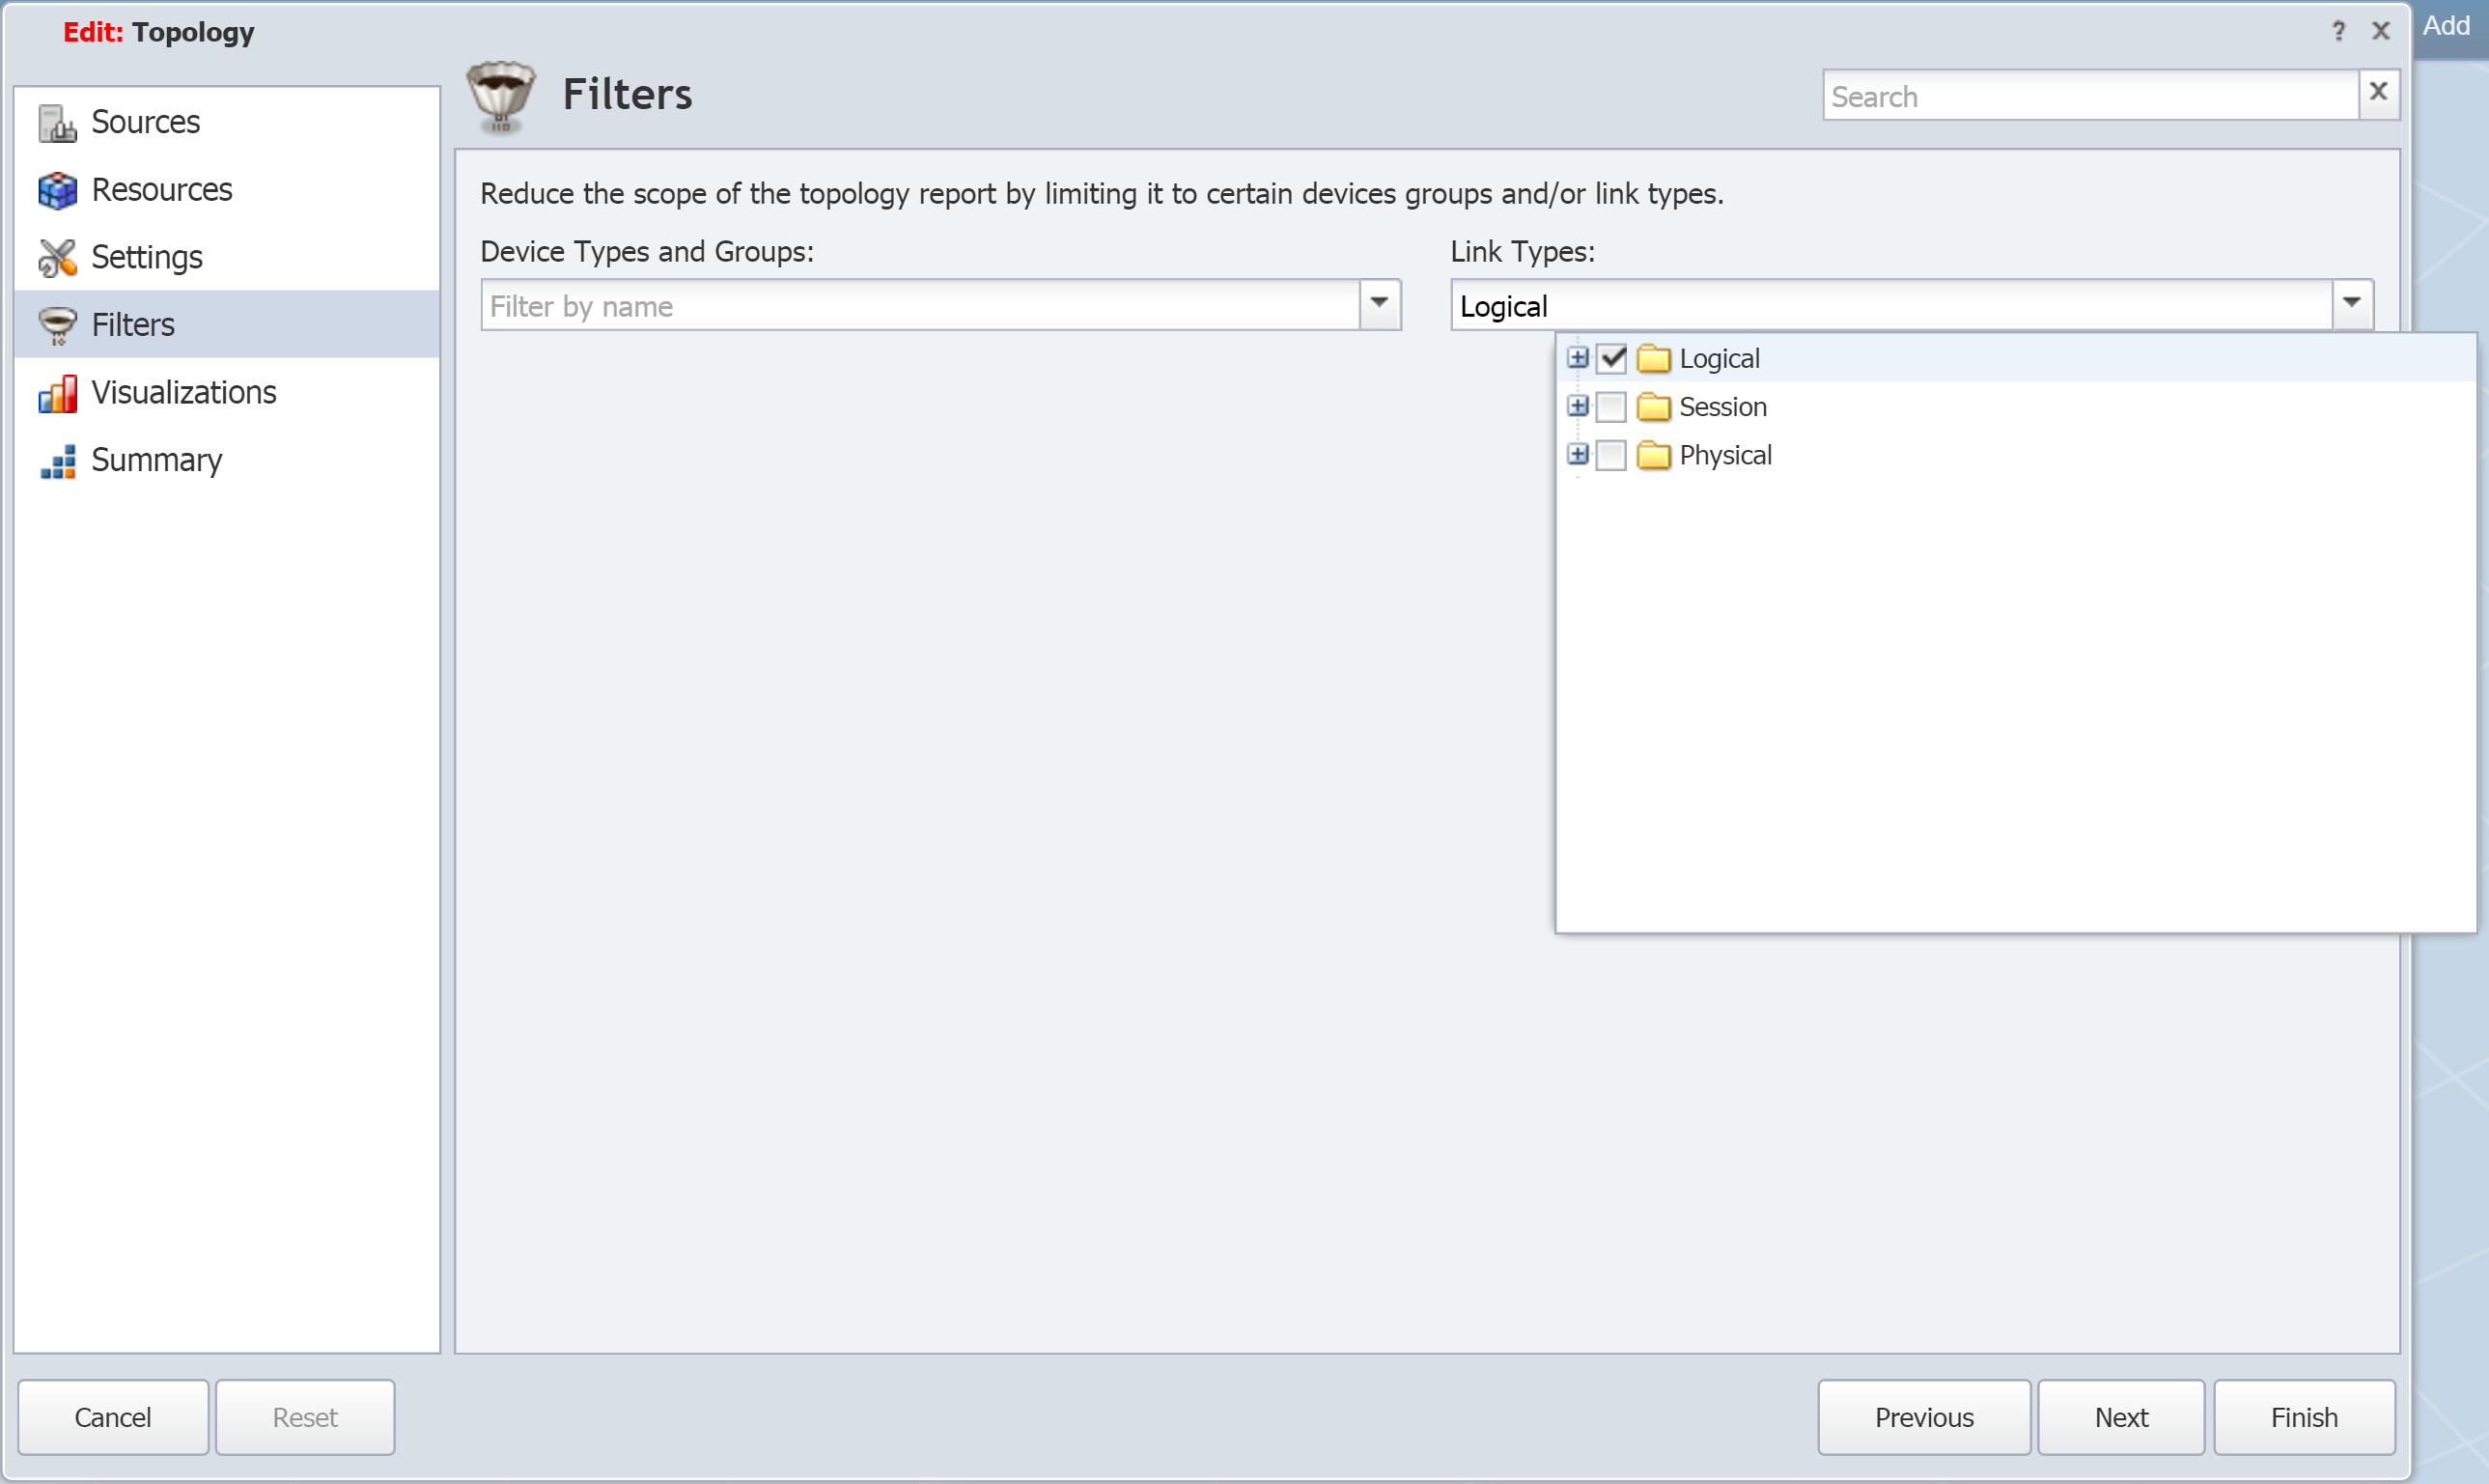
Filters
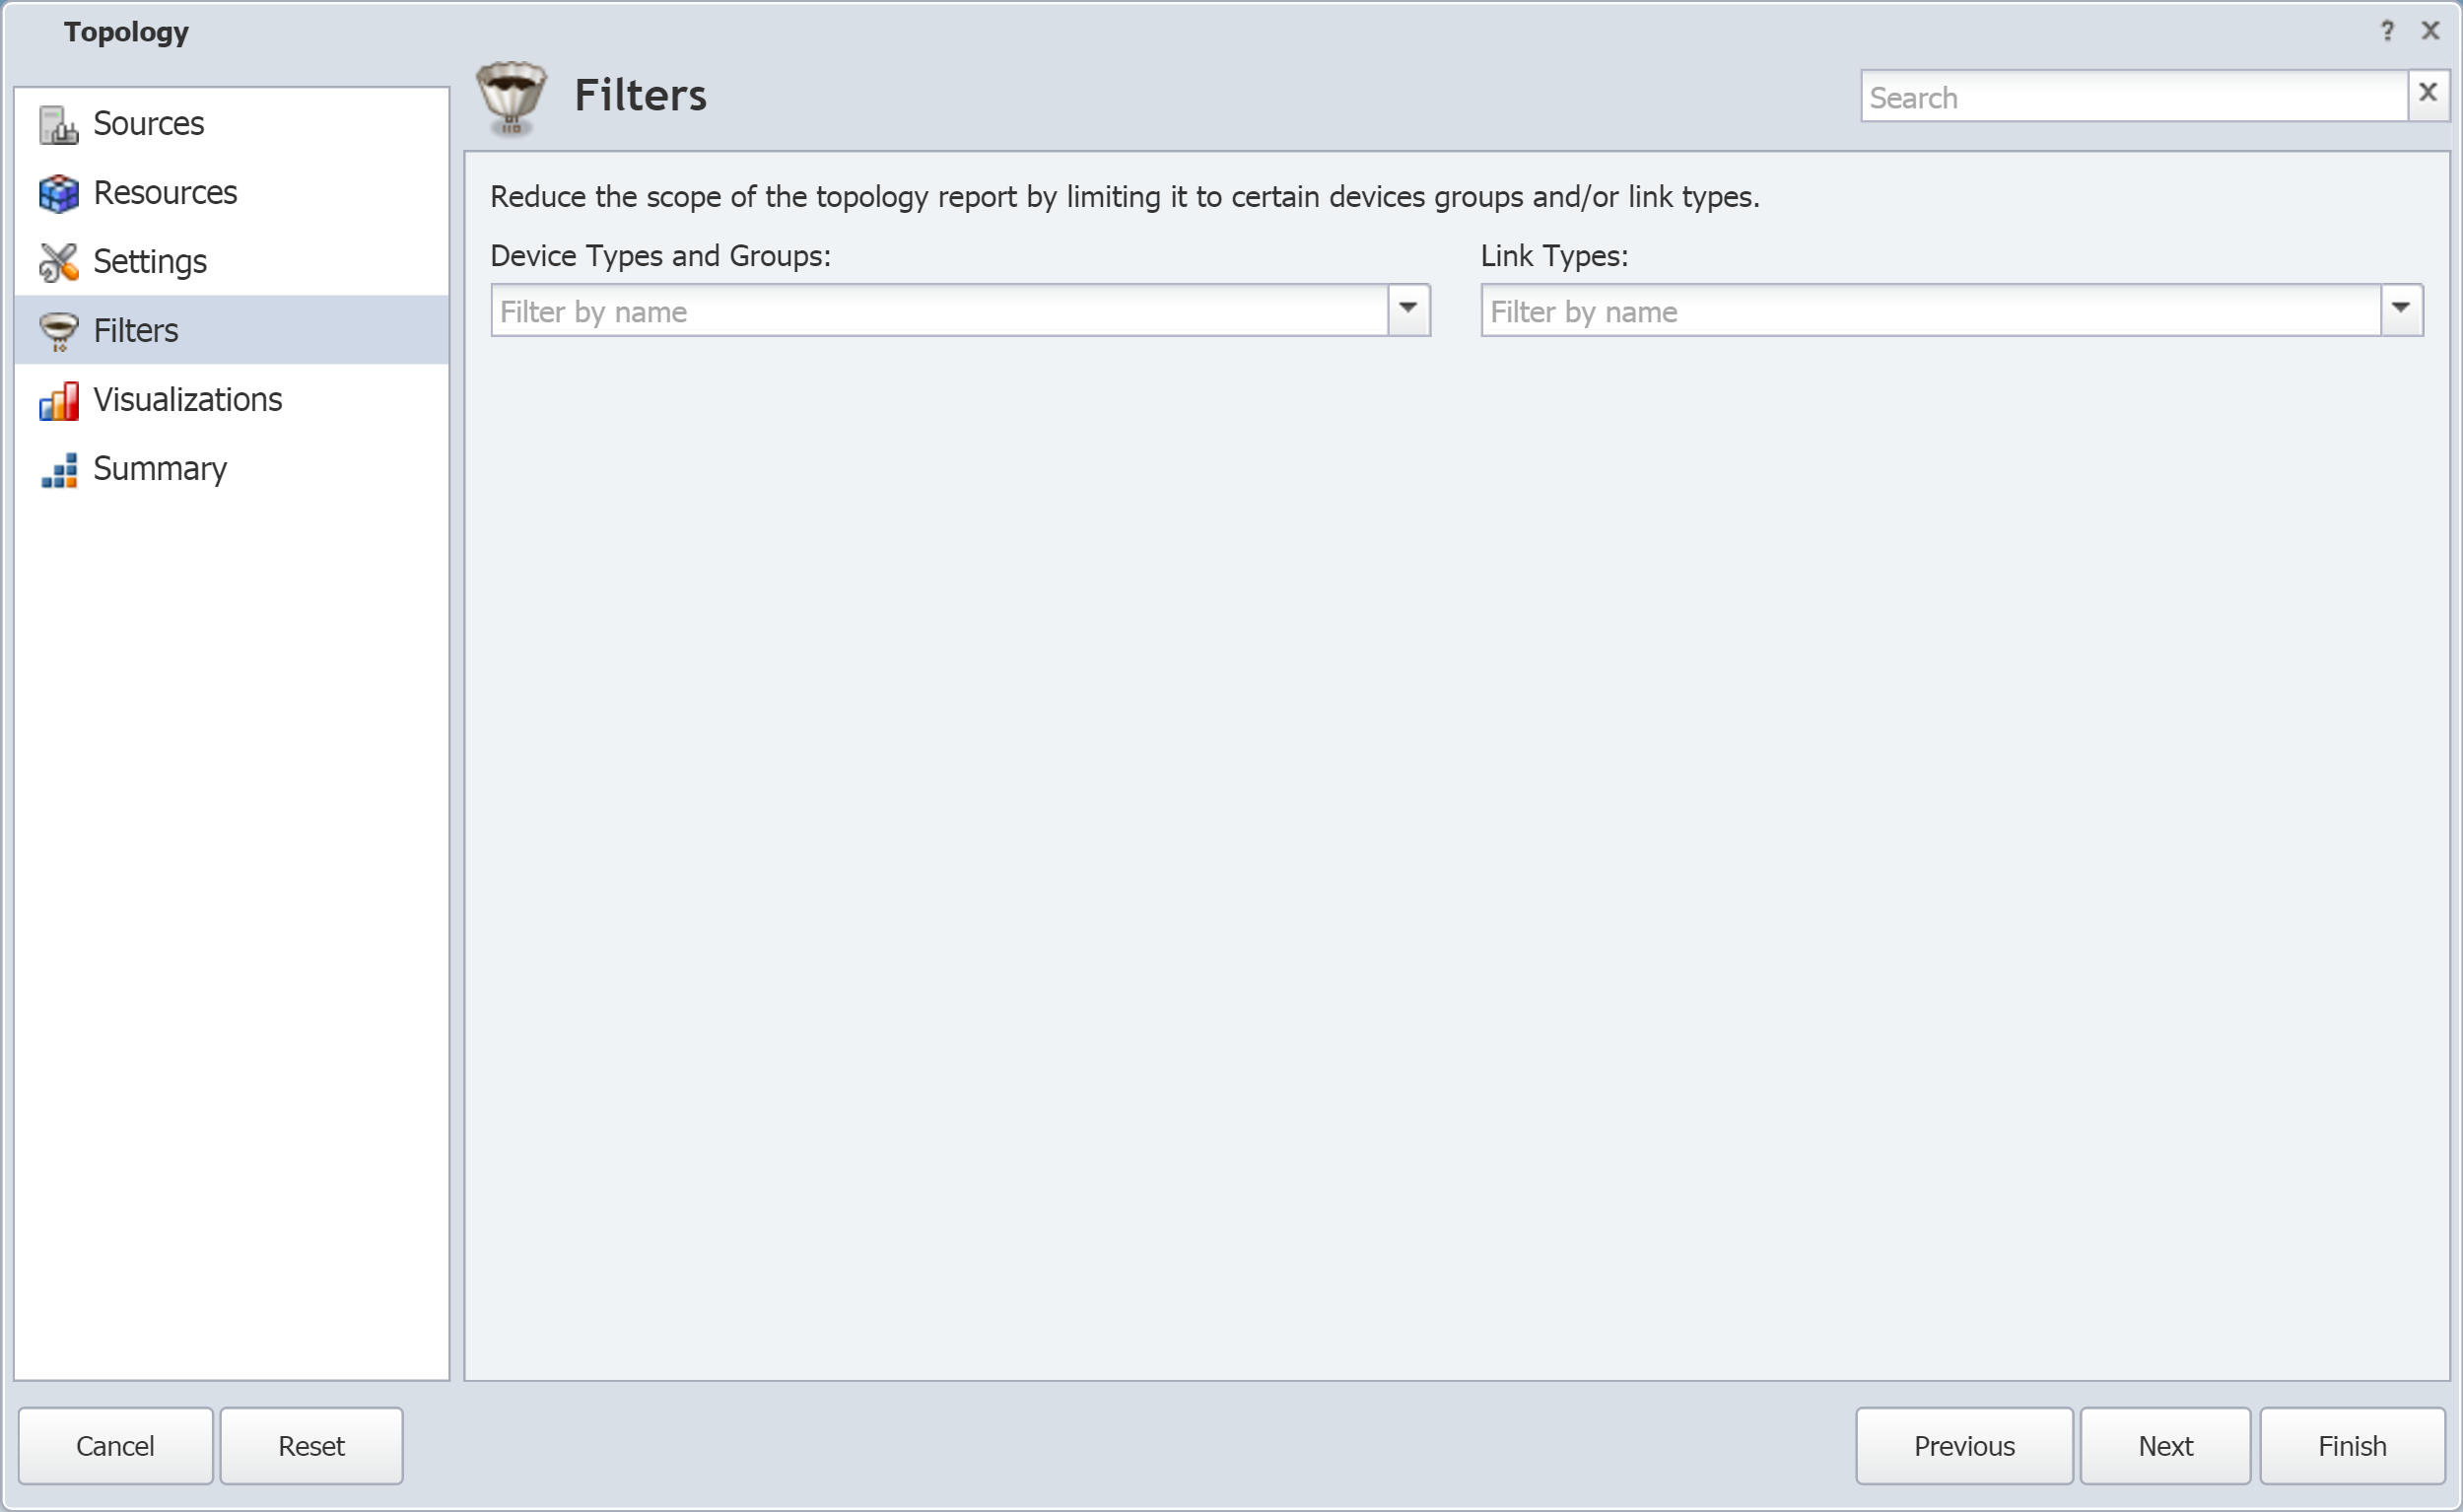
-
Click the Device Types and Groups drop-down and select the check box for one or more device groups/device types to filter the display results by.
-
Click the Link Types drop-down and select the check box for one or more link types to filter the display results by.
-
Click Next and continue to the next subsection, Visualizations.
Visualizations
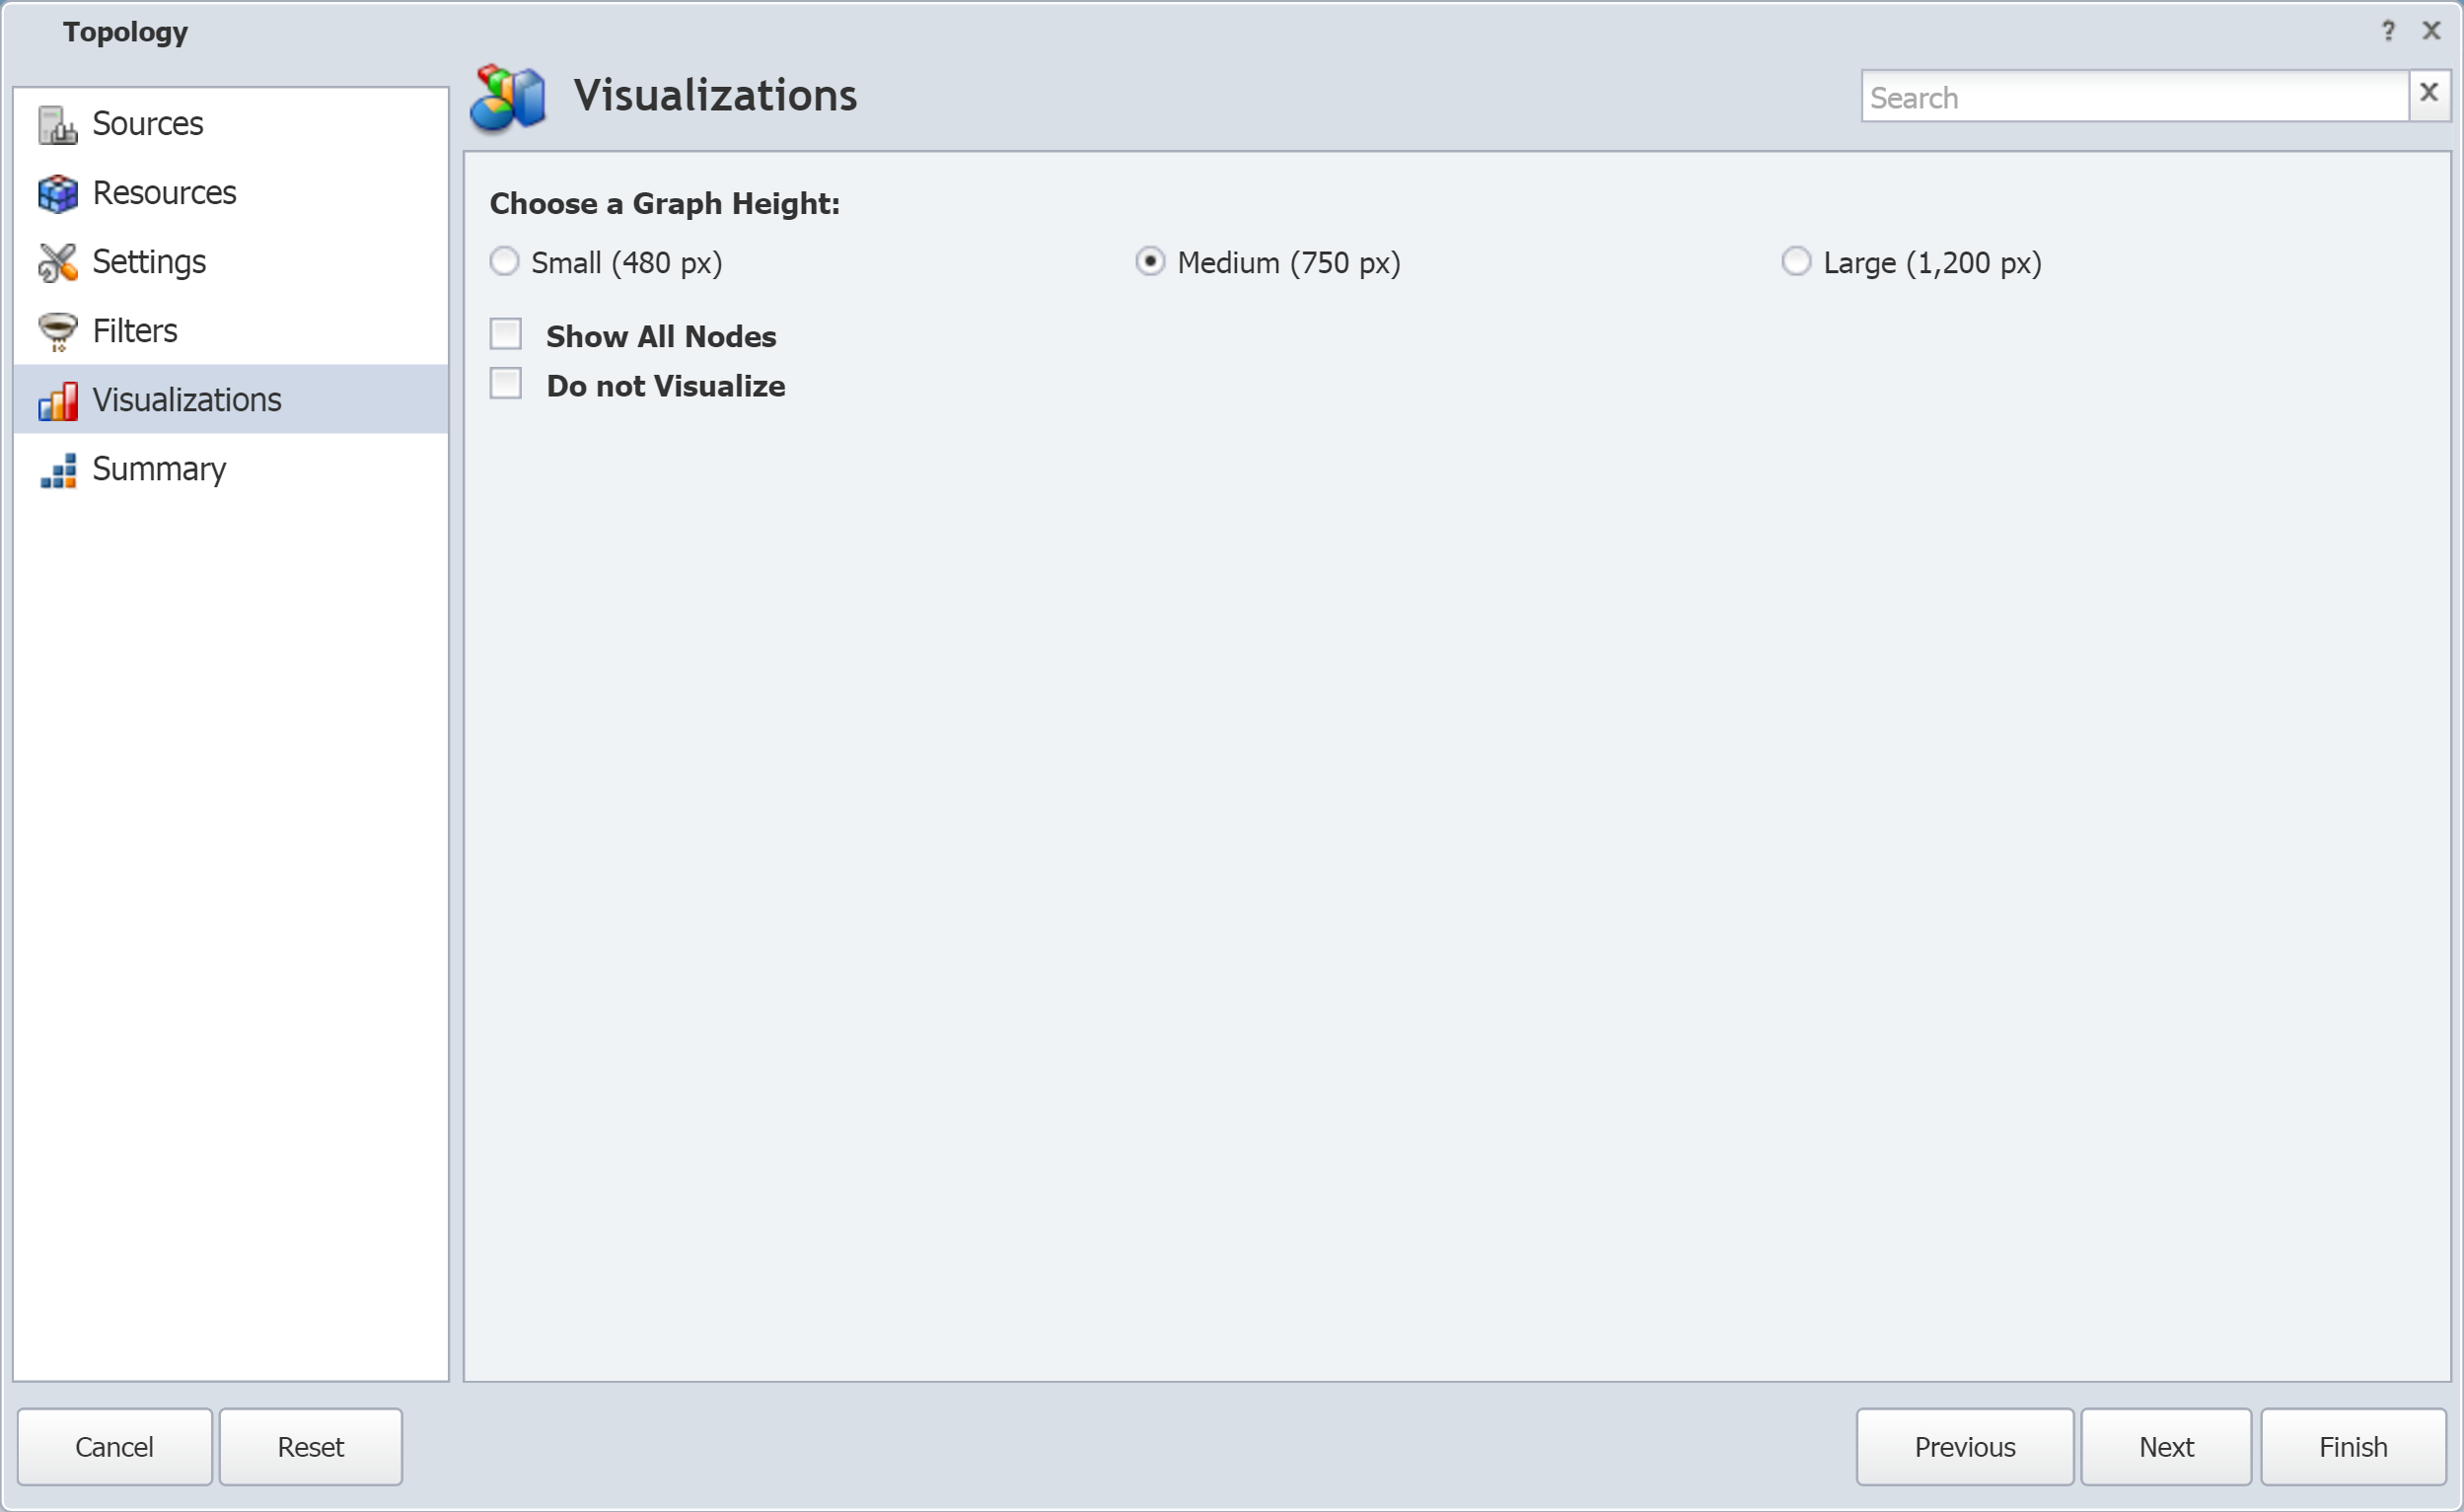
-
Under Choose a Graph Height, select Small (480 px), Medium (750 px), or Large (1200 px).
-
Select the Show All Nodes check box if you would like to display all nodes.
-
Select the Do not Visualize check box if you like to create this as a hidden attachment. This means that you can chain related attachments to your topology attachment without the topology attachment being visible.
-
Click Next and continue to the next subsection, Summary.
Summary
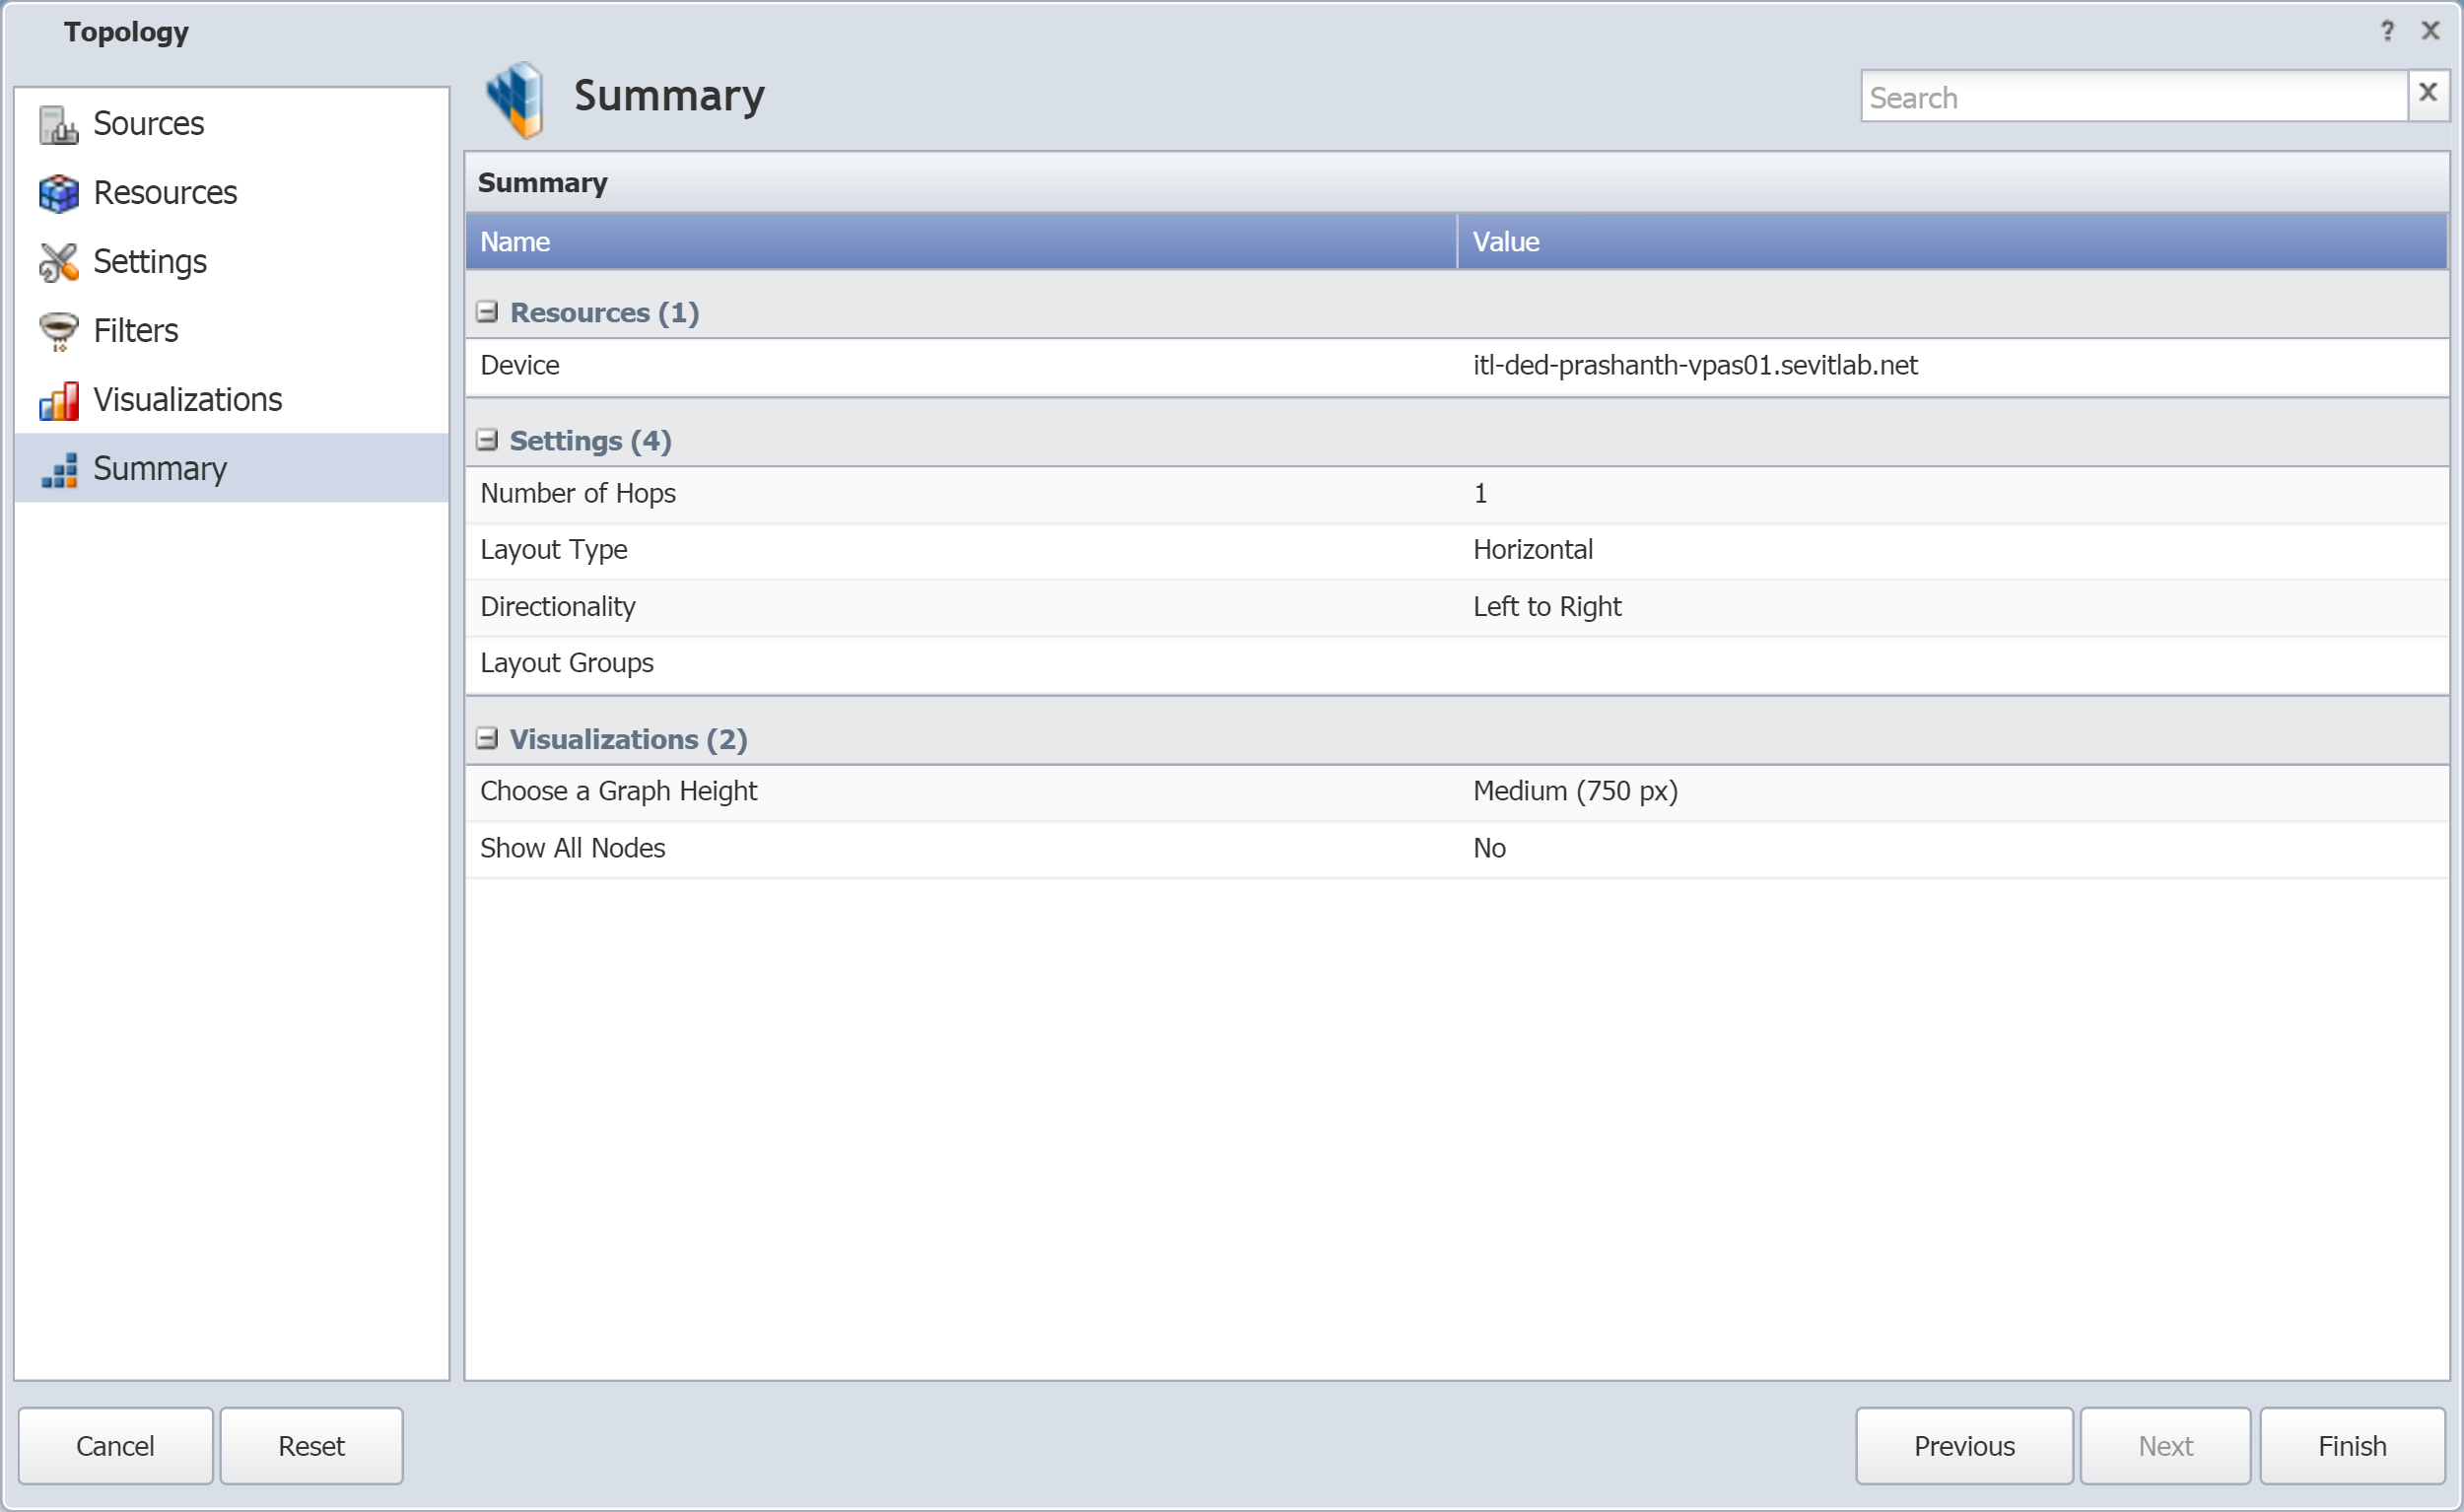
The Summary page lets you view a summary of the report attachment definition. To make changes to any of the items in the Summary, click on the item. This will take you to the appropriate Report Attachment Wizard page, where you can change settings.
If you do not need to make further changes to the Report Attachment Wizard settings, click Finish to display the report attachment.
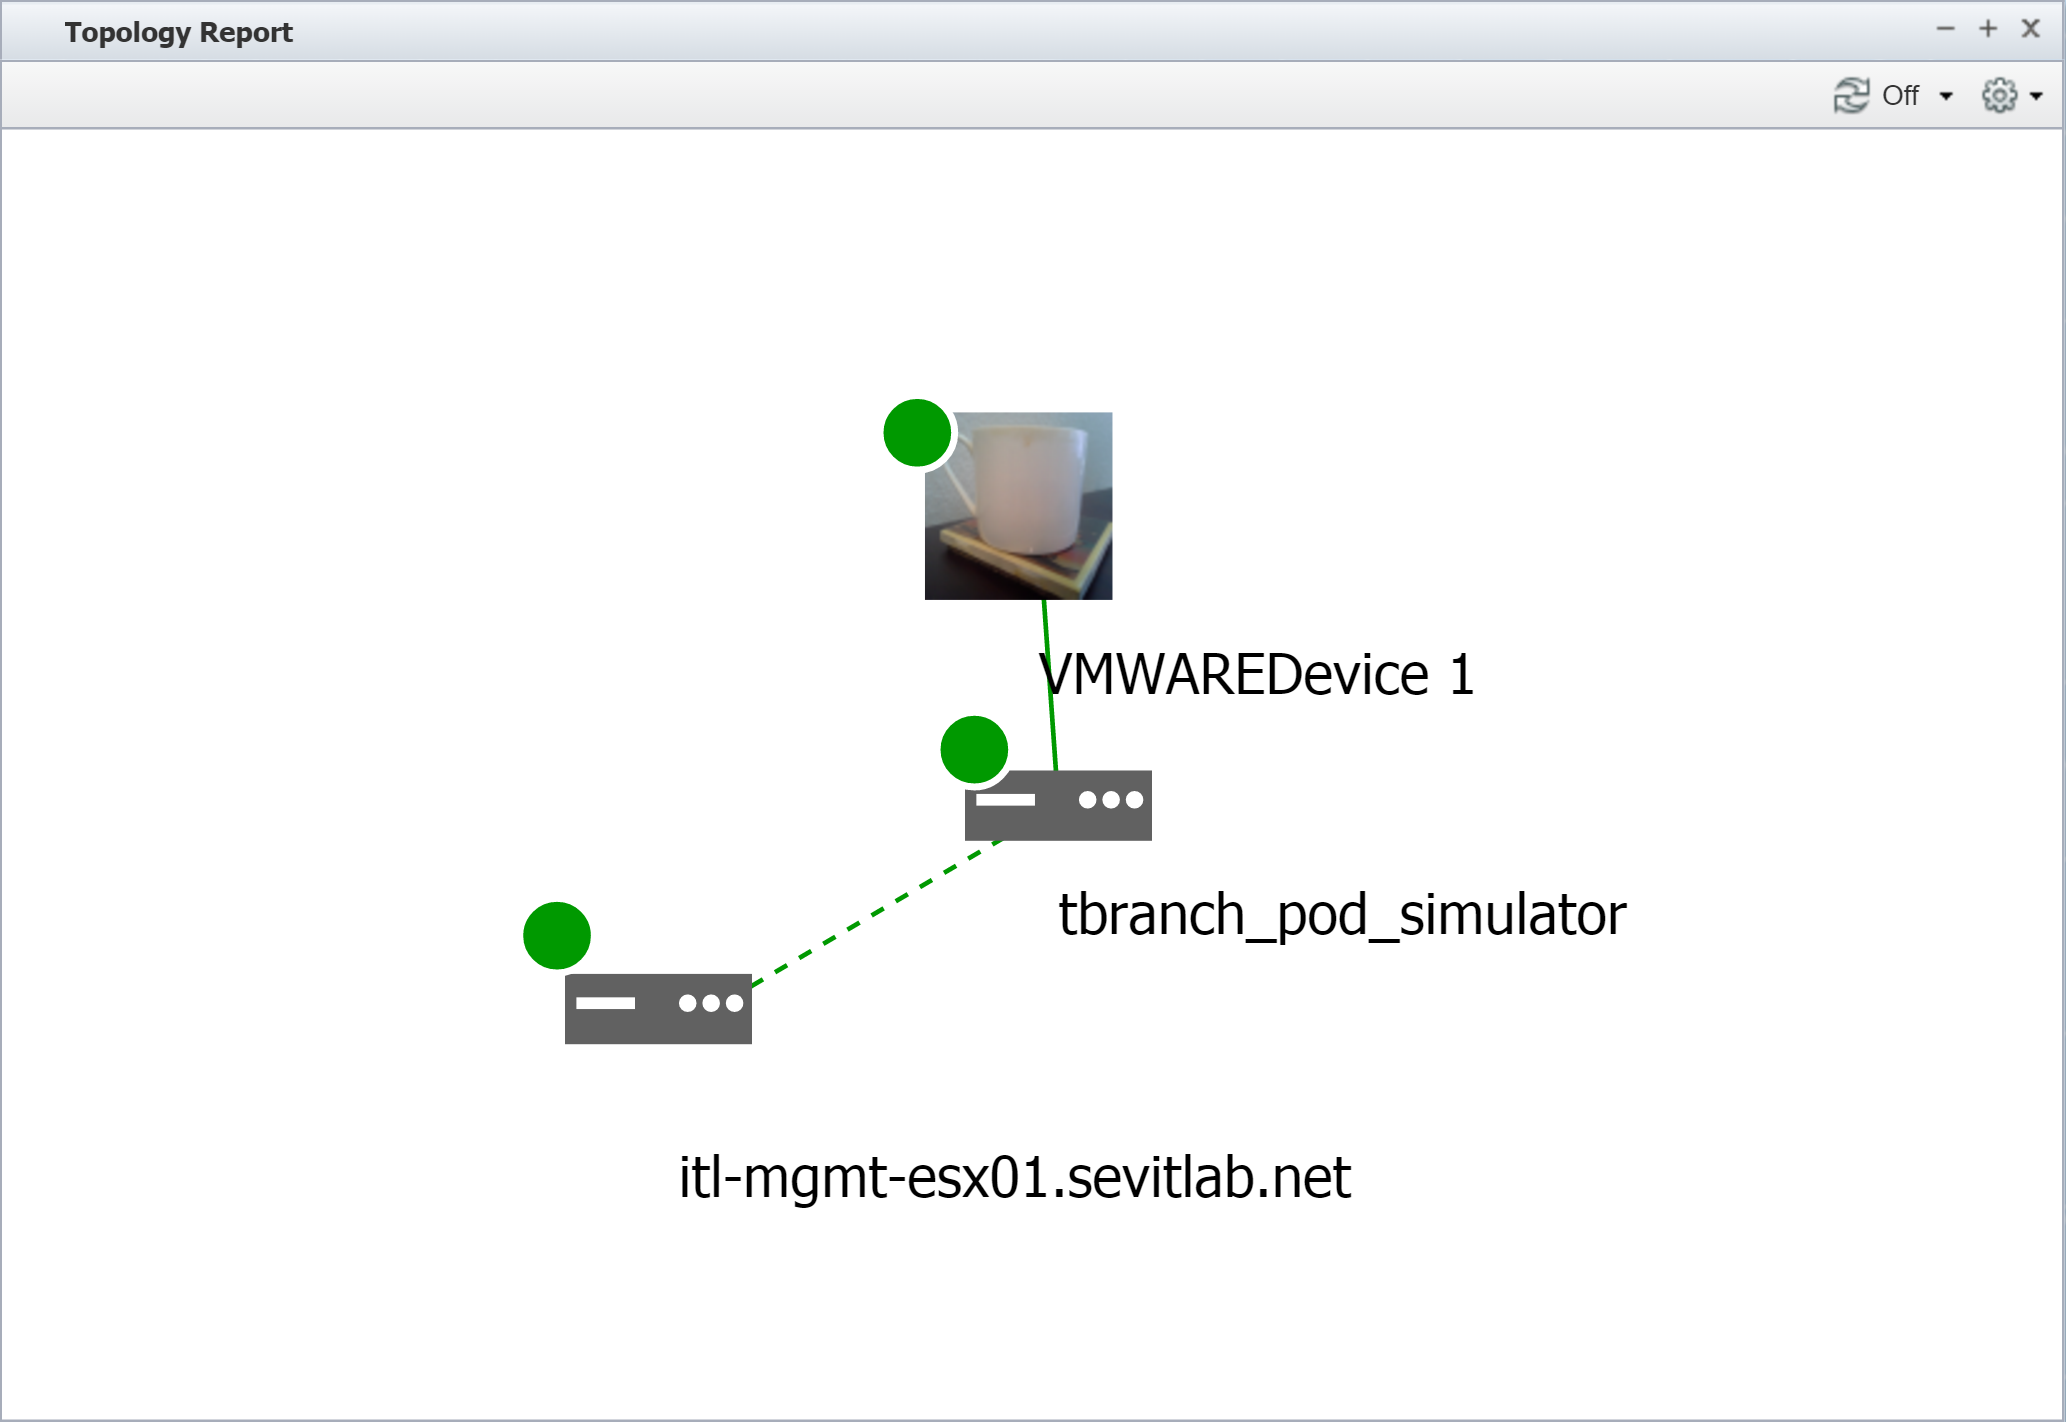
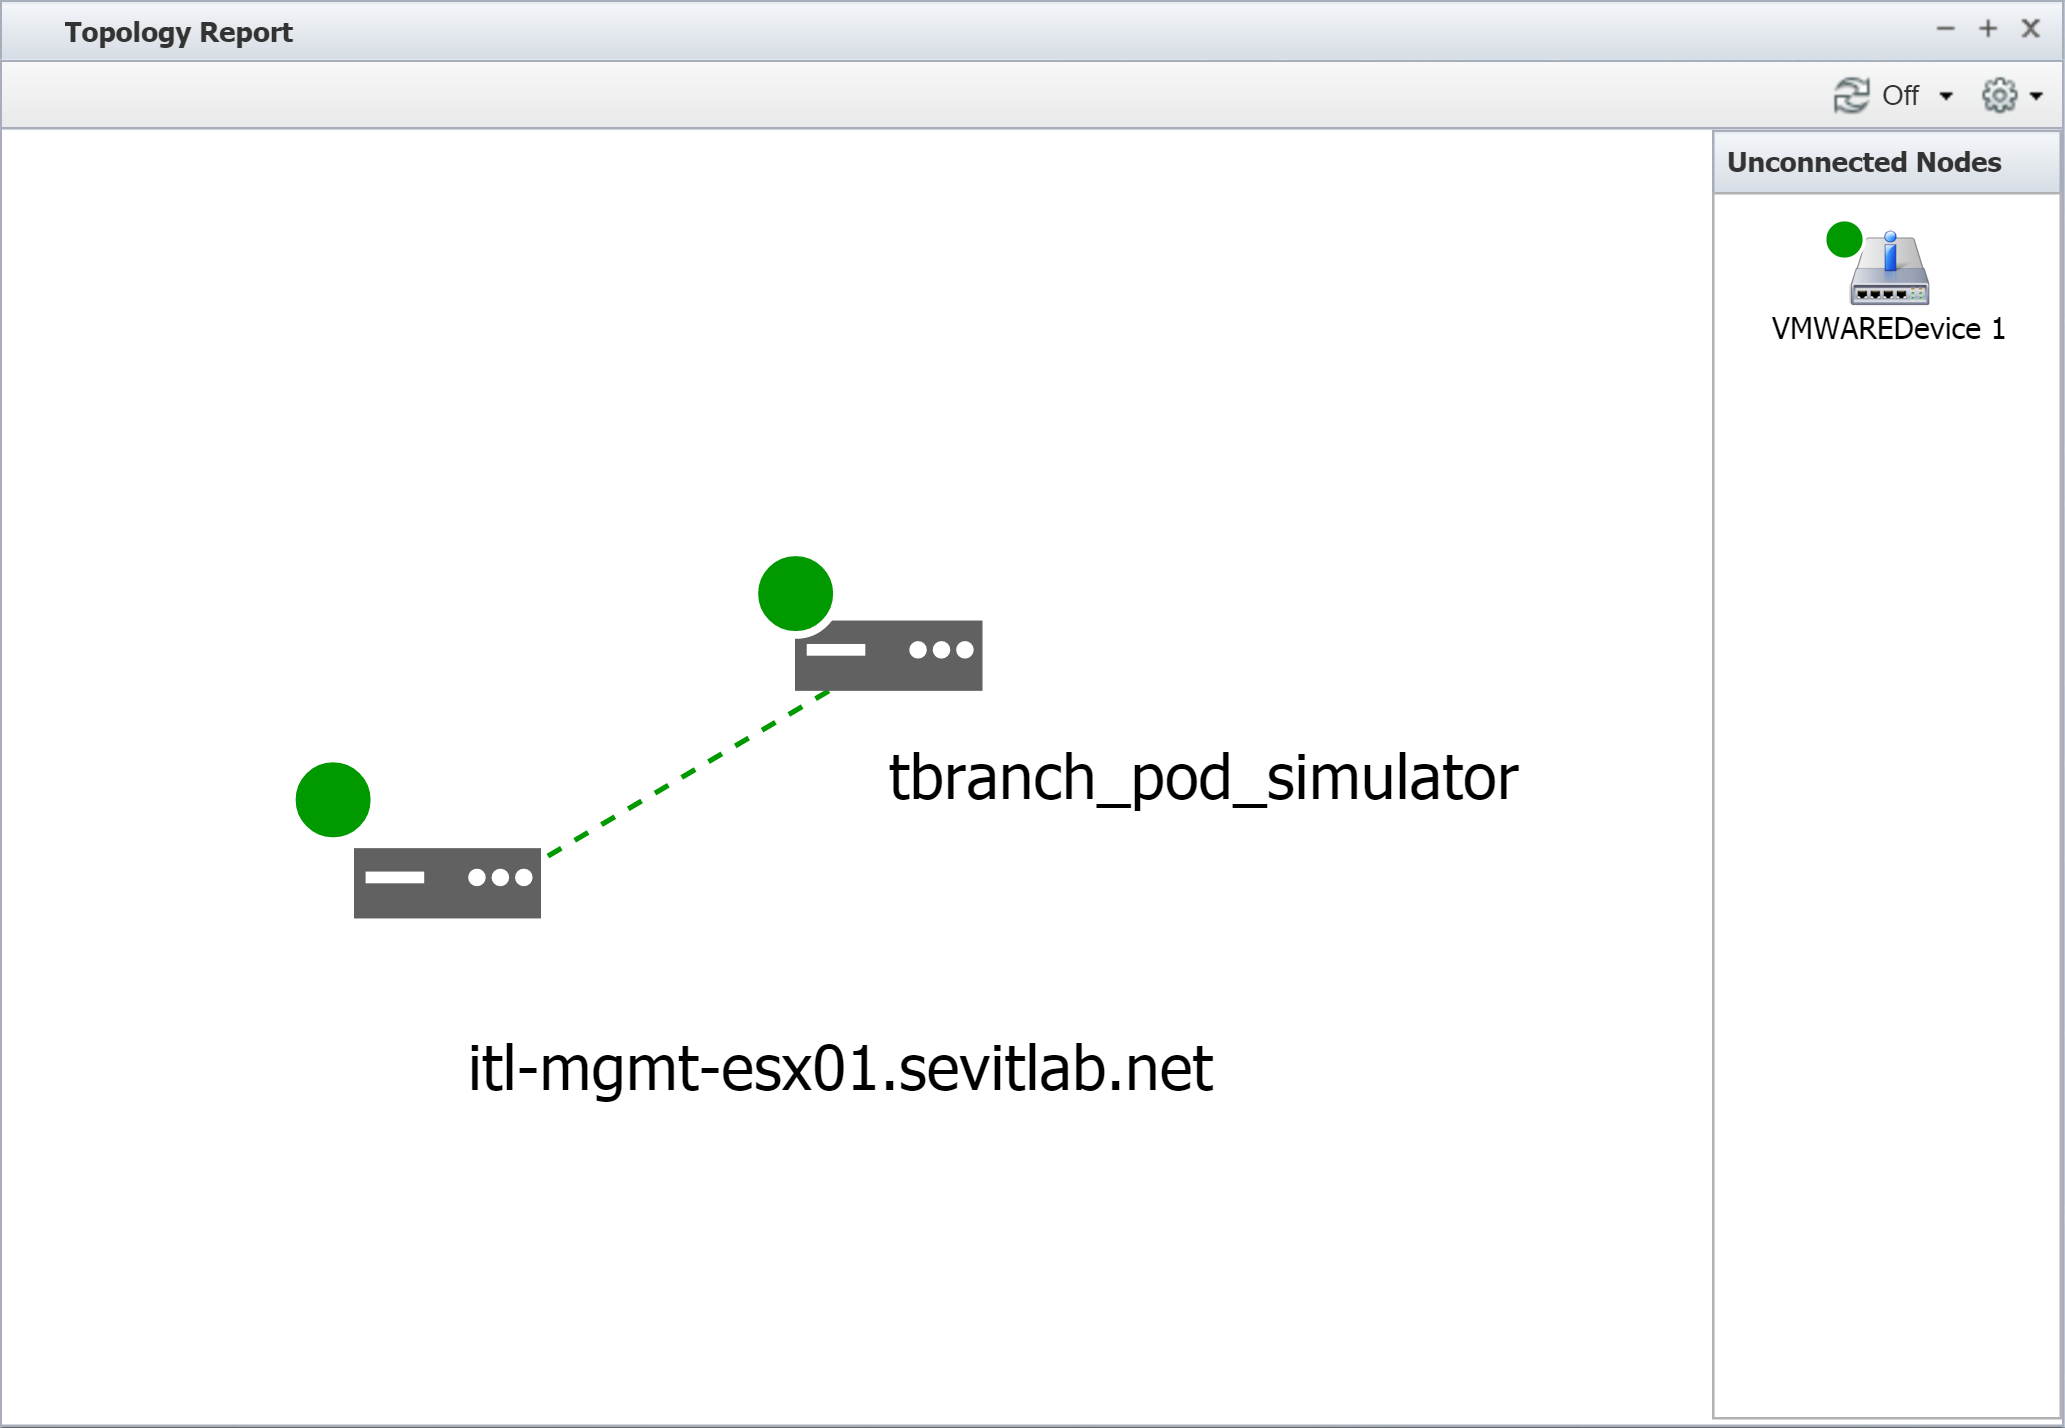
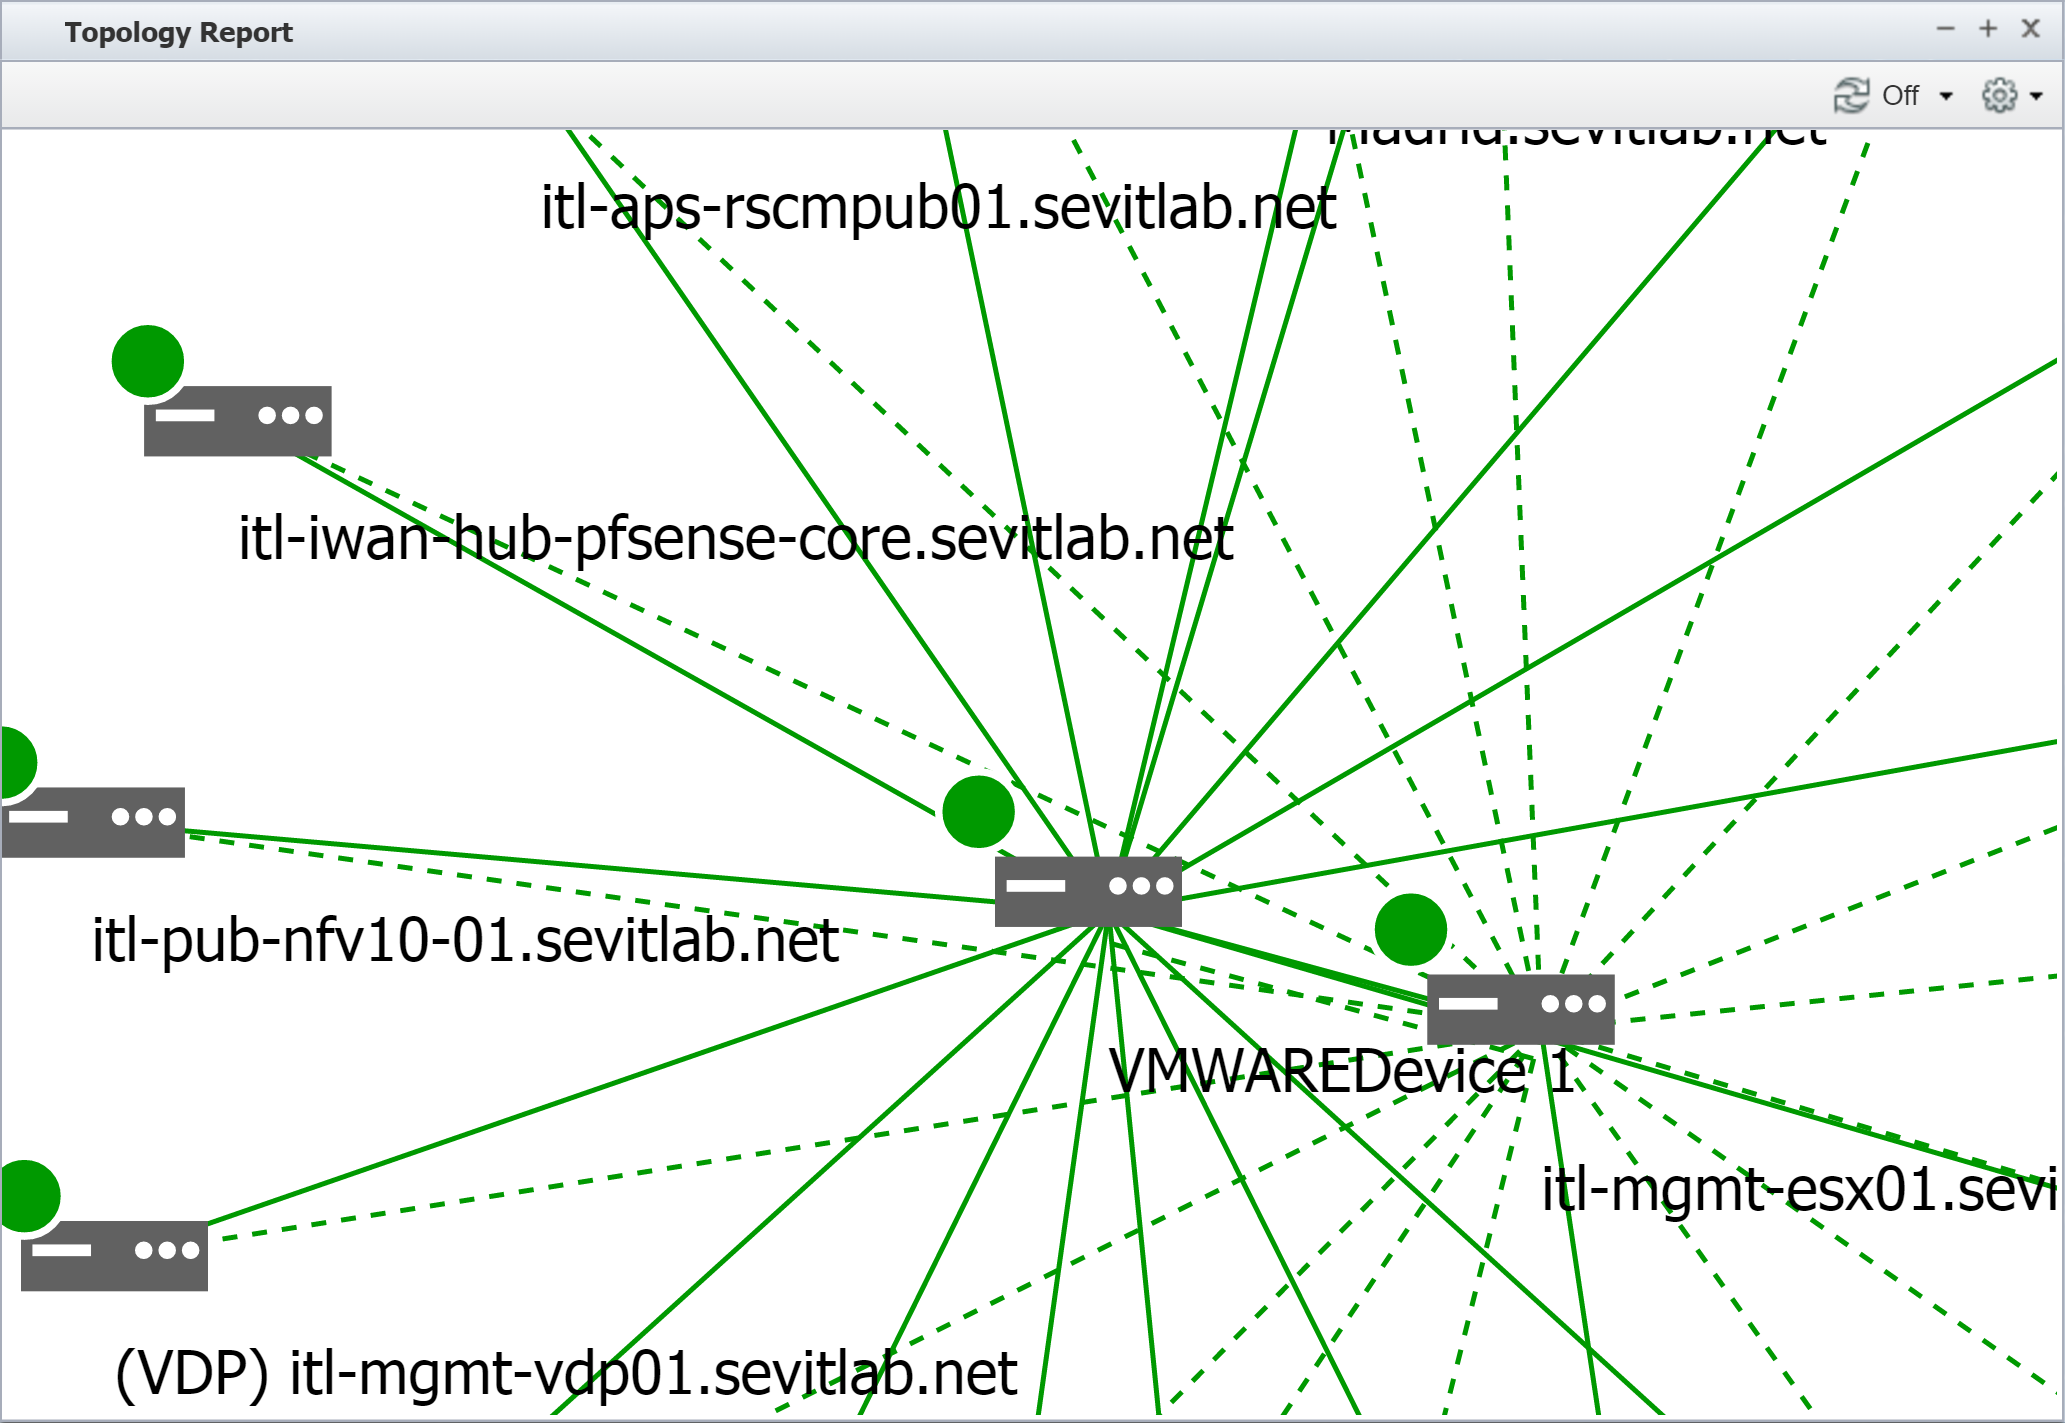
Report Results
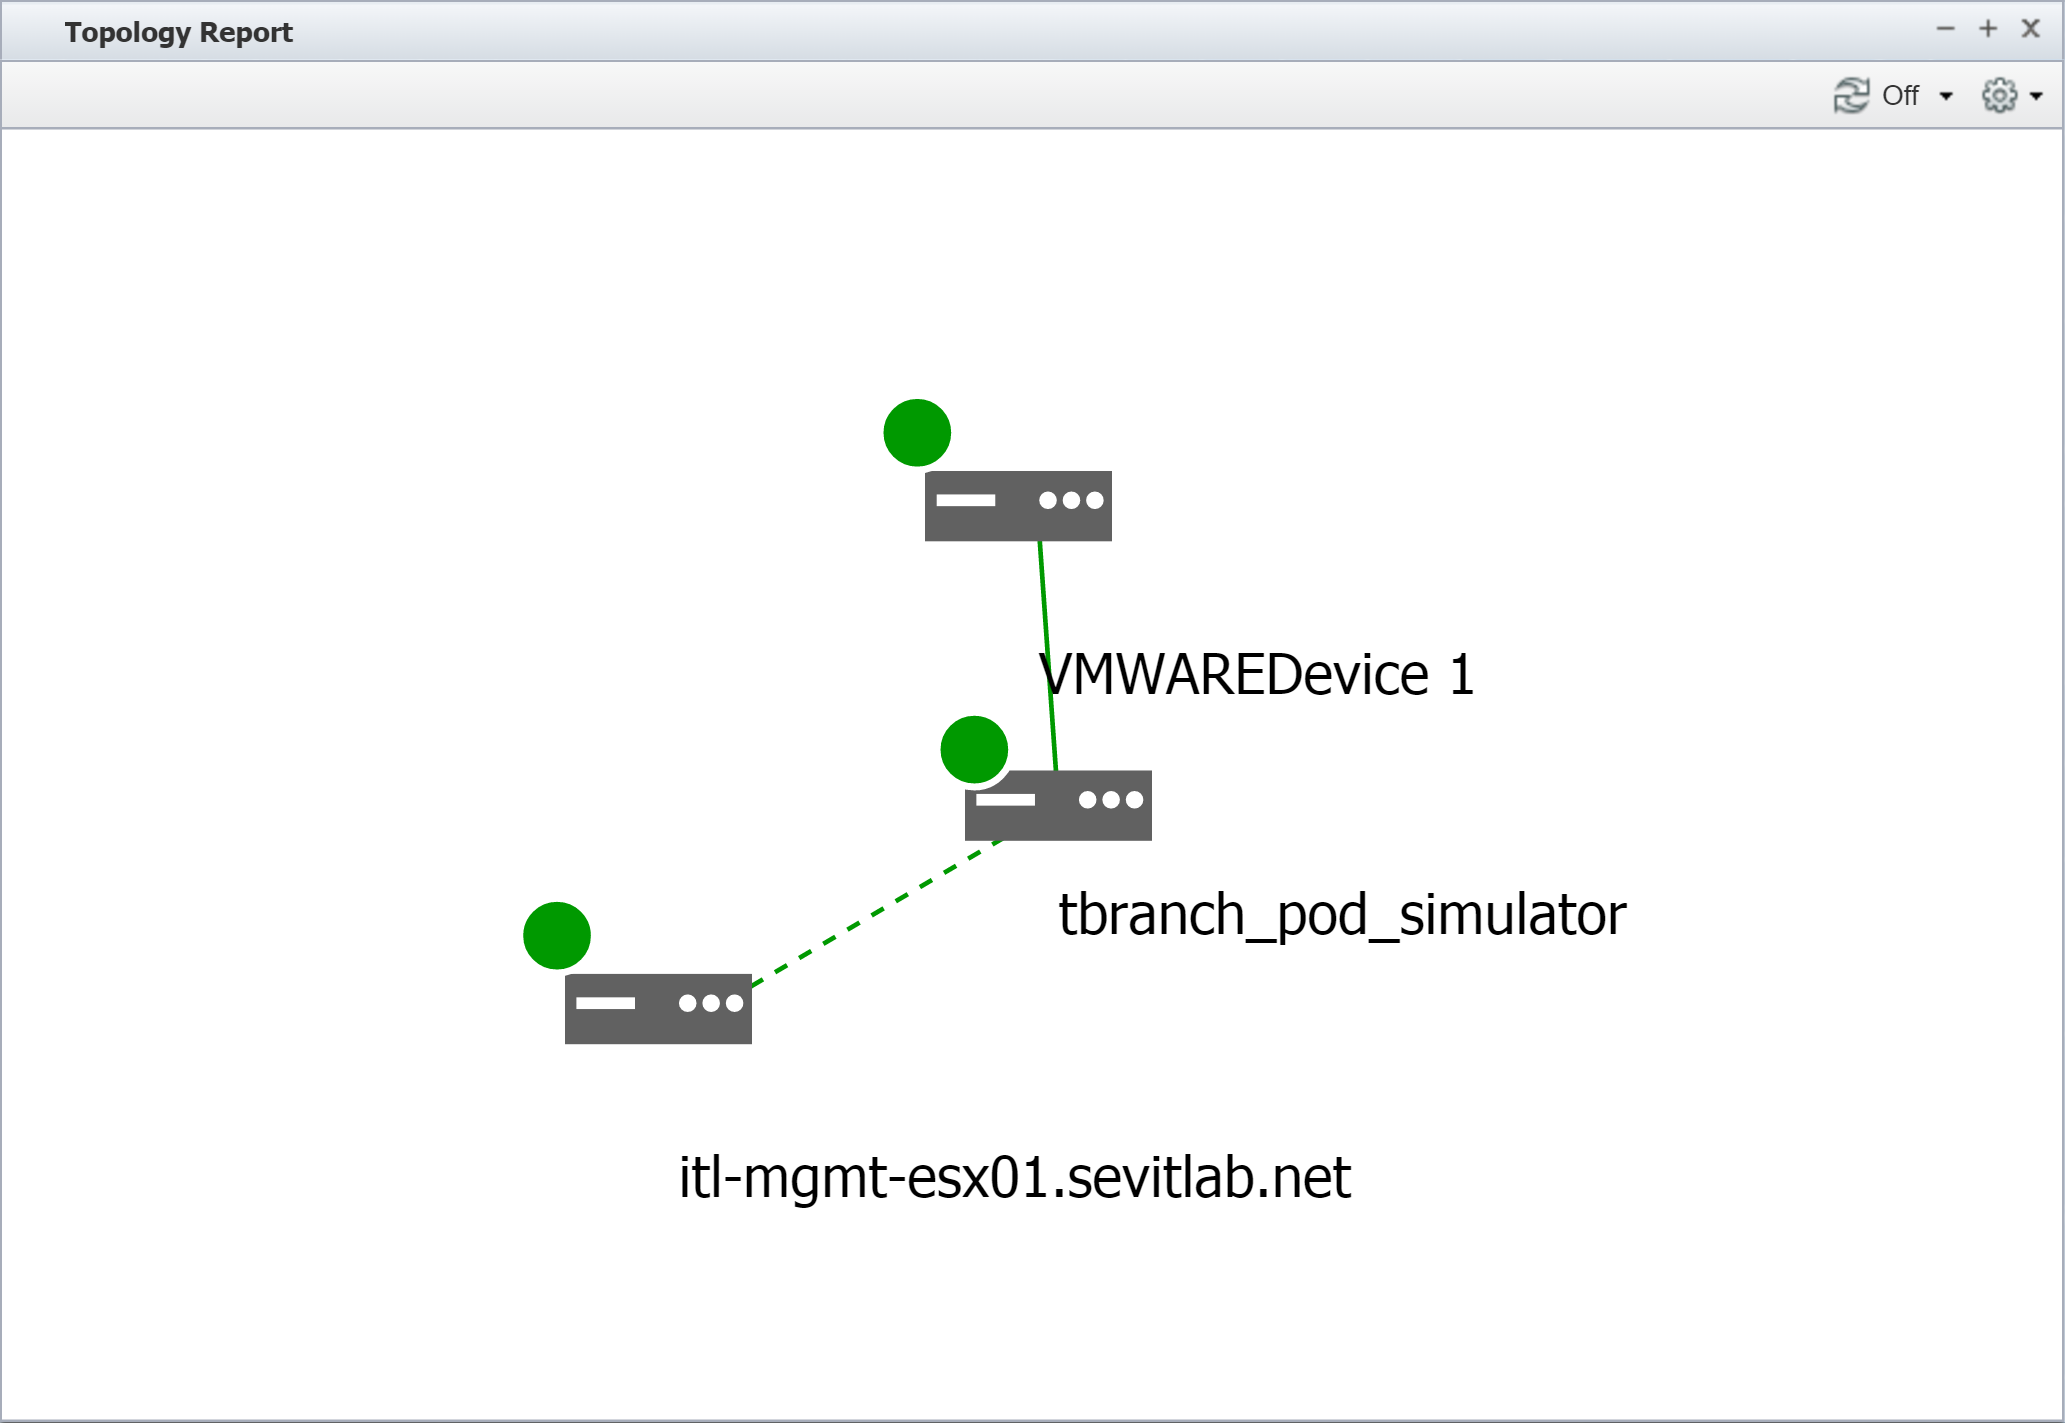
In the screenshot above, the solid line indicates a physical connection. The dashed line indicates a logical connection. Additional connection types are discussed in the next section.
Topology Report Interactions
Types of Connections
The following indicate the type of connection between devices:
-
Solid line - indicates a physical connection.
-
Dashed line - indicates a logical connection.
-
Dotted line - indicates a session connection.
-
Black line - indicates that there is no connection between any of the objects of the devices.
Address Resolution Protocol (ARP) data is normally collected from the default gateway router and holds information about the IP to MAC relationship. This does not necessarily mean that there is a physical connection between the default router and a device described in the ARP record. In fact, there may be multiple L2 and L1 entities between the two devices. Therefore, ARP data is considered a logical relationship.
Alert Indications
A dot next to each device indicates that device's alert severity. If the device has no alerts, the dot is green.
Edit Report Attachment Settings
Once you have created your report attachment, you can edit settings to change the display output.
-
In the upper right corner of the attachment, click
 to display the Report Attachment Wizard.
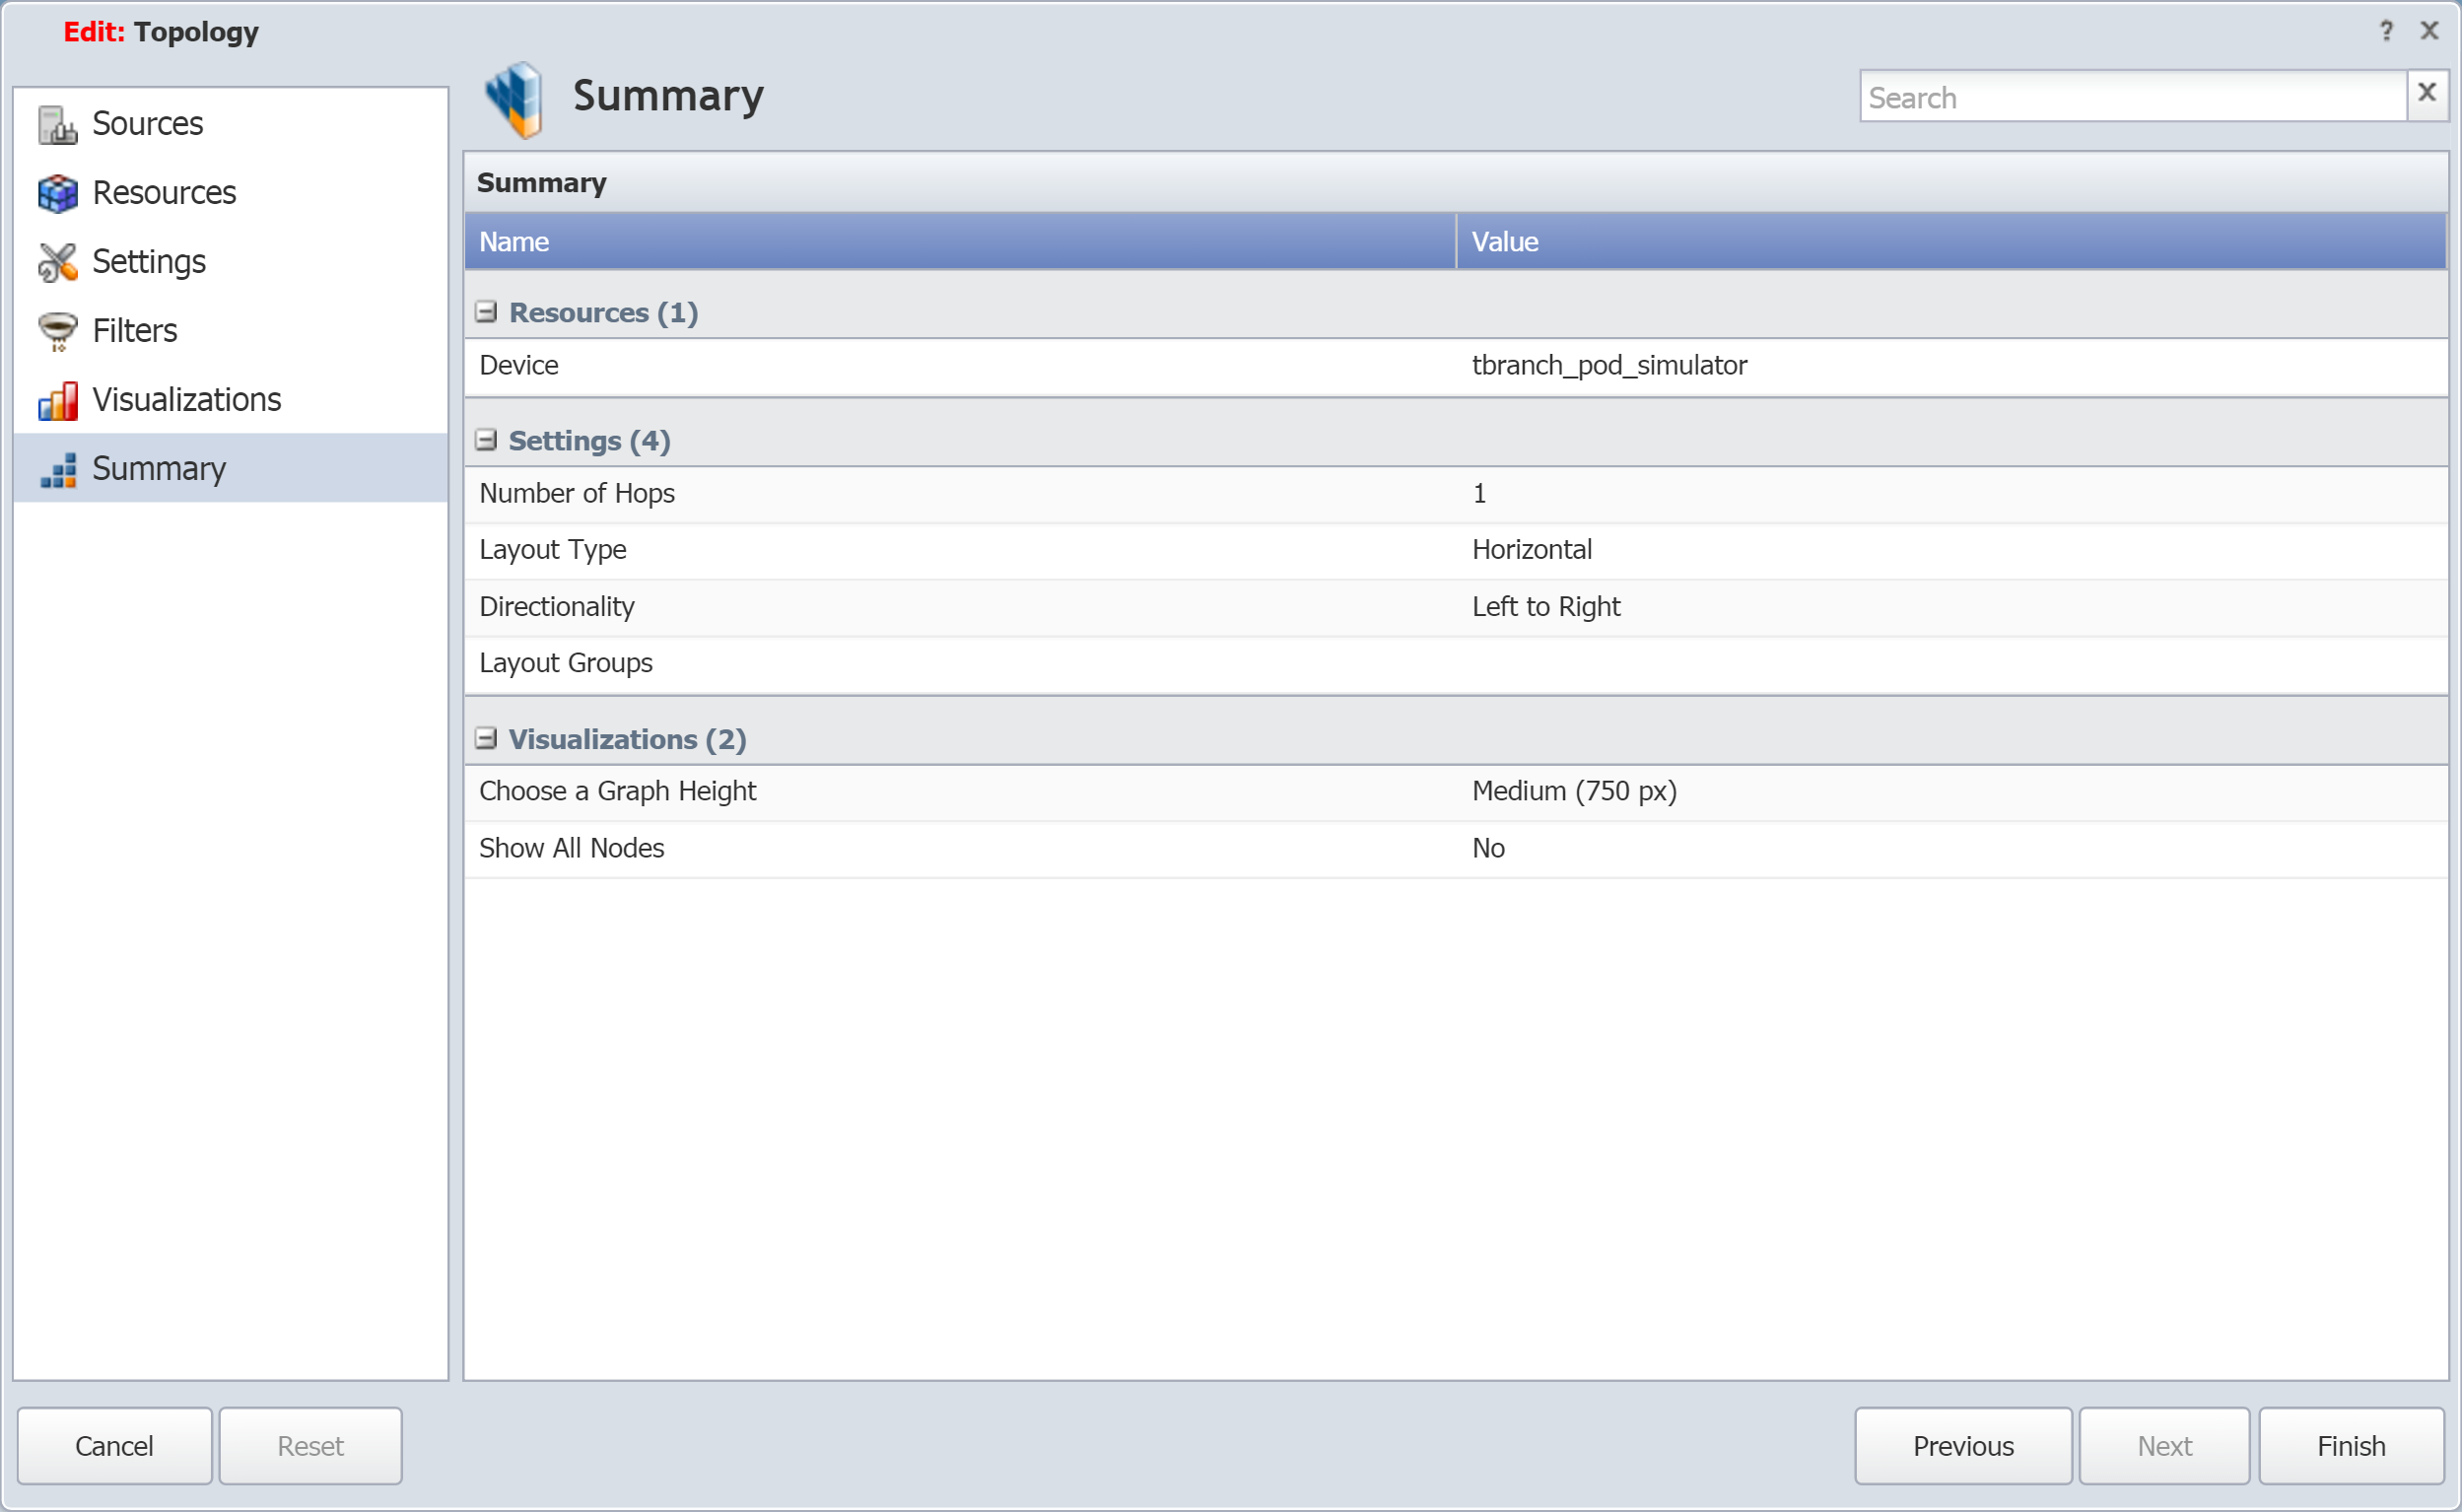
-
The Summary page displays the current report attachment settings. Click on an item to edit it. In the screenshot above, the Filters section is not listed on the Summary page. This is because no filters have been applied. For our example, we are now going to apply a filter.
-
On the left side of the Report Attachment Wizard, click on Filters to display the Filters page.
-
Click the Link Types drop-down and select the check box for a link type to filter the display results by. In the screenshot above, we have selected Logical connection.
-
Change any other settings as needed.
-
Once you are finished making changes, click Finish to display the updated report attachment. In the screenshot below, one of the devices now appears under Unconnected Nodes. This device is still within the number of specified hops and is, in fact, connected to the other two devices that appear. However, it is filtered out as a result of the Link Types filter (Logical) that we applied.
Interacting with Nodes
-
Hover over a node to display the following information:
-
Device name
-
Description
-
Location
-
Number of objects
-
-
Right-click on a node to display available options.
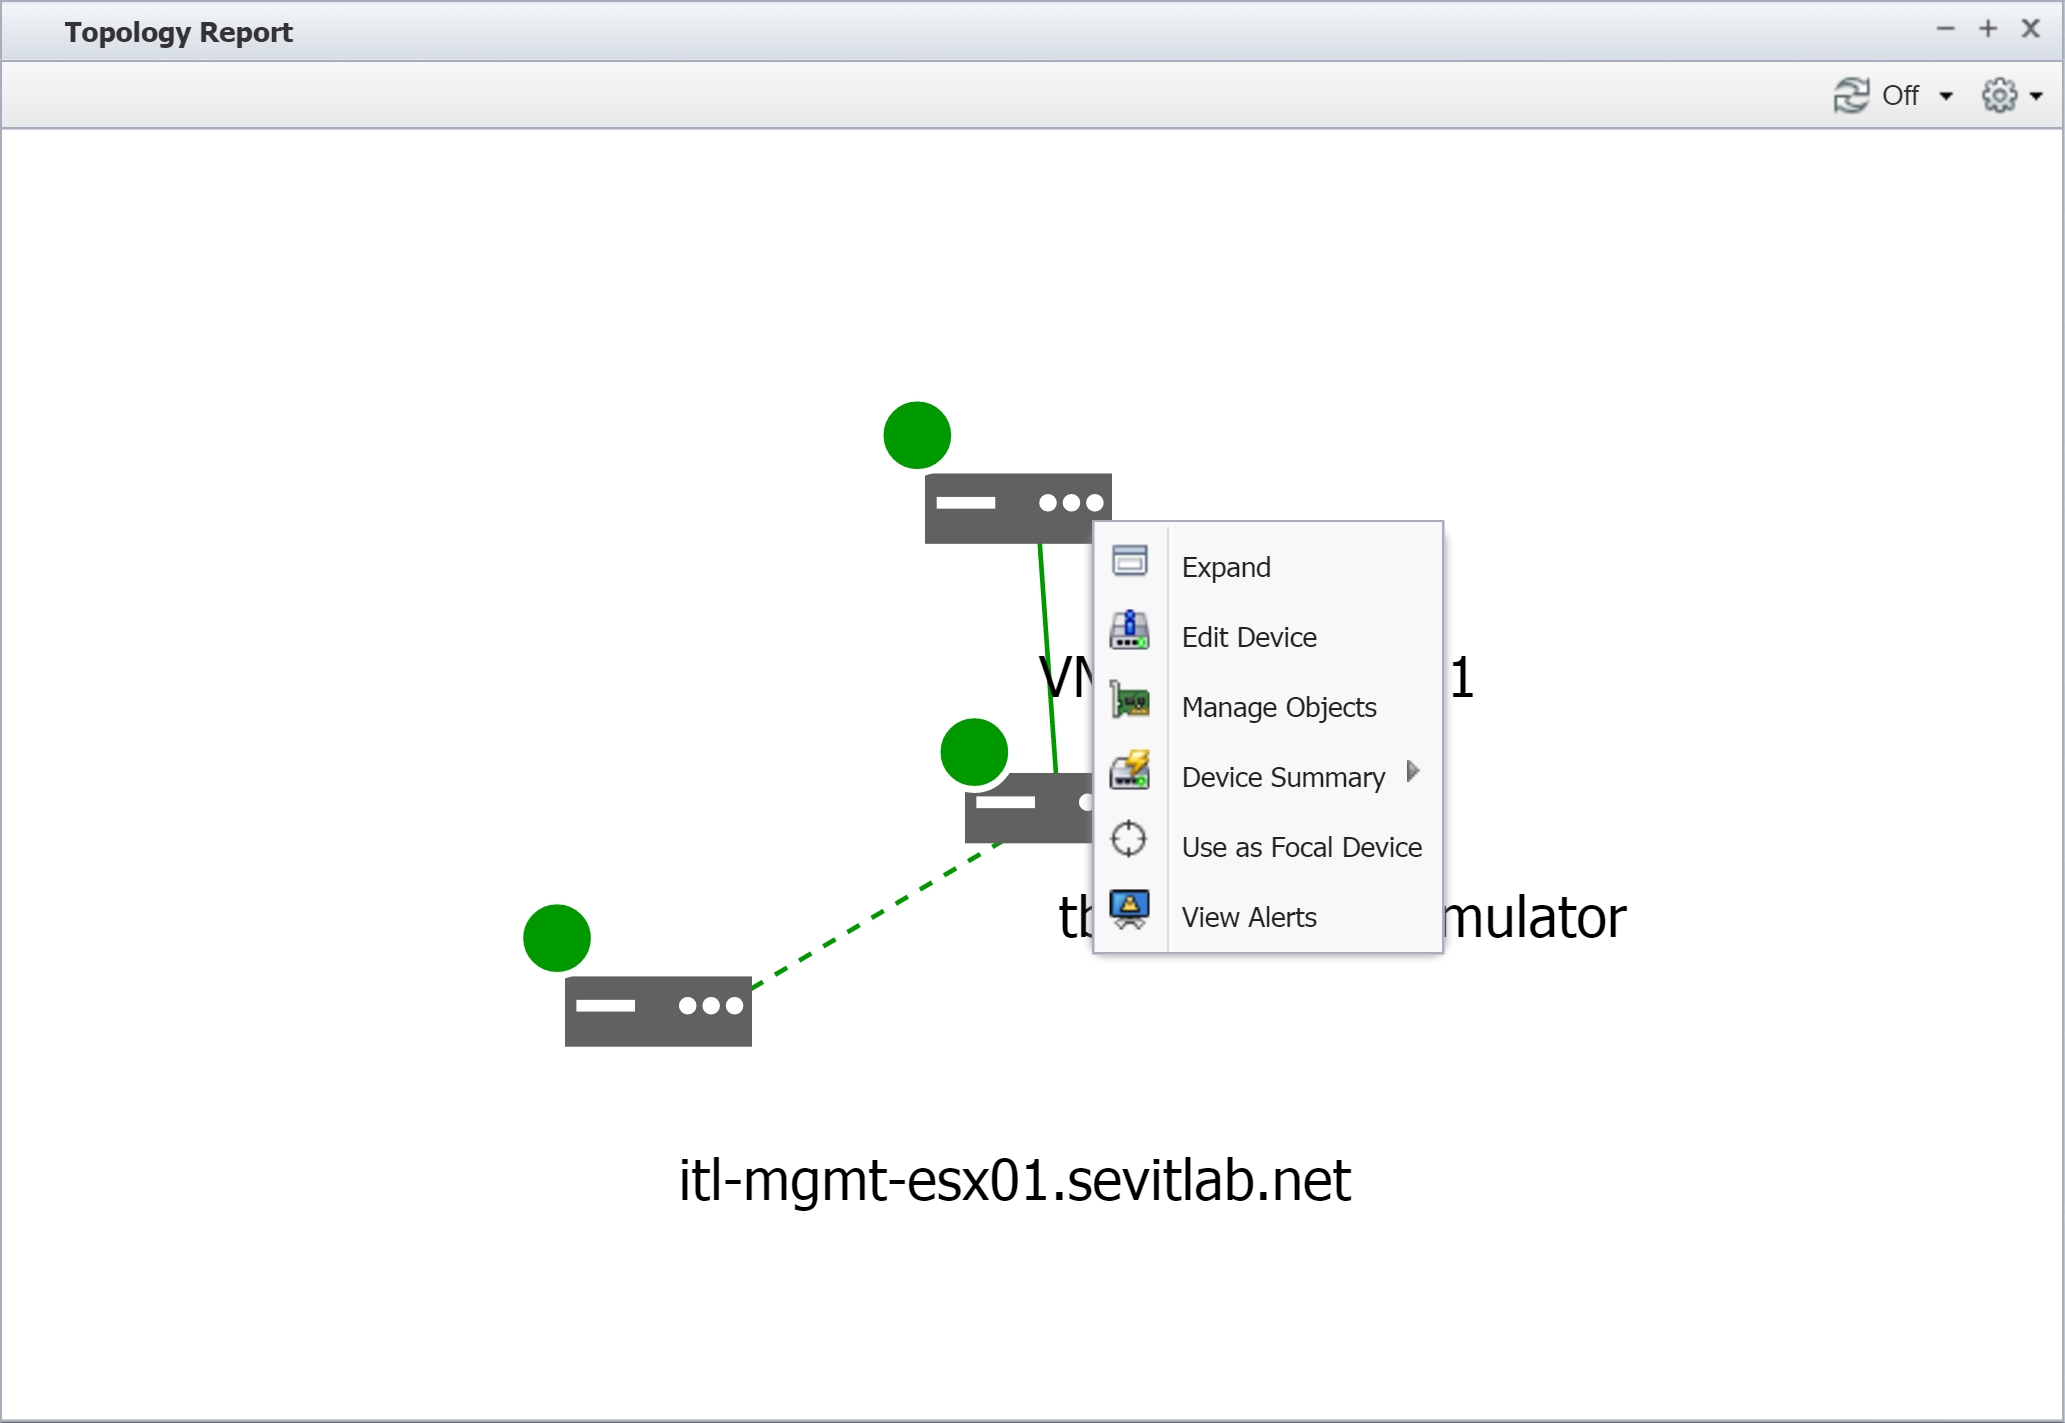
-
Select Expand to expand the number of hops displayed.
To decrease the number of hops displayed, click
in the upper right corner of the report attachment. Then go the Filters page on the Report Attachment Wizard. In the Number of Hops field, specify the number of hops to display.
-
To zoom in for a closer look, double click on the report attachment.
-
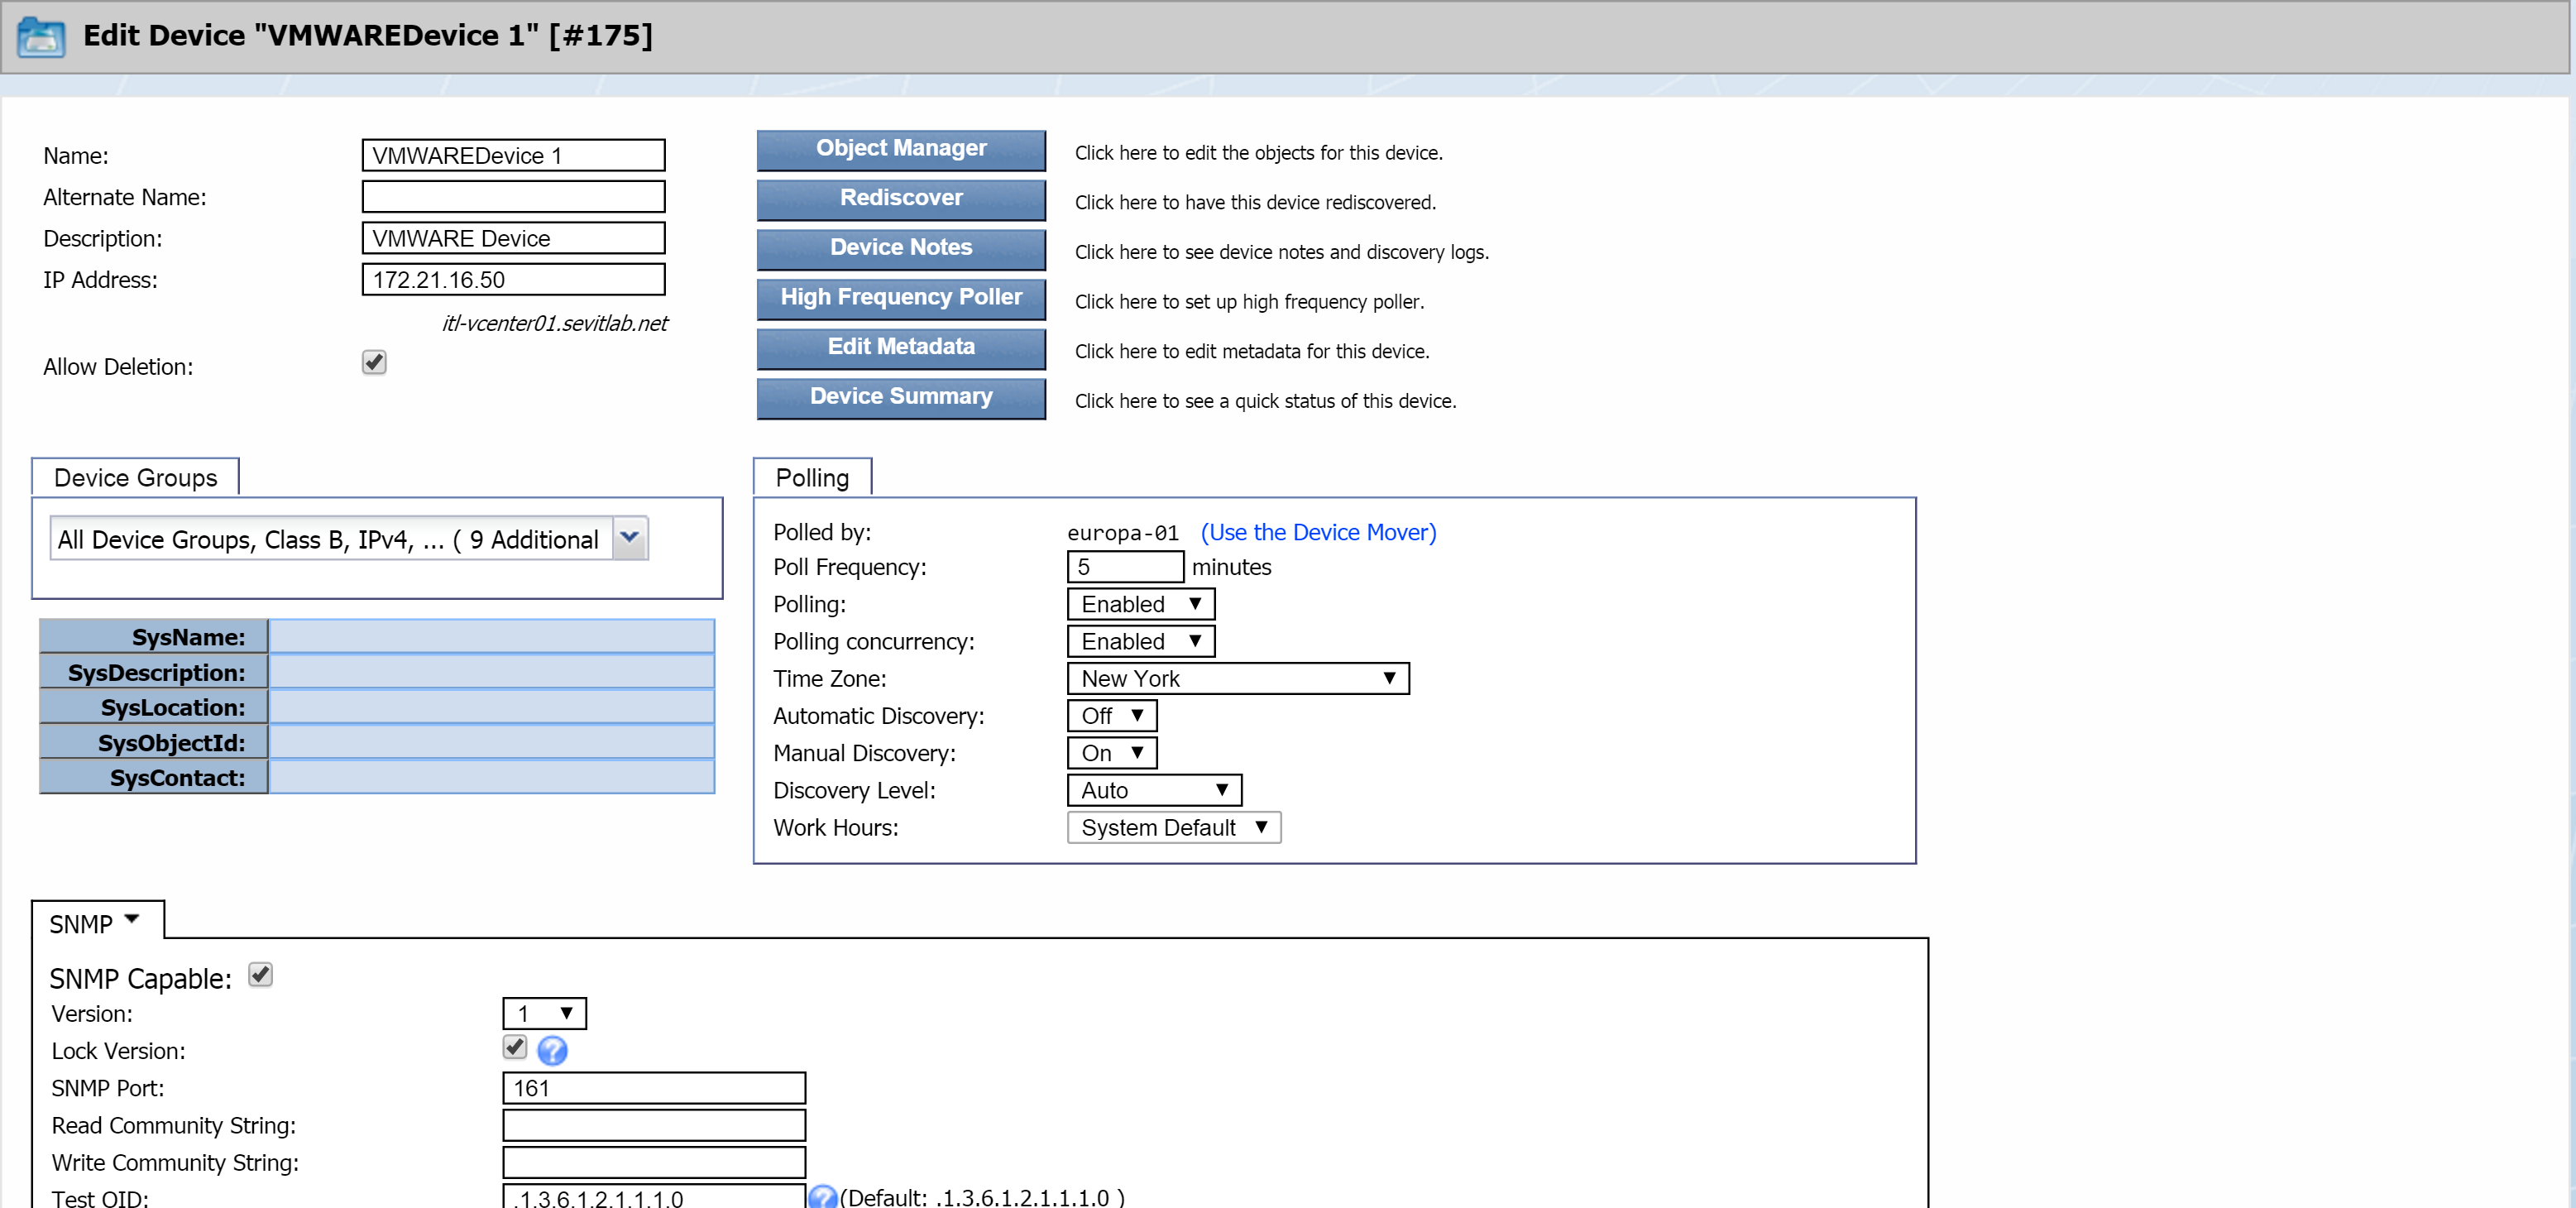
When you click on Edit Device, SevOne NMS displays the Edit Device page, where you can make changes to the device if necessary.
-
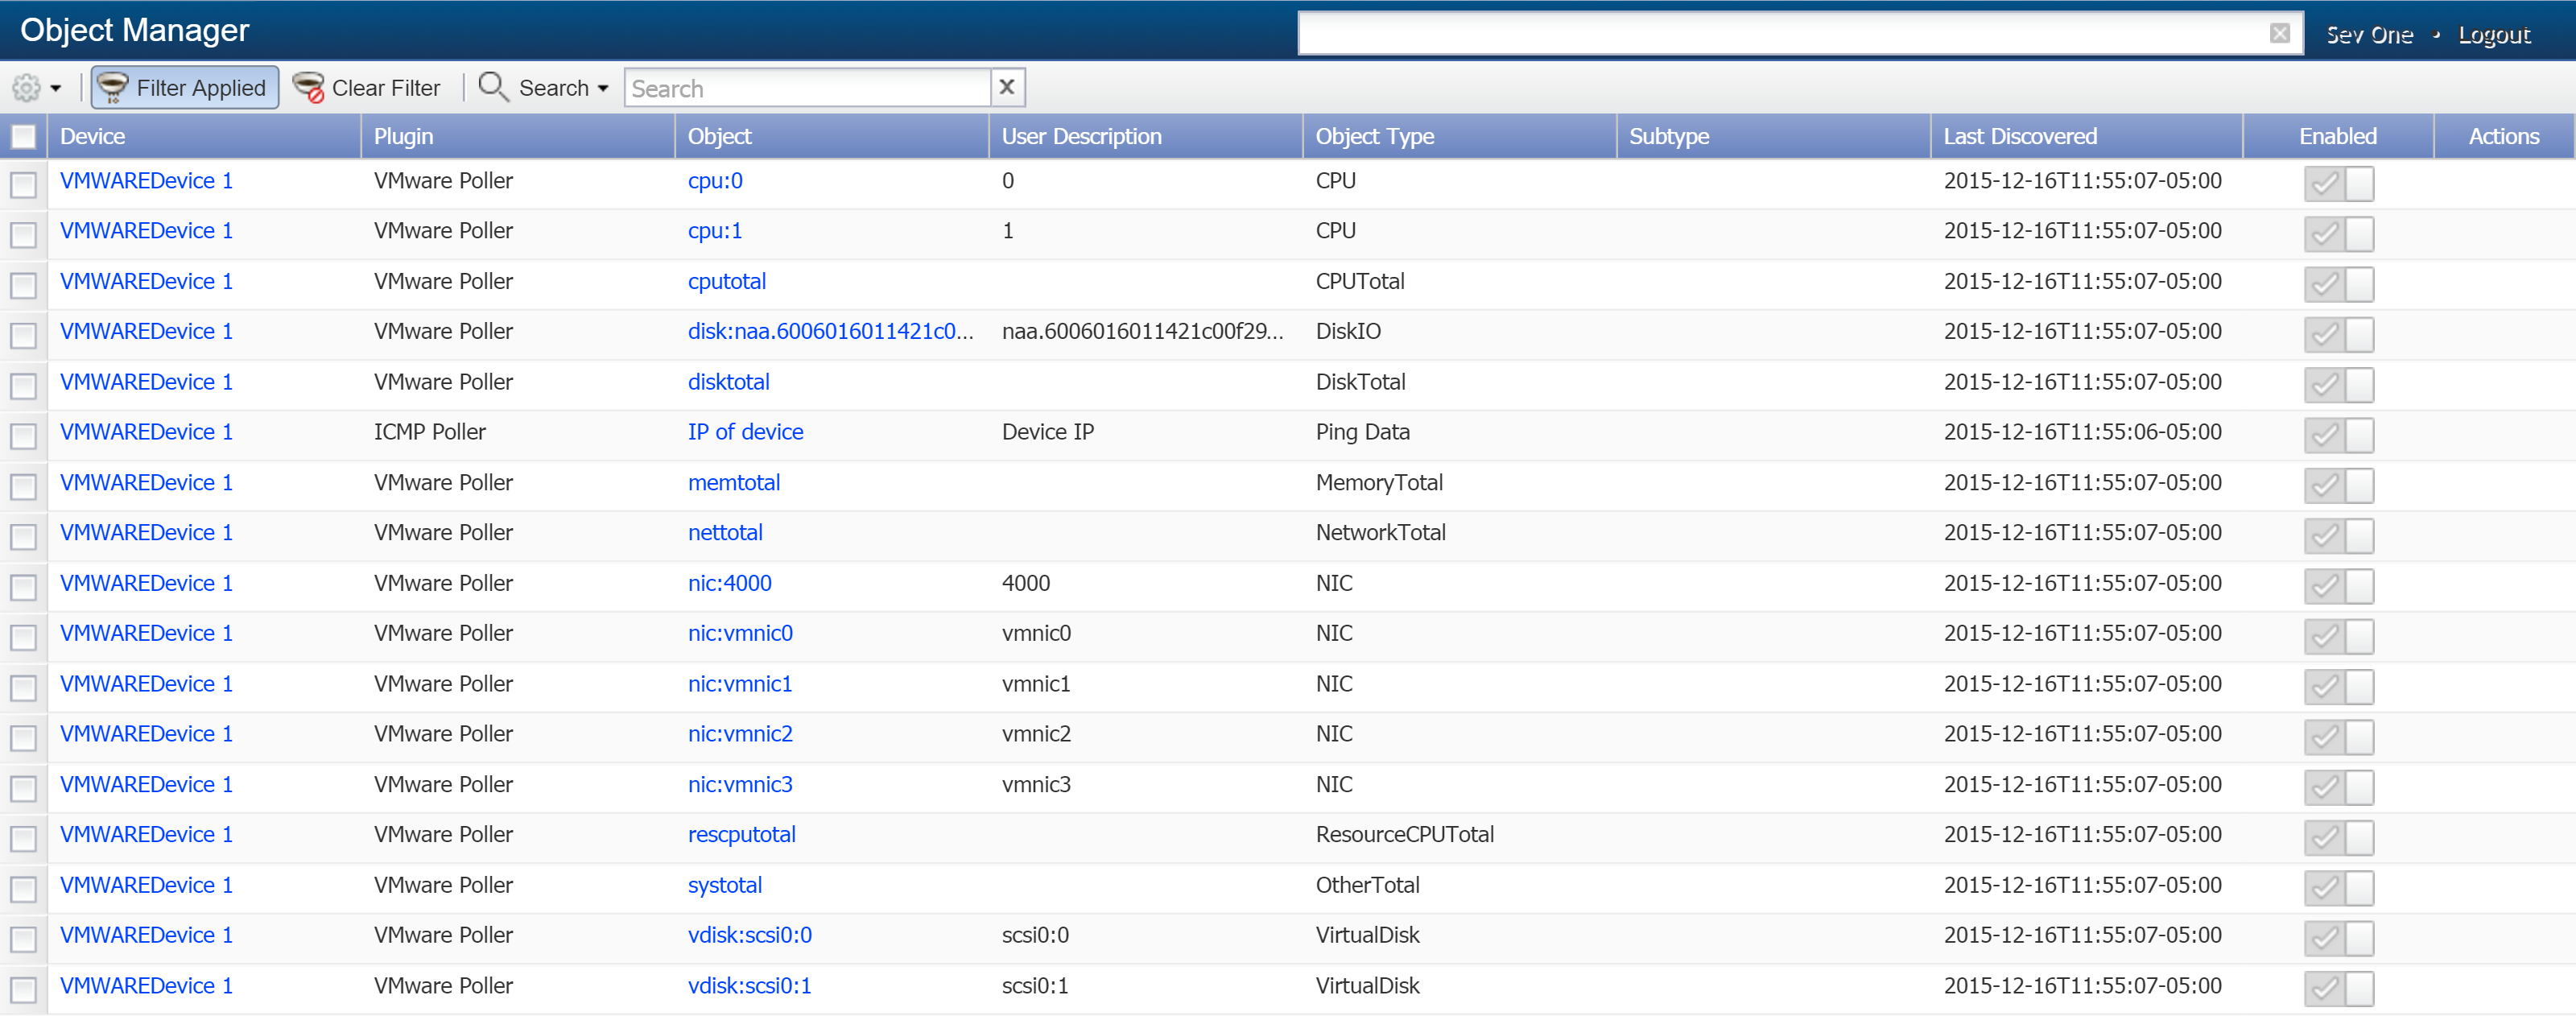
Click on Manage Objects to view the Object Manager page in SevOne NMS. The Object Manager page displays the objects for the device that you right-clicked on.
-
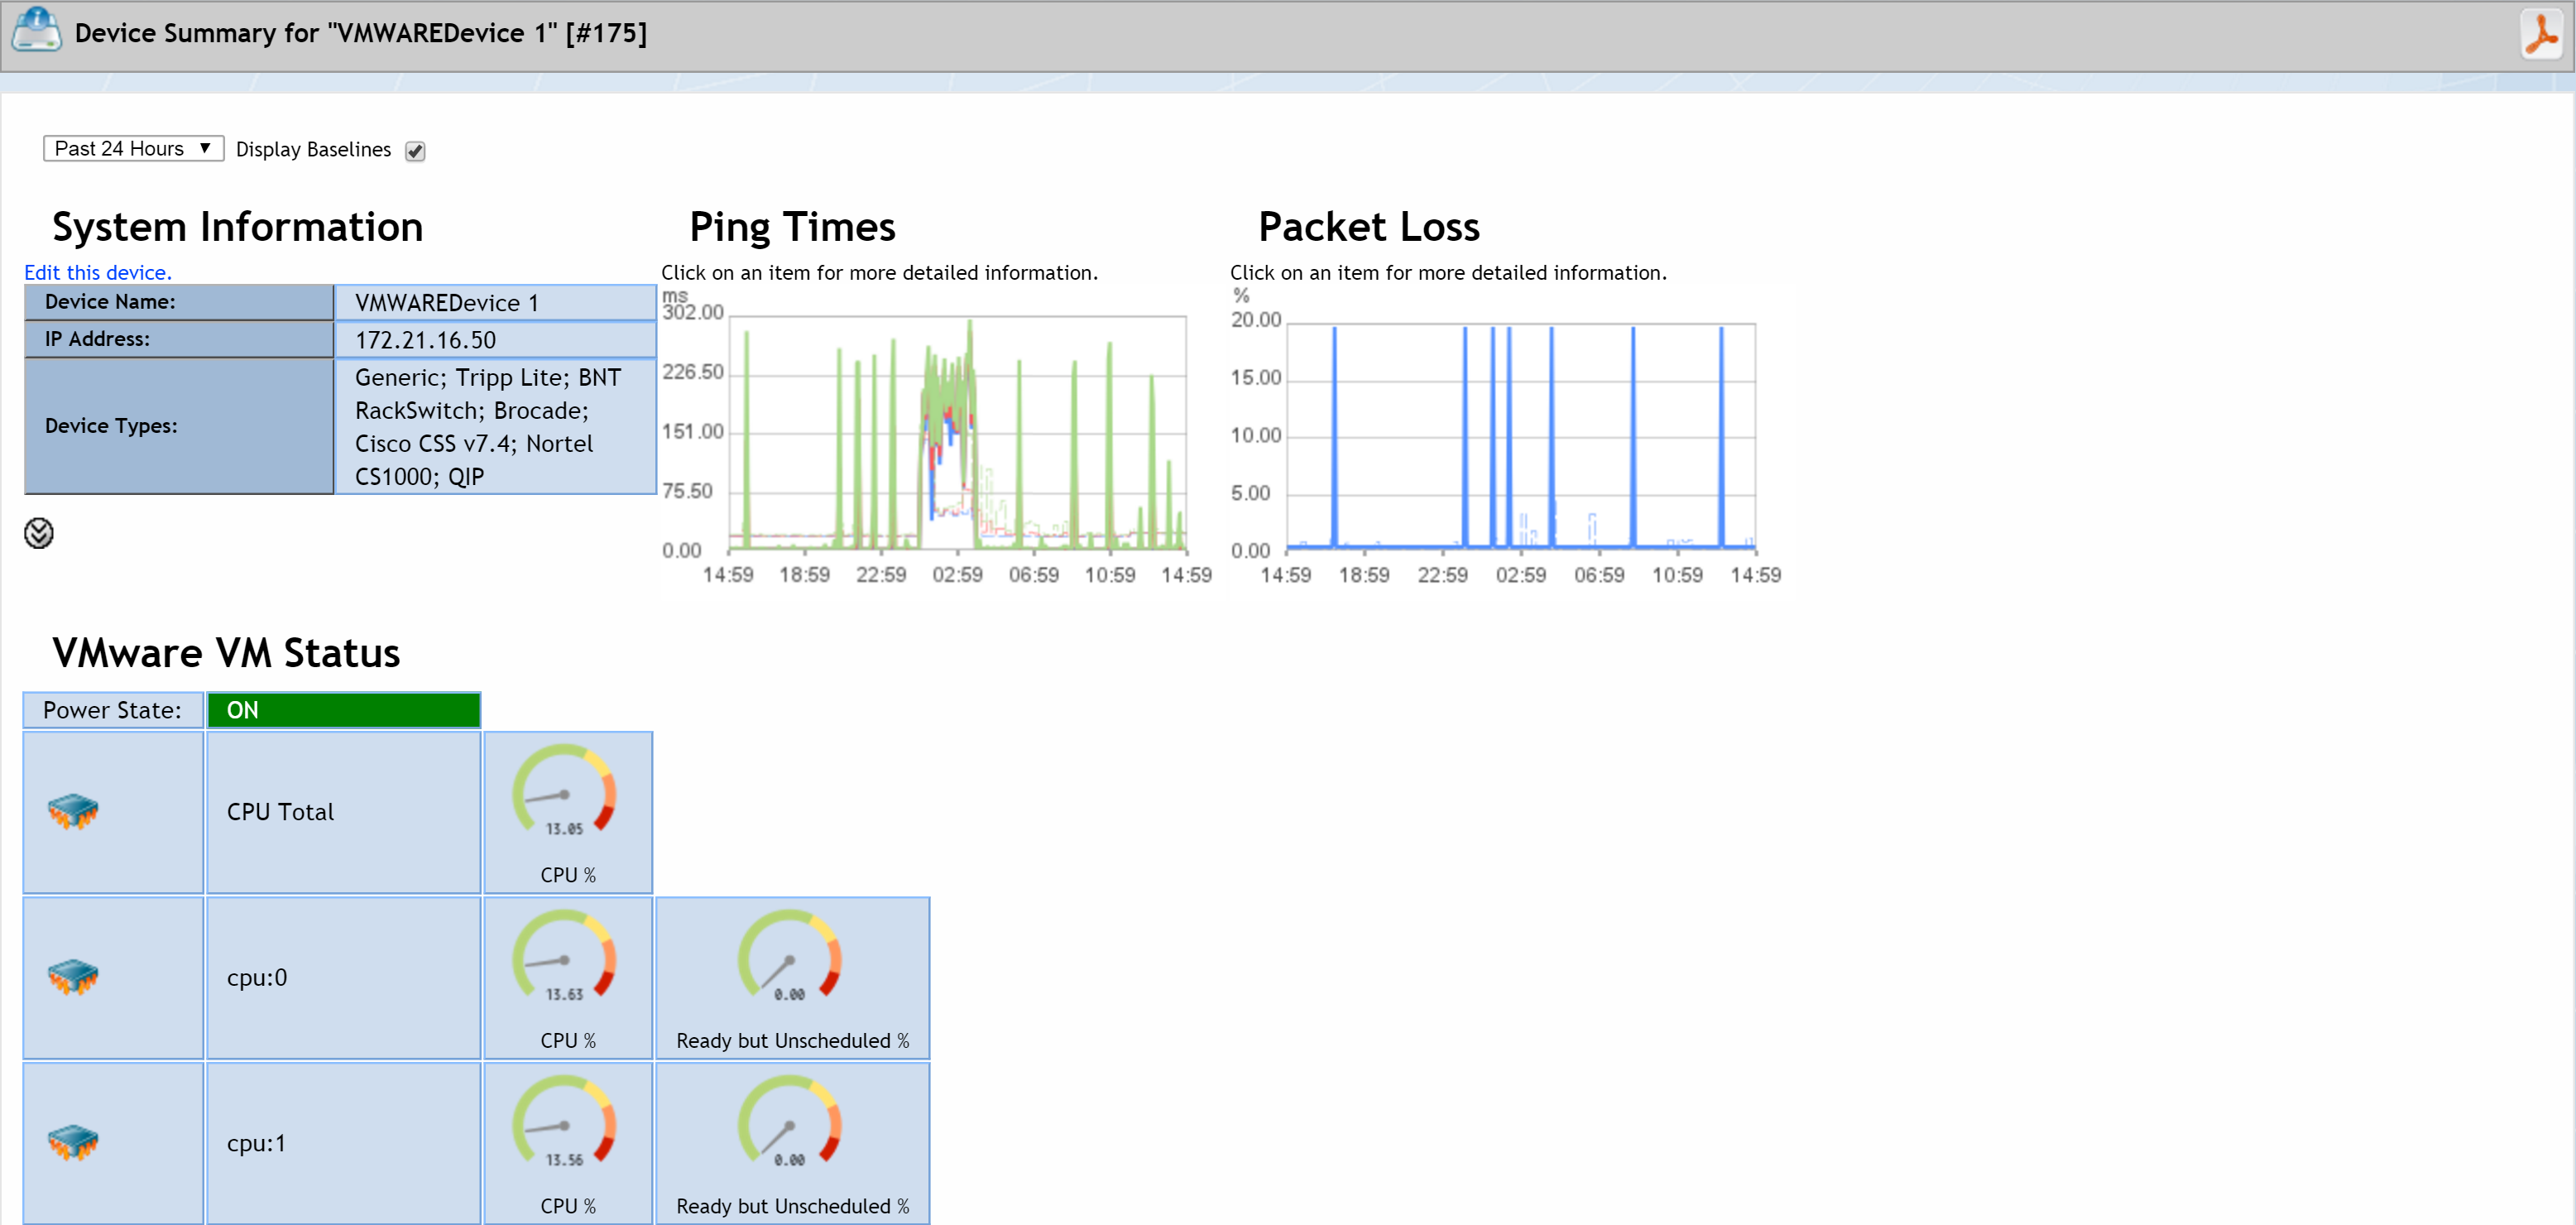
Click on Device Summary to display a link to the Device Summary as well as links to report templates if any exist for the device. Then click on the Device Summary link (or a report template link) to display the page in SevOne NMS.
-
Click on Use as Focal Device if you would like to designate the device as the focal device.
-
Click on View Alerts to display the Alerts page in SevOne NMS, where you can view any alerts for the device.
Topology Report Icons
On the Device Types page, you can assign an icon to a device type. This icon is used by Topology report attachments.
Perform the following steps to assign an icon to a device type.
-
From the navigation bar, click Monitoring Configuration and select Device Types.
-
On the left side of the page, under Device Types, select the check box for the device that you want to assign an icon to. You can also remove an existing icon. The device type icon appears before the device type name.
-
In the upper right corner of the page, click
 to display the Upload Device Type icon pop-up.
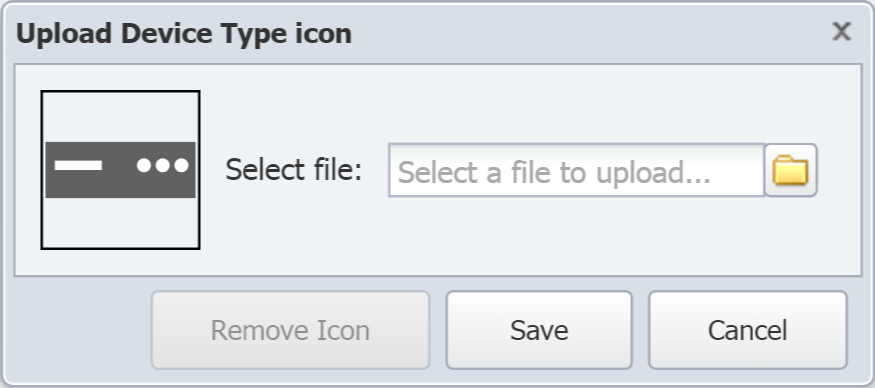
-
Click
 and navigate your file structure to locate the icon to assign to the device.
-
Once you have selected your icon, click Save. Your new icon should appear at the top of the page in front of the device type name.
-
Now when you create a Topology report attachment that includes a device belonging to that device type, you will see the icon that you added.