Table of Contents (Start)
- Topics
- Introducing SevOne
- Login
- Startup Wizard
- Dashboard
- Global Search - Advanced Search
- Report Manager
- Report Attachment Wizard
- Report Properties
- Report Interactions
- Instant Graphs
- TopN Reports
- Alerts
- Alert Archives
- Alert Summary
- Instant Status
- Status Map Manager
- Edit Maps
- View Maps
- FlowFalcon Reports
- NBAR Reports
- Logged Traps
- Unknown Traps
- Trap Event Editor
- Trap Destinations
- Trap Destination Associations
- Policy Browser
- Create and Edit Policies
- Webhook Definition Manager
- Threshold Browser
- Create and Edit Thresholds
- Probe Manager
- Discovery Manager
- Device Manager
- New Device
- Edit Device
- Object Manager
- High Frequency Poller
- Device Summary
- Device Mover
- Device Groups
- Object Groups
- Object Summary
- Object Rules
- VMware Browser
- AWS Plugin
- Azure Plugin (Public Preview)
- Calculation Plugin
- Database Manager
- Deferred Data Plugin
- DNS Plugin
- HTTP Plugin
- ICMP Plugin
- IP SLA Plugin
- JMX Plugin
- NAM
- NBAR Plugin
- Portshaker Plugin
- Process Plugin
- Proxy Ping Plugin
- SDWAN Plugin
- SNMP Plugin
- VMware Plugin
- Web Status Plugin
- WMI Plugin
- xStats Plugin
- Indicator Type Maps
- Device Types
- Object Types
- Object Subtype Manager
- Calculation Editor
- xStats Source Manager
- User Role Manager
- User Manager
- Session Manager
- Authentication Settings
- Preferences
- Cluster Manager
- Maintenance Windows
- Processes and Logs
- Metadata Schema
- Baseline Manager
- FlowFalcon View Editor
- Map Flow Objects
- FlowFalcon Views
- Flow Rules
- Flow Interface Manager
- MPLS Flow Mapping
- Network Segment Manager
- Flow Protocols and Services
- xStats Log Viewer
- SNMP Walk
- SNMP OID Browser
- MIB Manager
- Work Hours
- Administrative Messages
- Enable Flow Technologies
- Enable JMX
- Enable NBAR
- Enable SNMP
- Enable Web Status
- Enable WMI
- IP SLA
- SNMP
- SevOne Data Publisher
- Quality of Service
- Perl Regular Expressions
- Trap Revisions
- Integrate SevOne NMS With Other Applications
- Email Tips and Tricks
- SevOne NMS PHP Statistics
- SevOne NMS Usage Statistics
- Glossary and Concepts
- Map Flow Devices
- Trap v3 Receiver
- Guides
- Quick Start Guides
- AWS Quick Start Guide
- Azure Quick Start Guide (Public Preview)
- Data Miner Quick Start Guide
- Flow Quick Start Guide
- Group Aggregated Indicators Quick Start Guide
- IP SLA Quick Start Guide
- JMX Quick Start Guide
- Metadata Quick Start Guide
- RESTful API Quick Start Guide
- Self-monitoring Quick Start Guide
- SevOne NMS Admin Notifications Quick Start Guide
- SNMP Quick Start Guide
- Synthetic Indicator Types Quick Start Guide
- Topology Quick Start Guide
- VMware Quick Start Guide
- Web Status Quick Start Guide
- WMI Quick Start Guide
- xStats Quick Start Guide
- xStats Adapter - Accedian Vision EMS (TM) Quick Start Guide
- Deployment Guides
- Automated Build / Rebuild (Customer) Instructions
- Generate a Self-Signed Certificate or a Certificate Signing Request
- SevOne Best Practices Guide - Cluster, Peer, and HSA
- SevOne Data Platform Security Guide
- SevOne NMS Implementation Guide
- SevOne NMS Installation Guide - Virtual Appliance
- SevOne NMS Advanced Network Configuration Guide
- SevOne NMS Installation Guide
- SevOne NMS Port Number Requirements Guide
- SevOne NMS Upgrade Process Guide
- SevOne Physical Appliance Pre-Build BIOS and RAID Configuration Guide
- SevOne SAML Single Sign-On Setup Guide
- Cloud Platforms
- Other Guides
- Quick Start Guides
Object Types
The Object Types page enables you to manage the object types and the indicator types you want each plugin to poll. Object types enable a plugin to discover related objects on a device. Indicator types enable a plugin to collect data from the indicators on objects. SevOne NMS provides a starter set of object types and indicator types. SevOne NMS discovers devices and discovery manages the objects on the devices based on the plugins that are enabled for each device. Objects contain indicators that are polled to gather the measurement points of the physical and logical capabilities of a device.
To access the Object Types page from the navigation bar, click the Administration menu and select Monitoring Configuration, then Object Types.
In Object Types and Indicator Types, you can populate expressions in various fields. When variable(s) are evaluated using the S3 sytax, the content of the variable must not be a string OID. Rather, OID must be in numerical form. During Discovery, untranslated string OIDs do not return any results. However, OID literals in the string form are accepted. For details on S3 syntax, please refer to SNMP Quick Start Guide.
Object Types
Object types determine what objects are discovered on a device. Object discovery varies from plugin to plugin. You must enable object types for the JMX plugin and the WMI plugin on the Object Types page to discover JMX and WMI objects. You define objects for the Calculation plugin on the Calculation Editor. You define objects for the xStats plugin on the xStats Source Manager.
The Object Rules page enables you to define rules to disable, enable, or block discovery of objects and the Object Manager enables you to manage the objects on each device. The Cluster Manager > Cluster Settings tab enables you to disable polling of objects the SNMP plugin discovers to be operationally down or administratively down.
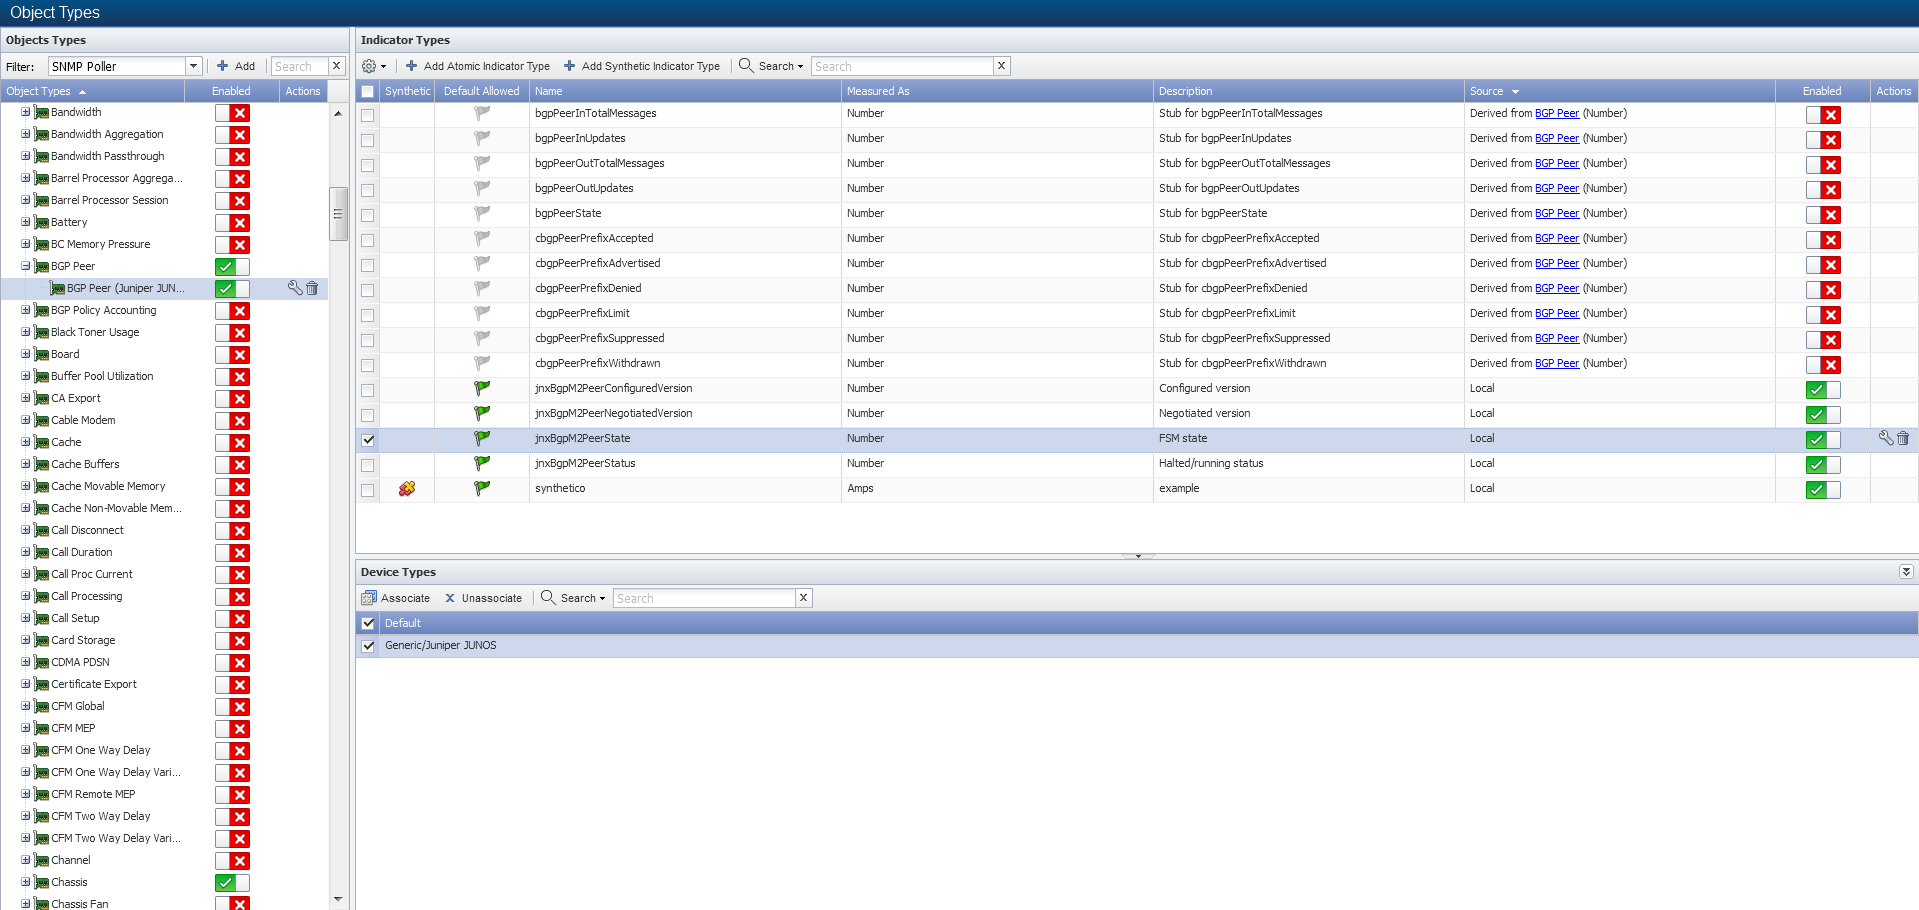
The Object Types list appears on the left and displays the object types for the filter you select above the list. Disabled object types are not discovered or polled and disabled objects do not count towards your license capacity. See the following sections for plugin specific object type management steps.
-
Filter - Click the Filter drop-down and select the plugin whose object types you want to manage. Please see the plugin specific sections below.
-
Add and
 - Click to display the plugin specific object type pop-up that enables you to add or edit the object type. Please see the plugin specific sections below.
 -
Object Types - Displays the list of object type names. Click an object type name to display the associated indicator types and device types on the right. Names with bold italic font cannot be edited or deleted.
-
Enabled - Displays one of the following:
-
 - Object type is enabled and the objects in the object type can be polled on devices for which you enable the plugin.
 -
 - Object type is disabled and no metrics are collected.
 -
 - Object type is enabled and
required
for the plugin. You cannot disable, edit, or delete the object type. This object type and its indicator types are polled when you enable the plugin for a device.
- Object type is enabled and
required
for the plugin. You cannot disable, edit, or delete the object type. This object type and its indicator types are polled when you enable the plugin for a device.
-
Indicator Types
Indicator types determine what indicators are polled for an object type. The indicator types list displays the indicator types for the object type you select in the Object Types list. Please see the plugin specific sections below. There are two types of indicator types.
-
Atomic indicator types are measured directly by the plugin.
-
Synthetic indicator types are indicators whose value is dependent upon other indicators; atomic and/or synthetic. Synthetic indicators enable you to combine the data from several indicators into one synthetic indicator so that SevOne NMS can properly evaluate indicators such as Percentage Loss, Percent Error, Percent Idle, and other high precision metrics.
The Indicator Types section provides controls to manage indicator types and displays the following information.
-
 - Select the check box for each indicator type to manage, click
, and select one of the following options.
- Select the check box for each indicator type to manage, click
, and select one of the following options. -
Select Delete to delete the indicator types and all associated indicators.
-
Select Turn On for Every Device to allow all devices, for which you enable the applicable plugin, to discover the indicators associated with the indicator types at the next discovery and poll data. You can only turn on indicator types that display
in the Enabled column. -
Select Turn Off for Every Device to stop polling the indicators associated with the indicator types on all devices at the next discovery.
-
Select Enable to enable the ability to poll all indicators associated with the indicator types.
-
Select Disable to prevent the ability to poll the indicators associated with the indicator types.
-
Select Convert to Atomic to convert a synthetic indicator type to an atomic indicator type.
-
Select Convert to Synthetic to convert an atomic indicator type to a synthetic indicator type.
-
Select Implement to maintain the indicator types of an SNMP poller child level object type independently from the indicator type whose definition it derived from a higher level in the SNMP object type hierarchy.
-
-
Add Atomic Indicator and
- Atomic indicators are measured directly by the plugin. Please see the plugin specific sections below. -
Add Synthetic Indicator Type and
- Synthetic indicators enable you to perform math on multiple metrics collected from multiple indicators on a single monitored object in order to calculate new KPIs. You can define synthetic indicator types for the following plugins: Calculation, Deferred Data, JMX, SNMP, WMI, and xStats. Please refer the Synthetic Indicator Types section. -
Synthetic - Displays
 if the indicator type is synthetic. The column appears clear if the indicator type is atomic. Please see the Synthetic Indicator Types section.
 -
Default Allowed - Indicates if the plugin polls the indicator type by default on devices when you enable the plugin for a device. Click the icon to change the Default Allowed setting.
-
 - The plugin attempts to poll the indicator type by default on devices when you enable the plugin for a device. The indicator type appears with a check mark on the Indicator Type Maps page.
 -
 - You must manually enable the plugin to poll the indicator type for each device from the Edit Device page on the Indicator Type Maps page.
 -
 - Indicator type is disabled and the plugin does not poll the indicator type. If you enable the indicator type, the plugin attempts to poll the indicator type by default on devices when you enable the plugin for a device.
-
-
Name - Displays the indicator type name.
-
Description - Displays the indicator type description.
-
Source - Displays Local for indicator types that have not inherited their definition from a higher level object type. Displays Implemented From <name> for indicator types that have inherited aspects from an object type that is higher up in the Object Types hierarchy. The Name of the implementing object type appears as a link that navigates you to the object type from which the indicator type derived its definition.
-
Enabled - Displays one of the following:
-
- Indicator type is enabled and, if the object type is enabled, the indicator type can be polled on devices for which you enable the plugin.
-
- Indicator type is disabled and no data is collected.
-
- Indicator type is enabled and required for the plugin. You cannot disable, edit, or delete the indicator type. When you enable the plugin for a device, the indicators for this indicator type are polled.
-
Manage Object Types and Atomic Indicator Types
Object types and indicator types are plugin specific. You can add, edit, and delete object types and indicator types for the following plugins: Calculation, Deferred Data, JMX, SNMP, WMI, and xStats. You can view details for the object types and indicator types for the other plugins to determine if the data they poll is relevant to your network monitoring requirements. Please see the following plugin specific sections for object type management steps and for atomic indicator type management steps. Please refer to Synthetic Indicator Types section for synthetic indicator type management steps.
Calculation Poller
The Calculation plugin polls the indicator types for the object types you enable. Calculation objects are composed of variables that represent the calculations of metrics other plugins poll from multiple indicators. To poll Calculation data, define the Calculation object types on this page, define Calculation objects on the Calculation Editor page, and enable the Calculation plugin for the device on the New Device page or on the Edit Device page.
Calculation Object Types
Perform the following steps to manage Calculation object types. Discovery uses the object "objectTypeId" && "group_id" to determine if a Calculation object is a new object or an existing object with a new moniker.
-
Click the Filter drop-down and select Calculation Poller to display the Calculation object types in the Object Types list.
-
Click Add or click
to display the Add/Edit Calculation Object Type pop-up. -
In the Name field, enter the Calculation object type name.
-
Select the check box for the Note field to enable it for editing. Enter any additional information you would like to include.
-
Click Save.
Calculation Atomic Indicator Types
Perform the following steps to manage Calculation atomic indicator types. For Calculation synthetic indicator types, please refer to Synthetic Indicator Types section below.
-
Click the Filter drop-down and select Calculation Poller to display the Calculation object types in the Object Types hierarchy.
-
Click on an object type to display its indicator types on the right.
-
Click Add Atomic Indicator Type or click
next to an atomic indicator type to display the Add/Edit Calculation Indicator Type pop-up. -
In the Indicator Name field, enter the name of the indicator type.
-
In the Description field, enter the name to display.
-
The Indicator Type field displays Gauge. All Calculation indicator types are gauges.
-
Click the Measured As drop-down and select the unit of measure for the indicator type.
-
Click the Display As drop-down and select the unit of measure to display for the indicator type.
-
Select the Default allowed for new devices check box to have the Calculation plugin poll the indicator type by default when the object type is enabled and you enable the Calculation plugin for a device.
-
In the Note field, enter any additional information you would like to include.
-
In field Allow Netflow Mapping, select Yes to allow the user to automatically map flow device with the SNMP device IP address. By default, it is set to No. This feature enables custom object / indicator mapping to flow interfaces. However, it is not required for device mapping.
-
If Yes, you can set field Direction to All (ingress & egress), Incoming (ingress), or Outgoing (egress).
-
-
Click Save.
The Device Types section is irrelevant for Calculation poller object types.
Deferred Data
The Deferred Data object types are enabled by default. The Deferred Data plugin uses API scripts you define to import third party data. Contact your SevOne Sales Engineer to schedule API training. To poll deferred data devices, enable the Deferred Data plugin for the device on the New Device or on the Edit Device page.
Deferred Data Object Types
Perform the following steps to manage Deferred Data object types.
-
Click the Filter drop-down and select Deferred Data to display the Deferred Data object types in the Object Types list.
-
Click Add or click
to display the Add/Edit Deferred Data Object Type pop-up. -
In the Name field, enter the object type name.
-
Select the check box for the Note field to enable it for editing. Enter any additional information you would like to include.
-
Click Save.
Deferred Data Atomic Indicator Types
Perform the following steps to manage Deferred Data indicator types. For Deferred Data synthetic indicator types, please see the Synthetic Indicator Types section below.
-
Click the Filter drop-down and select Deferred Data to display the Deferred Data object types in the Object Types list.
-
Click on an object type to display its indicator types on the right.
-
Click Add Atomic Indicator Type or click
to display the Add/Edit Deferred Data Indicator Type pop-up. -
In the Indicator Name field, enter the name of the indicator type.
-
In the Description field, enter the name to display.
-
Click the Indicator Type drop-down.
-
Select GAUGE for indicators that have specific values when polled.
-
Select COUNTER32 for 32 bit indicators that continue to increment. If you select this option, you can select the Has Precalculated Deltas check box to total the delta/differences between polls to provide the ability to graph things like the number of errors in a day, for example.
-
Select COUNTER64 for 64 bit indicators that continue to increment. If you select this option, you can select the Has Precalculated Deltas check box.
-
-
Click the Measure As drop-down and select a data unit.
-
Click the Display As drop-down and select a display unit.
-
Select the Maximum Value check box to indicate the indicator type has a maximum value. You must select this check box if you want to use the indicators in this indicator type for percentile metrics.
-
Select the Default allowed for new devices check box to have the Deferred Data plugin poll the indicator type by default when the object type is enabled and you enable the Deferred Data plugin for a device.
-
In the Note field, enter any additional information you would like to include.
-
In field Allow Netflow Mapping, select Yes to allow the user to automatically map flow device with the SNMP device IP address. By default, it is set to No. This feature enables custom object / indicator mapping to flow interfaces. However, it is not required for device mapping.
-
If Yes, you can set field Direction to All (ingress & egress), Incoming (ingress), or Outgoing (egress).
-
-
Click Save.
The Device Types section is irrelevant for Deferred Data poller object types.
DNS Object Poller
The DNS object type is enabled by default. There is one DNS object type: DNS Data. To poll DNS devices, enable the DNS plugin for the device on the New Device page or on the Edit Device page.
DNS Object Types and Indicator Types
You cannot add, edit, or delete DNS object types or DNS indicator types.
-
Click the Filter drop-down and select DNS Poller to display the DNS Data object type in the Object Types list.
-
Click on the DNS Data object type to display its indicator types on the right.
-
Click
to display the DNS Indicator Type pop-up. -
View the following DNS indicator type details.
-
Indicator Name - Displays the name of the indicator type.
-
Description - Displays the name to display.
-
Indicator Type - Displays the indicator type.
-
Measure As - Displays the indicator type data unit.
-
Display As - Displays the indicator type display unit.
-
Default allowed for new devices - Check box appears selected and the DNS plugin polls the indicator type by default.
-
Note - Displays any additional information.
-
-
Click Cancel.
The Device Types section is irrelevant for DNS poller object types.
HTTP Poller
The HTTP object type is enabled by default. There is one HTTP object type: Website Data. To poll HTTP devices, enable the HTTP plugin for the device on the New Device page or on the Edit Device page. The Cluster Manager > Peer Settings tab enables you associate each peer with an HTTP proxy server. The Authentication Settings page enables you to upload certificates to monitor https.
HTTP Object Types and Indicator Types
You cannot add, edit, or delete HTTP object types or HTTP indicator types.
-
Click the Filter drop-down and select HTTP Poller to display the Website Data object type in the Object Types list.
-
Click on the Website Data object type to display its indicator types on the right.
-
Click
to display the HTTP Indicator Type pop-up. -
View the following HTTP indicator type details.
-
Indicator Name - Displays the name of the indicator type.
-
Description - Displays the name to display.
-
Indicator Type - Displays the indicator type.
-
Measure As - Displays the indicator type data unit.
-
Display As - Displays the indicator type display unit.
-
Default allowed for new devices - Check box appears selected and the HTTP plugin polls the indicator type by default.
-
Note - Displays any additional information.
-
-
Click Cancel.
The Device Types section is irrelevant for HTTP poller object types.
ICMP Poller
The ICMP object type is enabled by default. There is one ICMP object type: Ping Data. To poll ICMP devices, enable the ICMP plugin for the device on the New Device page or on the Edit Device page.
ICMP Object Types and Indicator Types
You cannot add, edit, or delete ICMP object types or ICMP indicator types.
-
Click the Filter drop-down and select ICMP Poller to display the Ping Data object type in the Object Types list.
-
Click on the Ping Data object type to display its indicator types on the right.
-
Click
to display the ICMP Indicator Type pop-up. -
View the following ICMP indicator type details.
-
Indicator Name - Displays the name of the indicator type.
-
Description - Displays the name to display.
-
Indicator Type - Displays the indicator type.
-
Measure As - Displays the indicator type data unit.
-
Display As - Displays the indicator type display unit.
-
Default allowed for new devices - Check box appears selected and the ICMP plugin polls the indicator type by default.
-
Note - Displays any additional information.
-
-
Click Cancel.
The Device Types section is irrelevant for ICMP poller object types.
IP SLA Poller
IP SLA object types are enabled by default. To poll IP SLA devices, enable the IP SLA plugin for the device on the New Device page or on the Edit Device page. The Probe Manager enables you to manage IP SLAs.
IP SLA Object Types and Indicator Types
SevOne NMS provides the following IP SLA object types.
-
DHCP
-
DLSw
-
DNS
-
Echo
-
Ethernet Jitter
-
Ethernet Ping
-
FTP
-
HTTP
-
ICMP Jitter
-
RTP
-
TCP Connect
-
UDP Echo
-
UDP Jitter
-
Video
-
VoIP
You cannot add, edit, or delete IP SLA object types or IP SLA indicator types. Discovery uses the object "objectTypeId" && "isSevone" && ("type" && "owner" && "tag" && (! foundObject->isDuplicate || (foundObject->isDuplicate && snmpObjectId))) to determine if an IP SLA object is a new object or an existing object with a new moniker.
-
Click the Filter drop-down and select IP SLA Poller to display the IP SLA object types in the Object Types list.
-
Click on an object type display its indicator types on the right.
-
Click
to display the IP SLA Indicator Type pop-up. -
View the following IP SLA indicator type details.
-
Indicator Name - Displays the name of the indicator type.
-
Description - Displays the name to display.
-
Indicator Type - Displays the indicator type.
-
Measure As - Displays the indicator type data unit.
-
Display As - Displays the indicator type display unit.
-
Default allowed for new devices - Check box appears selected and the IP SLA plugin polls the indicator type by default.
-
Note - Displays any additional information.
-
-
Click Cancel.
The Device Types section is irrelevant for IP SLA poller object types.
JMX Poller
JMX object types are disabled by default. The JMX plugin polls the indicator types associated with the JMX object types you enable. To poll JMX devices, enable devices to send JMX data to SevOne NMS, enable the JMX object types on this page, and enable the JMX plugin for the device on the New Device page or on the Edit Device page.
JMX Object Types
Perform the following steps to manage JMX object types. Discovery uses the object "jmx_name" to determine if a JMX object is a new object or an existing object with a new moniker.
-
Click the Filter drop-down and select JMX Poller to display the JMX object types in the Object Types list.
-
Click Add or click
to display the Add/Edit JMX Object Type pop-up. -
In the Name field, enter the name of the object type.
-
In the Domain field, enter the domain of the object type.
-
In the Type field enter the type of the object type.
-
In the Class Name field, enter the class name of the object type.
-
In the Alias field enter the alias of the object type.
-
Select the Enabled check box to enable the JMX plugin to poll the indicator types in the object type.
-
Select the check box for the Note field to enable it for editing. Enter any additional information you would like to include.
-
Click Save.
JMX Atomic Indicator Types
Perform the following steps to manage JMX atomic indicator types. For JMX synthetic indicator types, please see the Synthetic Indicator Types section below.
-
Click the Filter drop-down and select JMX Poller to display the JMX object types in the Object Types list.
-
Click on an object type to display its indicator types on the right.
-
Click Add Atomic Indicator Type or click
to display the Add/Edit JMX Indicator Type pop-up. -
In the Indicator Name field enter the name of the indicator type.
-
In the Description field, enter the name to display.
-
Click the Indicator Type drop-down.
-
Select GAUGE for indicators that have specific values when polled.
-
Select COUNTER32 for 32 bit indicators that continue to increment. If you select this option, you can select the Has Precalculated Deltas check box to total the delta/differences between polls to provide the ability to graph things like the number of errors in a day, for example.
-
Select COUNTER64 for 64 bit indicators that continue to increment. If you select this option, you can select the Has Precalculated Deltas check box.
-
-
Click the Measured As drop-down and select a data unit.
-
Click the Display As drop-down and select a display unit.
-
Select the Maximum Value check box to indicate the indicator type has a maximum value. You must select this check box if you want to use the indicators in this indicator type for percentile metrics.
-
Select the Default allowed for new devices check box to have the JMX plugin poll the indicator type by default when the object type is enabled and you enable the JMX plugin for a device.
-
In the Note field, enter any additional information you would like to include.
-
In field Allow Netflow Mapping, select Yes to allow the user to automatically map flow device with the SNMP device IP address. By default, it is set to No. This feature enables custom object / indicator mapping to flow interfaces. However, it is not required for device mapping.
-
If Yes, you can set field Direction to All (ingress & egress), Incoming (ingress), or Outgoing (egress).
-
-
Click Save.
The Device Types section is irrelevant for JMX poller object types.
MySQL Database Poller
MySQL Database object types are enabled by default. To poll MySQL Database devices, enable the Database plugin for the device on the New Device page or on the Edit Device page.
MySQL Database Object Types and Indicator Types
SevOne NMS provides the following MySQL object types.
-
MySQL Server
-
My SQL Server: Command Statistics
-
MySQL Server: InnoDB Statistics
-
MySQL Server: SSL Statistics
You cannot add, edit, or delete MySQL Database object types or MySQL Database indicator types. Discovery uses the object "objectTypeId" && "databaseId" to determine if a MySQL object is a new object or an existing object with a new moniker.
-
Click the Filter drop-down and select MySQL Database Poller to display the MySQL Database object types in the Object Types list.
-
Click on an object type to display its indicator types on the right.
-
Click
to display the MySQL Database Indicator Type pop-up. -
View the following MySQL Database indicator type details.
-
Indicator Name - Displays the name of the indicator type.
-
Description - Displays the name to appear.
-
Indicator Type - Displays the indicator type.
-
Measure As - Displays the indicator type data unit.
-
Display As - Displays the indicator type display unit.
-
Default allowed for new devices - Check box appears selected and the MySQL Database plugin polls the indicator type by default.
-
Note - Displays any additional information.
-
-
Click Cancel.
The Device Types section is irrelevant for MySQL Database poller object types.
NBAR Poller
The NBAR object type is enabled by default. There is one NBAR object type: NBAR Data. To poll NBAR devices, enable the device to send NBAR data to SevOne NMS and enable both the NBAR plugin and the SNMP plugin for the device on the New Device page or on the Edit Device page.
NBAR Object Types and Indicator Types
You cannot add, edit, or delete NBAR object types or NBAR indicator types. Discovery uses the object 2 of 3 match on "name", "description", and "snmpObjectId" to determine if an NBAR object is a new object or an existing object with a new moniker.
-
Click the Filter drop-down and select NBAR Poller to display the NBAR Data object type in the Object Types list.
-
Click on the NBAR Data object type to display its indicator types on the right.
-
Click
to display the NBAR Indicator Type pop-up. -
View the following NBAR indicator type details.
-
Indicator Name - Displays the name of the indicator type.
-
Description - Displays the name to display.
-
Indicator Type - Displays the indicator type.
-
Measure As - Displays the indicator type data unit.
-
Display As - Displays the indicator type display unit.
-
Maximum Value - Check box appears selected when the indicator type has a maximum value.
-
Default allowed for new devices - Check box appears selected and the NBAR plugin polls the indicator type by default.
-
Note - Displays any additional information.
-
-
Click Cancel.
The Device Types section is irrelevant for NBAR poller object types.
Oracle Database Poller
Oracle Database object types are enabled by default. To poll Oracle Database devices, enable the Database plugin for the device on the New Device page or on the Edit Device page.
Oracle Database Object Types and Indicator Types
SevOne NMS provides the following Oracle Database object types.
-
Oracle Statistics
-
Oracle Tablespace
You cannot add, edit, or delete Oracle Database object types or Oracle Database indicator types. Discovery uses the object "objectTypeId" && "databaseId" && "identifier" to determine if an Oracle Database object is a new object or an existing object with a new moniker.
-
Click the Filter drop-down and select Oracle Database Poller to display the object types in the Object Types list.
-
Click on an object type to display its indicator types on the right.
-
Click
to display the Oracle Database Indicator Type pop-up. -
View the following Oracle Database indicator type details.
-
Indicator Name - Displays the name of the indicator type.
-
Description - Displays the name to display.
-
Indicator Type - Displays the indicator type.
-
Measure As - Displays the indicator type data unit.
-
Display As - Displays the indicator type display unit.
-
Maximum Value - Check box appears selected when the indicator type has a maximum value.
-
Default allowed for new devices - Check box appears selected and the Oracle Database plugin polls the indicator type by default.
-
Note - Displays any additional information.
-
-
Click Cancel.
The Device Types section is irrelevant for Oracle Database poller object types.
Portshaker Poller
The Portshaker object type is enabled by default. There is one Portshaker object type: Port Data. To poll Portshaker devices, enable the Portshaker plugin for the device on the New Device page or on the Edit Device page.
Portshaker Object Types and Indicator Types
You cannot add, edit, or delete Portshaker object types or Portshaker indicator types.
-
Click the Filter drop-down and select Portshaker Poller to display the Port Data object type in the Object Types list.
-
Click on the Port Data object type to display its indicator types on the right.
-
Click
to display the Portshaker Indicator Type pop-up. -
View the following Portshaker indicator type details.
-
Indicator Name - Displays the name of the indicator type.
-
Description - Displays the name to display.
-
Indicator Type - Displays the indicator type.
-
Measure As - Displays the indicator type data unit.
-
Display As - Displays the indicator type display unit.
-
Maximum Value - Check box appears selected when the indicator type has a maximum value.
-
Default allowed for new devices - Check box appears selected and the Portshaker plugin polls the indicator type by default.
-
Note - Displays any additional information.
-
-
Click Cancel.
The Device Types section is irrelevant for Portshaker poller object types.
Process Poller
The Process object type is enabled by default. There is one Process object type: Process. To poll Process devices, enable both the Process plugin and the SNMP plugin for the device on the New Device page or on the Edit Device page. The Process plugin works in conjunction with SNMP via the HOST-RESOURCES-MIB. The MIB stores information about all currently running processes, including their CPU time and memory utilization.
The NMS process poller is unable to handle run arguments greater than 128 characters. This is due to the poller's reliance on HOST-RESOURCES-MIB::hrSWRunParameters to fetch the run parameters from the host and the OID being limited to 128 characters as defined in RFC-2790.
Processes group by HOST-RESOURCES-MIB::hrSWRunName, so if 20 SSH sessions are open, they all count as one process with 20 instances. The Process plugin aggregates the values from the combined instances to present the total.
The memory usage for each SSH session is summed together.
Process Object Types and Indicator Types
You cannot add, edit, or delete Process object types or Process indicator types.
-
Click the Filter drop-down and select Process Poller to display the Process object type in the Object Types list.
-
Click on the Process object type to display its indicator types on the right.
-
Click
to display the Process Indicator Type pop-up. -
View the following Process indicator type details.
-
Indicator Name - Displays the name of the indicator type.
-
Description - Displays the name to display.
-
Indicator Type - Displays the indicator type.
-
Measure As - Displays the indicator type data unit.
-
Display As - Displays the indicator type display unit.
-
Maximum Value - Check box appears selected when the indicator type has a maximum value.
-
Default allowed for new devices - Check box appears selected and the Process plugin polls the indicator type by default.
-
Note - Displays any additional information.
-
-
Click Cancel.
The Device Types section is irrelevant for Process poller object types.
Proxy Ping Poller
The Proxy Ping object type is enabled by default. There is one Proxy Ping object type: Proxyping Data. To poll Proxy Ping devices, enable both the Proxy Ping plugin and the SNMP plugin for the device on the New Device page or on the Edit Device page.
Proxy Ping Object Types and Indicator Types
You cannot add, edit, or delete Proxy Ping object types or Proxy Ping indicator types.
-
Click the Filter drop-down and select Proxy Ping Poller to display the Proxyping Data object type in the Object Types list.
-
Click on the Proxyping Data object type to display its indicator types on the right.
-
Click
to display the Proxy Ping Indicator Type pop-up. -
View the following Proxy Ping indicator type details.
-
Indicator Name - Displays the name of the indicator type.
-
Description - Displays the name to display.
-
Indicator Type - Displays the indicator type.
-
Measure As - Displays the indicator type data unit.
-
Display As - Displays the indicator type display unit.
-
Maximum Value - Check box appears selected when the indicator type has a maximum value.
-
Default allowed for new devices - Check box appears selected and the Proxy Ping plugin polls the indicator type by default.
-
Note - Displays any additional information.
-
-
Click Cancel.
The Device Types section is irrelevant for Proxy Ping poller object types.
SNMP Poller
SNMP object types are enabled by default. To poll SNMP devices, enable the device to send SNMP data to SevOne NMS and enable the SNMP plugin for the device on the New Device page or on the Edit Device page. The MIB Manager enables you to add MIBs which are the foundation for SNMP object types and SevOne Support Engineers can perform a device certification to enable you to add the SNMP object types that are specific to your network.
Device type associations enable you to have devices you assign to the device types you define on the Device Types page automatically attempt to poll the enabled SNMP object type enabled indicators.
The SNMP plugin uses text related to and based on OIDs to create human readable object names and descriptions. This provides the ability to use logical and mathematical expressions to store a resultant value in order to relate OIDs to each other. The SNMP plugin uses this to cross reference OIDs across the device's SNMP tree to gather descriptive information about a particular object. Please refer to SNMP topic for details.
SNMP Object Types
Perform the following steps to manage SNMP object types. For interfaces and most SNMP objects, there is an OID that is dedicated to provide the index number.
Example: Walk ifIndex to yield the following:
-
RFC1213-MIB::ifIndex.1 = INTEGER: 1
-
RFC1213-MIB::ifIndex.2 = INTEGER: 2
-
RFC1213-MIB::ifIndex.8 = INTEGER: 8
SNMP object types are hierarchical. You can disable or enable object types at each level of the hierarchy which means the parent object type can be disabled while the child object type is enabled. Each field on the Add/Edit SNMP Object Type pop-up has a corresponding check box on the right side to enable you to make changes at this level of the hierarchy and below. The changes you make when you select the right-hand check box override and do not affect the parent object type definition.
-
Click the Filter drop-down and select SNMP Poller to display the SNMP object types in the Object Types hierarchy.
-
Click Add or click
to display the Add/Edit SNMP Object Type pop-up. When adding/editing an object type at a parent level, Indexed By field is optional. If the Indexed By field is entered, its children will automatically inherit the OID but if needed, it can be changed. However, if the Indexed By field is not entered at the parent level then, when the child object type is created, Indexed By field for the child must be specified.
-
In the Name field, enter the object type name.
-
Click the Indexed By
 to display the SNMP OID Browser where you select the index OID. Perform the following steps on the SNMP OID Browser to select an OID.
 -
In the Search field, enter alphanumeric text to filter the OID search.
-
Navigate the OID Tree hierarchy to locate and select an OID.
-
View the OID in the display on the right side of the SNMP OID Browser.
-
Click Select This OID to select the OID.
-
-
Select the Reverse Engineer check box to have instances of this object type be uniquely identified by evaluating the OID of the SNMP object specified in the Indexed By field, as opposed to its value. How the values encoded within the OID are evaluated is based on the configuration of the Index Keys field. You should leave this check box selected for the vast majority of object types.
-
The Index Keys fields enable you to select the index keys to use to determine how to treat the remaining octets after the index. In the Possible Values field, select index keys to assign to the object type (use Ctrl or Shift keys to multi-select) then move the index keys to the Index Keys field. Index keys in the Index Keys field are assigned to the object type and they display in the sequence in which they appear listed. Possible values include the following:
-
Integer - A single number that indicates there is a constant amount of numbers following each OID.
-
String - A string prefixed with the string length. This typically appears with double quotes.
-
String (Implied) - A string with no length information. This must only occur as the last index value.
-
Variable - A variable amount of numbers prefixed with the amount of items. This is typically used for IPv4 versus IPv6 indexes.
-
Variable (Implied) - A Variable amount of numbers, but with no length information. This must occur as the last index value. This can be used to "eat up" the remainder of the index.
-
-
Click the Name Expression
to display the SNMP OID Browser where you select the OID that results in a unique name for all object types on a device. -
Click the Description Expression
to display the SNMP OID Browser where you select the OID to add additional information about the object type. -
Click the Subtype
to display the SNMP OID Browser where you select the OID to define a subtype for the object type (used for thresholds and reports). This can generate the following variables:
-
- [TYPE]: The numerical value of the subtype.
-
- [TYPE]: The name of the subtype.
-
- [TYPE]: The description of the subtype.
-
-
Click the Assert
to display the SNMP OID Browser where you select the OID to use in the assert expression that generates a list of individual object indexes. This is skipped if the object does not pass the assert expression. No variables are generated. Example: To match only Ethernet interfaces and ignore everything else, enter the following statement.
ifType == 6
This separates memory from disks in the Host Resources MIB; both use hrStorageIndex, but each has a different value for hrStorageType. You should not modify the default Interface definition. -
Click the Last-change OID
to display the SNMP OID Browser where you select the OID to use to determine if a change was made to the object type since it was last polled. If the object type changed, the SNMP plugin invalidates the current data. -
Click the Admin-status
to display the SNMP OID Browser where you select the OID to use to determine the administrative status of the object. -
Click the Oper-status
to display the SNMP OID Browser where you select the OID to use to determine the operational status of the object. -
In the Variable field, enter the variables, expressions, and operators you want to use to evaluate first for use with the other fields.
-
Select the check box for the Note field to enable it for editing. Enter any additional information you would like to include.
-
Click Edit Subtypes to display the Object Subtype Manager where you manage the object subtypes.
-
Click Save.
-
In the Object Types hierarchy, click to select the object type to which to associate device types.
-
In the Device Type section on the right, click Associate to display a pop-up that enables you to associate the SNMP object type with device types on which you want to poll data.
-
Select the check box for each device type to which to associate the object type.
-
Click Associate to create the association and to close the pop-up.
-
SNMP Atomic Indicator Types
Perform the following steps to manage SNMP atomic indicator types. For SNMP synthetic indicator types, please see section Synthetic Indicator Types below.
-
Click the Filter drop-down and select SNMP Poller to display the SNMP object types in the Object Types hierarchy.
-
Click on an object type to display its indicator types on the right.
-
Click Add Atomic Indicator Type or click
next to an atomic indicator type to display the Add/Edit SNMP Indicator Type pop-up. -
In the Indicator Name field, enter the name of the indicator type.
-
In the Description field, enter the name to display.
-
View the Indexed By OID you define for the object type. You cannot edit this field.
-
For certain 64 bit OIDs, click the OID (high bit)
to display the SNMP OID Browser where you select the OID to describe the top 32 bits on the OID. Please refer to the note below. -
Click the OID
to display the SNMP OID Browser where you select the OID to describe the object type expression. -
Click the Indicator Type drop-down.
-
Select GAUGE for indicators that have specific values when polled.
-
Select COUNTER32 for 32 bit indicators that continue to increment. If you select this option, you can select the Has Precalculated Deltas check box to total the delta/differences between polls to provide the ability to graph things like the number of errors in a day, for example.
-
Select COUNTER64 for 64 bit indicators that continue to increment. If you select this option, you can select the Has Precalculated Deltas check box.
-
-
Click the Measured As drop-down and select a data unit.
-
Click the Display As drop-down and select a display unit.
-
Click the Max Value Expression
to display the SNMP OID Browser where you select the OID that is the maximum value for the indicator type. -
Click the Measured As drop-down and select a data unit for the maximum value expression OID.
-
Select the Default allowed for new devices check box to poll the indicator type by default when the object type is enabled and you enable the SNMP plugin for a device.
-
In the Note field, enter any additional information you would like to include.
-
In field Allow Netflow Mapping, select Yes to allow the user to automatically map flow device with the SNMP device IP address. By default, it is set to No. This feature enables custom object / indicator mapping to flow interfaces. However, it is not required for device mapping.
-
If Yes, you can set field Direction to All (ingress & egress), Incoming (ingress), or Outgoing (egress).
-
-
Click Save.
OID High Bits - SNMP version 1 specifications allow for 32 bit, unsigned integer counters. A 32 bit counter increments up to around four billion, then wraps back to zero, and continues. SNMP version 2 introduced 64 bit unsigned integer counters that can count much higher. 64 bit counters have twice the bits and twice the physical capacity of 32 bit counters to make them far more powerful and accurate. Manufacturers had two options to incorporate 64 bit counters.
-
Create a new 64 bit OID to represent the same thing as the 32 bit version.
-
Create a second 32 bit OID that represents the high bits of the 64 bit version.
VMware Poller
VMware object types are enabled by default. When you enable the VMware (Logical) and/or the VMware (Physical) topology sources on the Cluster Manager > Cluster Settings tab, these topology sources automatically discover VMware devices and enable the VMware plugin. This expedites the creation of Topology reports. For devices you manually add, the VMware plugin requires device specific configuration and you enable the VMware plugin for the device on the New Device page or on the Edit Device page.
VMware Object Types and Indicator Types
You cannot edit, add, or delete VMware object types or VMware indicator types. Discovery uses the object "objectTypeId" && ("name" || "name" == 'DiskIO' && "instance") to determine if a VMware object is a new object or an existing object with a new moniker.
-
Click the Filter drop-down and select VMware Poller to display the VMware object types in the Object Types list.
-
Click on an object type to display its indicator types on the right.
-
Click
to display the VMware Indicator Type pop-up. -
View the following VMware indicator type details.
-
Indicator Name - Displays the name of the indicator type.
-
Description - Displays the name to display.
-
Indicator Type - Displays the indicator type.
-
Measure As - Displays the indicator type data unit.
-
Display As - Displays the indicator type display unit.
-
Maximum Value - Check box appears selected when the indicator type has a maximum value.
-
Default allowed for new devices - Check box appears selected and the VMware plugin polls the indicator type by default.
-
Note - Displays any additional information.
-
-
Click Cancel.
The Device Types section is irrelevant for VMware poller object types.
Web Status Poller
The Web Status object type is enabled by default. There is one Web Status object type: Apache Mod Status. To poll Web Status devices, enable the device to send Web Status data to SevOne NMS and enable both the Web Status plugin and the SNMP plugin for the device on the New Device page or on the Edit Device page. The Authentication Settings page enables you to upload certificates to monitor Web Status via https.
Web Status Object Types and Indicator Types
You cannot add, edit, or delete Web Status object types or Web Status indicator types.
-
Click the Filter drop-down and select Web Status Poller to display the Apache Mod Status object type in the Object Types list.
-
Click on the Apache Mod Status object type to display its indicator types on the right.
-
Click
to display the Web Status Indicator Type pop-up. -
View the following Web Status indicator type details.
-
Indicator Name - Displays the name of the indicator type.
-
Description - Displays the name to display.
-
Indicator Type - Displays the indicator type.
-
Measure As - Displays the indicator type data unit.
-
Display As - Displays the indicator type display unit.
-
Maximum Value - Check box appears selected when the indicator type has a maximum value.
-
Default allowed for new devices - Check box appears selected and the Web Status plugin polls the indicator type by default.
-
Note - Displays any additional information.
-
-
Click Cancel.
The Device Types section is irrelevant for Web Status poller object types.
WMI Poller
WMI object types are disabled by default. The WMI plugin discovers the WMI indicator types for the object types you enable. To poll WMI devices, enable the device to send WMI data to SevOne NMS, enable the WMI object types, and enable the WMI plugin for the device on the New Device page or on the Edit Device page.
WMI Object Types
Perform the following steps to manage WMI object types. Discovery uses the object "objectTypeId" && ("name" || "instanceName") to determine if a WMI object is a new object or an existing object with a new moniker.
-
Click the Filter drop-down and select WMI Poller to display the WMI object types in the Object Types list.
-
Click Add or click
to display the Add/Edit WMI Object Type pop-up. -
In the Name field, enter the name of the object type.
-
In the Class Name field, enter the class name.
-
In the Alias field, enter the alias.
-
Select the Enabled check box to enable the WMI plugin to poll the object type.
-
Select the check box for the Note field to enable it for editing. Enter any additional information you would like to include.
-
Click Save.
WMI Atomic Indicator Types
Perform the following steps to manage WMI atomic indicator types. For WMI synthetic indicator types, please see section Synthetic Indicator Types below.
-
Click the Filter drop-down and select WMI Poller to display the WMI object types in the Object Types list.
-
Click on an object type to display its indicator types on the right.
-
Click Add Atomic Indicator Type or click
to display the Add/Edit WMI Indicator Type pop-up. -
In the Indicator Name field enter the name of the indicator type.
-
In the Description field, enter the name to display.
-
Click the Indicator Type drop-down.
-
Select GAUGE for indicators that have specific values when polled.
-
Select COUNTER32 for 32 bit indicators that continue to increment. If you select this option, you can select the Has Precalculated Deltas check box to total the delta/differences between polls to provide the ability to graph things like the number of errors in a day, for example.
-
Select COUNTER64 for 64 bit indicators that continue to increment. If you select this option, you can select the Has Precalculated Deltas check box.
-
-
Click the Measure As drop-down and select a data unit.
-
Click the Display As drop-down and select a display unit.
-
Select the Maximum Value check box to indicate the indicator type has a maximum value. You must select this check box if you want to use the indicators in this indicator type for percentile metrics.
-
Select the Default allowed for new devices check box to have the WMI plugin poll the indicator type by default when the object type is enabled and you enable the WMI plugin for a device.
-
In the Note field, enter any additional information you would like to include.
-
In field Allow Netflow Mapping, select Yes to allow the user to automatically map flow device with the SNMP device IP address. By default, it is set to No. This feature enables custom object / indicator mapping to flow interfaces. However, it is not required for device mapping.
-
If Yes, you can set field Direction to All (ingress & egress), Incoming (ingress), or Outgoing (egress).
-
-
Click Save.
The Device Types section is irrelevant for WMI poller object types.
xStats
The xStats object types are enabled by default. The sources you define on the xStats Source Manager create xStats devices, object types, and indicator types. To monitor xStats data, contact your SevOne sales representative to discuss which xStats adapters are applicable for your implementation.
xStats Object Types
Perform the following steps to manage xStats object types.
-
Click the Filter drop-down and select xStats to display the xStats object types in the Object Types list.
-
Click Add or click
to display the Add/Edit xStats Object Type pop-up. -
In the Name field, enter the name of the object type.
-
In the Field Identifiers field, enter the object type field identifiers.
-
Select the Ignore check box to have the xStats plugin not monitor the object type.
-
Click Save.
xStats Atomic Indicator Types
Perform the following steps to manage xStats atomic indicator types. For xStats synthetic indicator types, please see section Synthetic Indicator Types below.
-
Click the Filter drop-down and select xStats to display the xStats object types in the Object Types list.
-
Click on an object type to display its indicator types on the right.
-
Click Add Atomic Indicator Type or click
to display the Add/Edit xStats Indicator Type pop-up. -
In the Indicator Name field enter the name of the indicator type.
-
In the Description field, enter the name to display.
-
Click the Indicator Type drop-down.
-
Select GAUGE for indicators that have specific values when polled.
-
Select COUNTER32 for 32 bit indicators that continue to increment. If you select this option, you can select the Has Precalculated Deltas check box to total the delta/differences between polls to provide the ability to graph things like the number of errors in a day, for example.
-
Select COUNTER64 for 64 bit indicators that continue to increment. If you select this option, you can select the Has Precalculated Deltas check box.
-
-
Click the Measure As drop-down and select a data unit.
-
Click the Display As drop-down and select a display unit.
-
Select the Maximum Value check box to indicate the indicator type has a maximum value. You must select this check box if you want to use the indicators in this indicator type for percentile metrics.
-
In the Field Identifiers field, enter the object type field identifiers.
-
Select the Default allowed for new devices check box to have the xStats plugin monitor the indicator type by default when the object type is enabled and you enable the xStats plugin for a device.
-
Select the Ignore check box to have the xStats plugin ignore the indicator type.
-
In the Note field, enter any additional information you would like to include.
-
In field Allow Netflow Mapping, select Yes to allow the user to automatically map flow device with the SNMP device IP address. By default, it is set to No. This feature enables custom object / indicator mapping to flow interfaces. However, it is not required for device mapping.
-
If Yes, you can set field Direction to All (ingress & egress), Incoming (ingress), or Outgoing (egress).
-
-
Click Save.
The Device Types section is irrelevant for xStats poller object types.
Synthetic Indicator Types
Synthetic indicator types enable you to perform math on multiple metrics collected from multiple indicators on a single monitored object in order to calculate new KPIs.
Synthetic indicator types behave similar to the Calculation Editor that enables you to create custom calculation objects that perform math on multiple metrics collected from multiple objects and/or multiple synthetic indicators that you poll via the Calculation plugin. These features enable you create your own KPIs even when those KPIs do not exist on a device such as Percentage Loss, Percent Error, and Percent Idle. Synthetic indicators are always gauge type indicators and SevOne NMS evaluates all the indicator values the synthetic indicator uses as if the value is a gauge.
Example: You want to monitor voice gateways to reveal which PRI gets the most or least usage. Typical poll metrics enable you to report on the status of individual bearer channels and not the sum of all channels at any given time. This makes it difficult to monitor and alert on total PRI usage. Synthetic indicators enable you to sum the bearer channel statuses (each channel gets a value of 1 when busy), divide by the total number of bearer channels (23), and then multiply by 100, to collect the desired metric for PRI % usage.
You can define synthetic indicator types for the following plugins: Calculation, Deferred Data, JMX, SNMP, WMI, and xStats.
-
Click the Filter drop-down and select one of the following: Calculation Poller, Deferred Data, JMX Poller, SNMP Poller, WMI Poller, or xStats Poller to display the object types in the list.
-
Click on an object type to display its indicator types on the right. If the object type does not have any indicator types, the Add Synthetic Indicator Type button does not appear.
-
Click Add Synthetic Indicator Type or click
next to a synthetic indicator type to display the Add/Edit Synthetic Indicator Type pop-up. -
In the Indicator Name field, enter the name of the synthetic indicator type.
-
In the Description field, enter the name to display.
-
The Synthetic Indicator Expression field enables you to define the calculation.
If the border around the field turns red, your calculation is invalid and your graph results will be erroneous.
Synthetic Indicator Expression :maxValue modifierEach indicator in Synthetic Indicator Expression supports the :maxValue modifier. This modifier can be added to any indicator that has the maxValue. The user interface validates the modifier and approves it only if the underlying indicator has a maxValue set. Otherwise, the expression is marked as invalid and cannot be saved. For an expression that is invalid, you will get a pop-up message like Modifier is not available for ${<indicator>:maxValue} where <indicator> does not have a maxValue.
For example,
-
${ifHCInOctets:maxValue} is a valid expression as ifHCInOctets has maxValue.
-
${SMDIMessageCountInbound24Hour:maxValue} is an invalid expression as SMDIMessageCountInbound24Hour does not have maxValue.
The discovered maxValue is retrieved and used for an indicator unless if the maxValue has been overwritten and in that case, the overwritten value is used.
-
Click an indicator type in the Available Source Indicators field and drag it to the Synthetic Indicator Expression field. The Available Source Indicators field contains the indicator types associated to the object type you select in the hierarchy.
-
Enter applicable operators in the Synthetic Indicator Expression field to formulate the calculation. Please refer to section Acceptable Operators below.
-
Drag additional source indicator types and enter additional mathematical symbols to create the expression in the Synthetic Indicator Expression field.
-
-
The Maximum Value Expression field enables you to define the indicator type maximum value calculation.
If the border around the field turns red, your calculation is invalid and your graph results will be erroneous.
Maximum Value Expression :maxValue modifierEach indicator in Maximum Value Expression supports the :maxValue modifier. This modifier can be added to any indicator that has the maxValue. The user interface validates the modifier and approves it only if the underlying indicator has a maxValue set. Otherwise, the expression is marked as invalid and cannot be saved. For an expression that is invalid, you will get a pop-up message like Modifier is not available for ${<indicator>:maxValue} where <indicator> does not have a maxValue.
For example,
-
${ifHCInOctets:maxValue} is a valid expression as ifHCInOctets has maxValue.
-
${SMDIMessageCountInbound24Hour:maxValue} is an invalid expression as SMDIMessageCountInbound24Hour does not have maxValue.
The discovered maxValue is retrieved and used for an indicator unless if the maxValue has been overwritten and in that case, the overwritten value is used.
-
Click an indicator type in the Available Source Indicators field and drag it to the Maximum Value Expression field.
-
Enter applicable operators in the Maximum Value Expression field to formulate the calculation. Please refer to section Acceptable Operators below.
-
Drag additional source indicator types and enter additional mathematical symbols to create the expression in the Maximum Value Expression field.
-
-
Click the Measure As drop-down and select a data unit.
-
Click the Display As drop-down and select a display unit.
-
Select the Default allowed for new devices check box to have the plugin poll the indicator type by default when the object type is enabled and you enable the plugin for a device.
-
In the Note field, enter any additional information you would like to include.
-
In field Allow Netflow Mapping, select Yes to allow the user to automatically map flow device with the SNMP device IP address. By default, it is set to No. This feature enables custom object / indicator mapping to flow interfaces. However, it is not required for device mapping.
-
If Yes, you can set field Direction to All (ingress & egress), Incoming (ingress), or Outgoing (egress).
-
-
Click Save.
Acceptable Operators
Your expression formula can include the following characters:
-
+ add
-
- subtract
-
* multiply
-
/ divide
-
&& logical AND
-
|| logical OR
-
<= less than or equal to
-
>= greater than or equal to
-
! not equal to
-
== equal to
-
> greater than
-
< less than
-
^ raise x to the power of y
-
% modulus
-
?: if...then...else
-
isnan is Not a Number. This evaluates to 1 if the value is not a number. Otherwise, it evaluates to 0.
-
isValid is valid. This evaluates to 1 if the value has been discovered and is not isnan. Otherwise, it evaluates to 0.
-
useIfValid use if valid. This evaluates to the value if it has been discovered and is not isnan. It evaluates to the second argument otherwise.
If your calculation results in either of the following invalid values, there will be a gap in your graph: Not a Number (NAN) and Infinity (+/-INF). The following is how SevOne NMS attempts to prevent invalid values.
In sequence of processing:
-
Zero divided by zero results in NAN.
-
Any positive value divided by zero results in +INF.
-
Any negative value divided by zero results in -INF.
-
Zero multiplied by +/-INF results in NAN.
-
Any value added to, subtracted from, multiplied by, divided by, or divided from NAN results in NAN.
-
Any value compared to NAN (<, <=, ==, >=, >) results in 0. NAN != NAN.
-
Any value compared to +INF is less than +INF, except that +INF == +INF
-
Any value compared to -INF is greater than -INF, except that -INF == -INF
-
Any value added to or subtracted from +INF results in +INF
-
Any positive value multiplied by +/-INF results in +/-INF
-
Any value divided by +/-INF results in 0