Table of Contents (Start)
- Topics
- Introducing SevOne
- Login
- Startup Wizard
- Dashboard
- Global Search - Advanced Search
- Report Manager
- Report Attachment Wizard
- Report Properties
- Report Interactions
- Instant Graphs
- TopN Reports
- Alerts
- Alert Archives
- Alert Summary
- Instant Status
- Status Map Manager
- Edit Maps
- View Maps
- FlowFalcon Reports
- NBAR Reports
- Logged Traps
- Unknown Traps
- Trap Event Editor
- Trap Destinations
- Trap Destination Associations
- Policy Browser
- Create and Edit Policies
- Webhook Definition Manager
- Threshold Browser
- Create and Edit Thresholds
- Probe Manager
- Discovery Manager
- Device Manager
- New Device
- Edit Device
- Object Manager
- High Frequency Poller
- Device Summary
- Device Mover
- Device Groups
- Object Groups
- Object Summary
- Object Rules
- VMware Browser
- AWS Plugin
- Azure Plugin (Public Preview)
- Calculation Plugin
- Database Manager
- Deferred Data Plugin
- DNS Plugin
- HTTP Plugin
- ICMP Plugin
- IP SLA Plugin
- JMX Plugin
- NAM
- NBAR Plugin
- Portshaker Plugin
- Process Plugin
- Proxy Ping Plugin
- SDWAN Plugin
- SNMP Plugin
- VMware Plugin
- Web Status Plugin
- WMI Plugin
- xStats Plugin
- Indicator Type Maps
- Device Types
- Object Types
- Object Subtype Manager
- Calculation Editor
- xStats Source Manager
- User Role Manager
- User Manager
- Session Manager
- Authentication Settings
- Preferences
- Cluster Manager
- Maintenance Windows
- Processes and Logs
- Metadata Schema
- Baseline Manager
- FlowFalcon View Editor
- Map Flow Objects
- FlowFalcon Views
- Flow Rules
- Flow Interface Manager
- MPLS Flow Mapping
- Network Segment Manager
- Flow Protocols and Services
- xStats Log Viewer
- SNMP Walk
- SNMP OID Browser
- MIB Manager
- Work Hours
- Administrative Messages
- Enable Flow Technologies
- Enable JMX
- Enable NBAR
- Enable SNMP
- Enable Web Status
- Enable WMI
- IP SLA
- SNMP
- SevOne Data Publisher
- Quality of Service
- Perl Regular Expressions
- Trap Revisions
- Integrate SevOne NMS With Other Applications
- Email Tips and Tricks
- SevOne NMS PHP Statistics
- SevOne NMS Usage Statistics
- Glossary and Concepts
- Map Flow Devices
- Trap v3 Receiver
- Guides
- Quick Start Guides
- AWS Quick Start Guide
- Azure Quick Start Guide (Public Preview)
- Data Miner Quick Start Guide
- Flow Quick Start Guide
- Group Aggregated Indicators Quick Start Guide
- IP SLA Quick Start Guide
- JMX Quick Start Guide
- Metadata Quick Start Guide
- RESTful API Quick Start Guide
- Self-monitoring Quick Start Guide
- SevOne NMS Admin Notifications Quick Start Guide
- SNMP Quick Start Guide
- Synthetic Indicator Types Quick Start Guide
- Topology Quick Start Guide
- VMware Quick Start Guide
- Web Status Quick Start Guide
- WMI Quick Start Guide
- xStats Quick Start Guide
- xStats Adapter - Accedian Vision EMS (TM) Quick Start Guide
- Deployment Guides
- Automated Build / Rebuild (Customer) Instructions
- Generate a Self-Signed Certificate or a Certificate Signing Request
- SevOne Best Practices Guide - Cluster, Peer, and HSA
- SevOne Data Platform Security Guide
- SevOne NMS Implementation Guide
- SevOne NMS Installation Guide - Virtual Appliance
- SevOne NMS Advanced Network Configuration Guide
- SevOne NMS Installation Guide
- SevOne NMS Port Number Requirements Guide
- SevOne NMS Upgrade Process Guide
- SevOne Physical Appliance Pre-Build BIOS and RAID Configuration Guide
- SevOne SAML Single Sign-On Setup Guide
- Cloud Platforms
- Other Guides
- Quick Start Guides
Flow Quick Start Guide
SevOne Documentation
All documentation is available from the IBM SevOne Support customer portal.
© Copyright International Business Machines Corporation 2024.
All right, title, and interest in and to the software and documentation are and shall remain the exclusive property of IBM and its respective licensors. No part of this document may be reproduced by any means nor modified, decompiled, disassembled, published or distributed, in whole or in part, or translated to any electronic medium or other means without the written consent of IBM.
IN NO EVENT SHALL IBM, ITS SUPPLIERS, NOR ITS LICENSORS BE LIABLE FOR ANY DAMAGES, WHETHER ARISING IN TORT, CONTRACT OR ANY OTHER LEGAL THEORY EVEN IF IBM HAS BEEN ADVISED OF THE POSSIBILITY OF SUCH DAMAGES, AND IBM DISCLAIMS ALL WARRANTIES, CONDITIONS OR OTHER TERMS, EXPRESS OR IMPLIED, STATUTORY OR OTHERWISE, ON SOFTWARE AND DOCUMENTATION FURNISHED HEREUNDER INCLUDING WITHOUT LIMITATION THE WARRANTIES OF DESIGN, MERCHANTABILITY OR FITNESS FOR A PARTICULAR PURPOSE, AND NONINFRINGEMENT.
IBM, the IBM logo, and SevOne are trademarks or registered trademarks of International Business Machines Corporation, in the United States and/or other countries. Other product and service names might be trademarks of IBM or other companies. A current list of IBM trademarks is available on ibm.com/trademark.
About
Most enterprise-level routers and switches come equipped with some type of flow technology. Flow records are used by IT folks, for example, to troubleshoot a wide range of network issues.
Flow technology was originally intended as a way to optimize packet routing. Cisco Systems invented the NetFlow protocol in the 1990s for a NetFlow-enabled router to create a table that maintained a cache of routing decisions. In this table, the router stores all the necessary information to route a given packet. When later packets came in with the same signature as the previous packet, the router can use the information from the table to route those packets without having to start from scratch. This saves the router from having to perform the same calculations repeatedly. Eventually, other approaches to packet routing took over, but the information contained in those tables turned out to be invaluable in other ways.
A lot of vendors use network flow technologies similar to Cisco's NetFlow. A network flow record contains a number of attributes, including:
-
Source IP address
-
Destination IP address
-
Source port
-
Destination port
-
Layer 3 protocol type
-
Type of Service (ToS)
-
Router/switch input interface
Flow records can tell where the traffic is coming from and where it is going. It can tell who is using the bandwidth and what is it being used for. It can also track down minor / major network problems such as, network slowdowns, poor VoIP call quality, and security vulnerabilities, for example.
The following sections cover all aspects of collecting and reporting on flow technologies in SevOne NMS. You must enable your devices to send flow to SevOne NMS. This is done outside of SevOne NMS. The examples used in this guide are of devices supported by SevOne. SevOne supports flow monitoring for several devices however, if your device is not listed in the examples, you may need to check with the device manufacturer to obtain specific instructions for your device.
Prepare Your SevOne Appliance
This section applies only if your SevOne appliance has more than one network interface card (NIC).
If your SevOne appliance has more than one NIC, you must disable reverse path filtering. To do this, the following information is required.
-
IP address of the appliance - need IP address or hostname of your SevOne appliance.
-
Root access to the appliance - need root username / password for the SSH session.
-
An SSH client - need an SSH client such as, PuTTY.
Perform the following steps to disable reverse path filtering.
-
Using ssh, log in to SevOne NMS appliance as root.
$sshroot@<NMS appliance> -
Execute the following command.
$echo0 >/proc/sys/net/ipv4/conf/all/rp_filter
Enable Devices to Send Flow Data
Before getting started, make sure your devices are enabled to send flow data to SevOne NMS. In this section, recommended settings are discussed and steps on how to enable flow on some specific devices.
sFlow Data versus Netflow Data
SevOne NMS automatically calculates the flow rate for sFlow and sampled Netflow data and dynamically adjusts the calculation when the flow rate changes. Following is port information for sFlow and Netflow data.
-
sFlow data - SevOne NMS uses port 6343. This port cannot be changed from SevOne NMS user interface.
-
Netflow data (sampled / non-sampled) - SevOne NMS uses port 9996. This port can be changed from SevOne NMS user interface > Administration > Cluster Manager > Cluster Settings tab > FlowFalcon subtab.
Flow Source Flow Timeout Configuration
Manufacturers typically configure routers to send flow data every 30 minutes. This setting is sometimes referred to as the flow cache timeout. It specifies how frequently a router sends the flow table to the collector (SevOne NMS). This, in effect, sets the limit to how much a router allows a flow to grow before breaking it into a new flow.
SevOne recommends that you configure routers to send flow data every minute. This ensures that the router reports to SevOne NMS in a timely manner, enabling an even distribution of information transfer. If you set the flow source flow timeout configuration to something other than one minute, the router reports less frequently and sends SevOne NMS larger flow tables, resulting in less granular report data. To compensate for this, the SevOne NMS FlowFalcon Reports page provides a Granularity setting. This enables you to view the report at the granularity that matches your router flow timeout configuration. SevOne does not recommend a flow cache timeout of anything other than one minute.
The following table lists use-cases along with associated timeout configurations, SevOne FlowFalcon settings, and caveats.
|
Flow Source Flow Timeout Configuration Considerations |
||
|
Applicable Use Cases |
Flow Source Flow Timeout Configuration |
SevOne NMS FlowFalcon Report Settings |
|
Recommended: Billing AND Burst Monitoring |
1 minute |
Leave the display setting granularity set to the default, Auto. This applies to both the classic FlowFalcon Reports page and the Report Attachment Wizard. This is the optimal SevOne NMS setting for typical flow reporting. |
|
Acceptable |
2-5 minutes |
Set the display setting granularity to 5 minutes. This applies to both the classic FlowFalcon Reports page and the Report Attachment Wizard. |
|
Not Recommended |
5+ minutes |
On the classic FlowFalcon Reports page, In the Display Settings section, click the Granularity drop-down and select Custom. Set the granularity time span to twice the router flow timeout. On the Report Attachment Wizard, Go to the Settings page and select the FlowFalcon tab. Click the Granularity drop-down and select 30 minutes. |
Enable Cisco Devices to Send Flow Data
Flexible NetFlow (FNF) - Cisco IOS Router
feature netflowflow exporter SEVONE destination <sevone IP Address> transport udp 9996 source <source interface of netflow export> version 9 template data timeout 600 option sampler-table timeout 600 flow record NetflowExport description Netflow_traffic match ipv4 source address match ipv4 destination address match ip protocol match ip tos match transport source-port match transport destination-port collect routing destination as collect routing forwarding-status collect routing next-hop address ipv4 collect transport tcp flags collect counter bytes collect counter packets collect timestamp sys-uptime first collect timestamp sys-uptime last flow timeout active 60 flow timeout inactive 15flow monitor Monitor_Enterprise description MONITOR_ENTERPRISE record NetflowExport exporter SEVONEPer interface:interface Vlan4 ip flow monitor Monitor_Enterprise input ip flow monitor Monitor_Enterprise outputTraditional NetFlow (TNF) - Cisco IOS Router
-
Enable Cisco Express Forwarding (CEF), which is required for flow in most recent IOS releases. In global configuration mode, enter the following command to enable CEF.
ip cefGlobal configuration mode is indicated by the host name followed by (config)#. For example, if your router is named Router-2, the command prompt in global configuration mode would be Router-2(config)#.
-
Enter the following commands to start NetFlow Data Export (NDE).
-
Specify your SevOne NMS appliance as the destination (that is, the flow collector) for your router and specify a port.
ip flow-exportdestination <enter SevOne NMS appliance IP address> 9996By default, SevOne NMS collects flow data on port 9996. To confirm the specified port, click Administration > Cluster Manager > Cluster Settings tab > FlowFalcon subtab > field Incoming Port.
-
Specify the interface that NetFlow will derive the source IP address from.
ip flow-exportsourceloopback 0 -
Specify the export version format. In the following command, replace <version-number> with the appropriate version (for example, 5 or 9).
ip flow-exportversion <version-number>
-
-
By specifying parameters for the NetFlow accounting flow cache, you can prevent flows from staying in the cache longer than necessary. Perform the following actions to configure the timeout for active and inactive flows.
The active timeout is specified in minutes, while the inactive timeout is specified in seconds.
-
Specify the number of minutes to leave active flows in the cache. Breaking flows into shorter segments prevents sending too many flows to your collector (the SevOne NMS appliance). The following command allows active flows to stay in the cache for 1 minute. In other words, it breaks the flows into one-minute segments.
ip flow-cache timeout active 1 -
Specify the number of seconds to leave inactive flows in the cache. This will cause finished flows to be expired and removed from the cache. The following command allows inactive flows to stay in the cache for 15 seconds.
ip flow-cache timeout inactive 15
-
-
Enable NetFlow on each physical interface where you would like to collect a flow from. This is normally an Ethernet or WAN interface. You may need to set the speed of the interface in kilobits per second, especially for frame relay or ATM virtual circuits.
This is not needed for VLANs or tunnels as they are automatically included.
-
Specify the interface with the following command. Replace <interface> with the name of the physical interface that you would like to enable NetFlow on. For example, Ethernet0/0.
interface <interface> -
Enter one of the following commands to enable the physical interface specified above.
-
To enable flows on individual sub-interfaces rather than all of the sub-interfaces.
ip flow ingress -
To enable flows on the physical interface along with all the sub-interfaces associated with it.
ip route-cache flow
-
-
-
Save your configuration changes.
copy run start -
Verify that the router is generating flow statistics. First, switch to enable mode. Then enter the following commands to view current NetFlow configuration and state.
Enable mode, also known as privileged mode, is indicated by the host name followed by #. For example, if your router is named Router-2, the command prompt in enable mode is Router-2#.
-
Enter the following command to display the status and statistics of the data export.
show ip flowexport -
Enter the following commands to display summaries of the active flows and the amount of NetFlow data exported from the router.
To display a summary of the data export statisticsshow ip cache flow
To display a detailed summary of the data export statisticsshow ip cache verbose flow
-
-
Enable the ifIndex SNMP setting. This tells the router to remember ifIndexes so that they do not change during device configuration or reboot.
snmp-server ifIndex persistThis is an important step and is required by SevOne NMS.
Cisco Switches Running CatOS (Hybrid Mode) - Non-4000 Series Catalyst Switches
Router Side
-
Before enabling flow on this switch, the following commands on the router side must be entered.
Enter the following global commandsip flow-exportsource<enter interface>ip flow-exportversion <enter version-number>ip flow-exportdestination <enter SevOne IP address> 9996ip flow-cache timeout active 1 -
Enter the following commands for each physical interface. Replace <interface> with the name of the interface.
interface <interface>ip route-cache flow
Switch Side
-
Specify your SevOne NMS appliance as the destination, i.e., the flow collector, for your switch and specify a port.
setmls nde <enter SevOne NMS appliance IP address> 9996 -
Specify the export version. In the following command, version 9 is specified.
setmls nde version 9 -
Perform the following actions to specify for how long you want to keep the active and inactive flows in cache.
-
Specify the number of seconds to leave active flows in the cache. Execute the following command to allow active flows to be kept in the cache for approximately two minutes. In other words, it breaks the flows into approximately two-minute segments.
setmls agingtime long 128 -
Specify the number of seconds to leave inactive flows in the cache. Execute the following command to allow inactive flows to be kept in the cache for approximately one-minute.
setmls agingtime 64
-
-
Enter the following command to set the flow mask to full flows.
setmls flow full -
For this step, CatOS 7.(2) or higher is required. If your version is lower, skip this step and continue with the next step. This following command enables NetFlow Data Export (NDE) for all traffic within the specified VLANs rather than just inter-VLAN traffic.
setmls bridged-flow-statisticsenable -
Enable NDE.
setmls ndeenable
Switches Running IOS (Native Mode)
Before continuing, ensure that you are in privileged / enable mode. Enter the following global commands (all commands are entered in the router <enable> config option).
-
Specify the interface that NetFlow will derive the source IP address from.
ip flow-exportsource<enter interface> -
Specify the export version format. For example, version 9.
ip flow-exportversion 9 -
Specify your SevOne NMS appliance as the destination, i.e., the flow collector, for your switch and specify a port.
ip flow-exportdestination <enter SevOne NMS appliance IP address> 9996 -
Enable NDE from the PFC and configure the NDE version.
mls nde sender version 9
-
Perform the following actions to specify for how long you want to keep the active and inactive flows in cache.
-
Specify the number of seconds to leave active flows in the cache. Execute the following command to allow active flows to be kept in the cache for one minutes. In other words, it breaks the flows into one-minute segments.
setmls agingtime long 60 -
Specify the number of seconds to leave inactive flows in the cache. Execute the following command to allow inactive flows to be kept in the cache for 15 seconds.
setmls agingtime 15
-
-
If you have a Supervisor Engine 2 or 720 with IOS version 12.1.13(E) or higher, you will need to enter the following two commands to put interface and routing information into the NetFlow exports.
mls flow ip interface-fullmls nde interface -
Enter the following commands for each physical interface. Replace <interface> with the name of the interface.
interface <interface>ip route-cache flow
4000 Series Catalyst Switches Running in Hybrid or Native Mode
This series requires a Supervisor Engine IV with a NetFlow Services daughter card to support NDE.
-
In the configuration terminal on the router, enter the following commands to start NetFlow export.
ip flow-exportversion 9ip flow-exportdestination <enter SevOne NMS appliance IP address> 9996 -
Enable NetFlow on each physical interface. Replace <interface> with the name of the interface.
interface <interface>ip route-cache flow infer-fields
Enable Juniper Devices to Send Flow Data
Juniper supports flow exports by sampling packet headers with the routing engine and aggregating them into flows. Packet sampling is achieved by defining a firewall filter to accept and sample all traffic, applying that rule to an interface, and then configuring the sampling forwarding option.
To configure inline flow monitoring, include the inline-jflow statement at the [edit forwarding-options sampling instance instance-name family inet output] hierarchy level.
Inline sampling supports the version-ipfix format, which uses UDP as the transport protocol. To configure inline sampling, include the version-ipfix statement at the [edit forwarding-options sampling instance instance-name family inet output flow-server address] hierarchy level.
The following operational commands include inline fpc keywords to display inline configuration information.
-
show services accounting errors
-
show services accounting flow
-
show services accounting status
Junos OS Documentation > Release Notes (https://www.juniper.net/documentation/product/us/en/junos-os#cat=release_notes), lists the key features available.
Configure sFlow Features from the CLI
-
Specify the IP address of the collector.
[edit protocols sflow]
user@switch# set collector <enter SevOne NMS appliance IP address> -
Specify the UDP port for the collector. The default UDP port on the SevOne NMS appliance is 6343.
[edit protocols sflow]
user@switch# set collector udp-port 6343 -
Enable sFlow technology on a specific interface. Replace <interface-name> with the name of an interface that you would like to enable sFlow on. For example, ge-0/0/3.
[edit protocols sflow]
user@switch# set interfaces <interface-name>
sFlow technology cannot be enabled on a Layer 3 VLAN-tagged interface or LAG interface. However, it can be enabled on the member interfaces of the LAG.
-
Specify how frequently the sFlow agent polls the interface. Replace <seconds> with the number of seconds. If you do not want to poll the interface, specify 0 here.
You have the option of configuring this setting (polling interval) and the next setting (sample rate) at the interface level. If you prefer to do so, jump ahead two steps.
[edit protocols sflow]
user@switch# set polling-interval <seconds> -
Specify the rate at which you want to sample packets. Replace <number> with your desired sample rate. For example, if you specify 6, one out of every six packets will be sampled.
[edit protocols sflow]
user@switch# set sample-rate <number> -
(optional) If you prefer, you can set the polling interval and sample rate at the interface level. To do this, use the following command. Replace <interface-name> with the name of the interface, <seconds> with the polling interval in seconds, and <number> with the sample rate number.
[edit protocols sflow intefaces]user@switch# set interfaces <interface-name> polling-interval <seconds> sample-rate <number>
The interface-level configuration overrides the global configuration for the interface.
Enable Alcatel Devices to Send Flow Data
When you enable cflowd on an Alcatel service interface, cflowd collects routed traffic flow samples through a router for analysis. cflowd is supported on Internet Enhanced Service (IES) and Virtual Private Routed Networks (VPRN) service interfaces. Layer 2 traffic is excluded. All packets forwarded by the interface are analyzed according to the cflowd configuration. At the interface level, cflowd can be associated with a filter (ACL) or an IP interface.
When you enable cflowd on an interface, all packets forwarded by the interface are subject to analysis according to the global cflowd configuration.
When you configure the cflowd interface option in the config>router>interface context, the following requirements must be met to enable traffic sampling on the specific interface.
-
Enable cflowd.
-
Select the interface>cflowd interface option.
-
To omit certain types of traffic from being sampled when the interface sampling is enabled, enable the config>filter>ip-filter>entry>interface-disable-sample option via an ip-filter or ipv6-filter. Apply the filter to the service or network interface that the traffic to be omitted is on.
Specify cflowd Options on an IP Interface
The following is the CLI syntax for configuring cflowd on an interface.
config>router>if# cflowd {acl | interface} no cflowdDepending on the option you select, either acl or interface, cflowd extracts traffic flow samples from an IP filter or an interface for analysis. All packets forwarded by the interface are analyzed according to the cflowd configuration.
Select the acl option to enable traffic sampling on an IP filter. You need to enable cflowd, i.e., filter-sample, in at least one IP filter entry.
Select the interface option to enable traffic sampling on an interface. If cflowd is not enabled i.e., no cflowd, traffic sampling will not occur on the interface.
Enable cflowd on Service Interfaces
Enable cflowd on service interfaces using the command line interface (CLI).
config>service>vpls <service-id#> interface <ip-int-name> cflowd {acl | interface}Configure cflowd for Collectors
Using CLI, configure cflowd.
config>cflowd# collector <SevOne NMS appliance IP address>:<port> version <version-number> aggregation as-matrix destination-prefix protocol-port raw source-destination-prefix source-prefix autonomous-system-type {origin | peer} description description-string no shutdown template-set {basic | mpls-ip}
The example includes use-vrtr-if-index command to export flow data using interface indexes, i.e., ifIndex, instead of using the Alcatel internal global IF index IDs.
active-timeout 20 inactive-timeout 10 overflow 10 rate 100 use-vrtr-if-index collector 10.2.10.31:9996 version 8 aggregation as-matrix raw exit description "SevOne NMS" exit collector 10.2.10.32:9996 version 8 aggregation protocol-port source-destination-prefix exit autonomous-system-type peer description "Neighbor collector" exitEnable Citrix NetScaler AppFlow
Execute the following steps to configure AppFlow.
-
Launch Citrix NetScaler configuration User Interface.
-
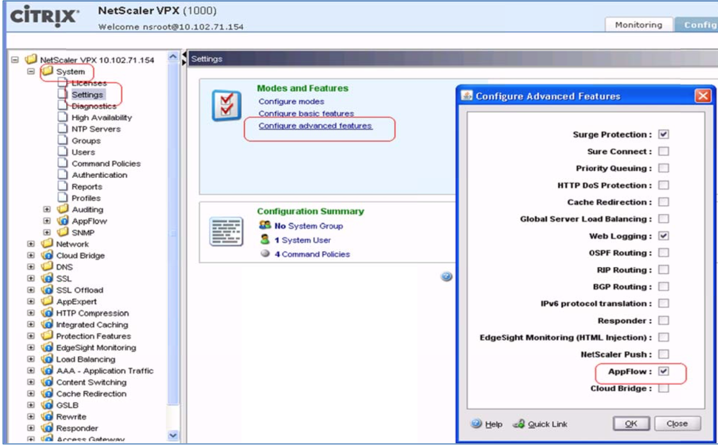
From the menu on the left, select System > Settings.
-
To the right, under Settings, click Configure advanced features.
-
In the Configure Advanced Features pop-up, select the AppFlow check box.
-
Click OK.
-
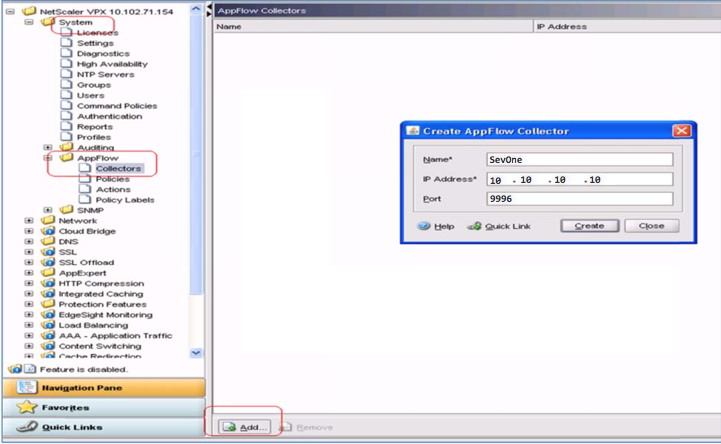
From the menu on the left, under System, expand the AppFlow folder. Under AppFlow, select Collectors.
-
At the bottom of the page, click Add....
-
In the Create AppFlow Collector pop-up, provide the specified input for the following fields.
-
Name - enter SevOne.
-
IP Address - enter the IP address of your SevOne Dedicated NetFlow Collector (DNC).
-
Port - enter 9996.
-
-
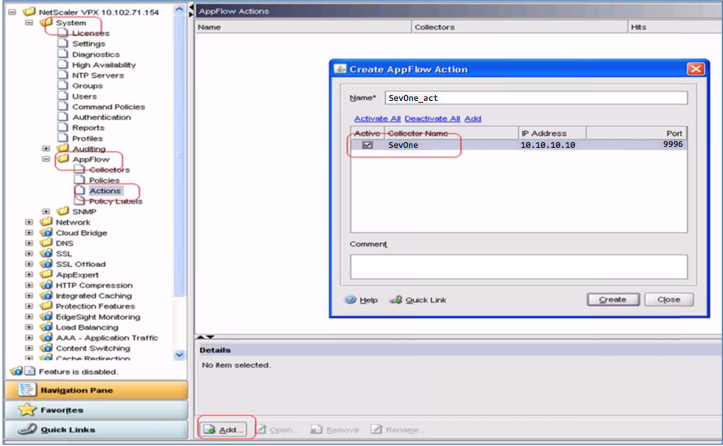
From the menu on the left, under System, expand the AppFlow folder and select Actions.
An AppFlow action is a set of collectors, that the flow records are sent to if the associated AppFlow policy matches.
-
At the bottom of the page, click Add....
-
In the Create AppFlow Action pop-up, select SevOne under column Collector Name.
-
To the left of the SevOne, under column Active, select the check box.
-
Click Create.
-
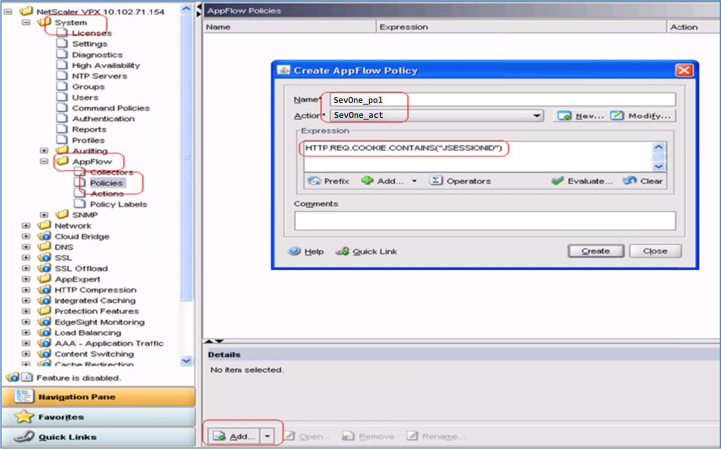
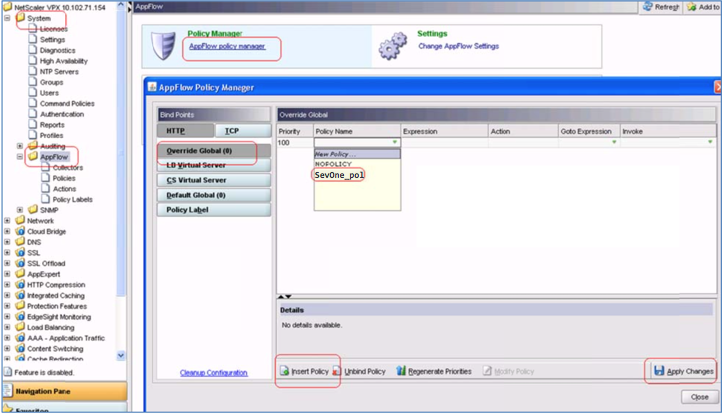
From the menu on the left, under System > AppFlow, select Policies.
After you configure an AppFlow action, you need to configure an AppFlow policy. An AppFlow policy is based on a rule that consists of one or more expressions. For more information about expressions, refer to your Citrix AppFlow Configuration Guide.
-
At the bottom of the page, click Add....In the Create AppFlow Policy pop-up, perform the following actions.
-
In the Name field, provide a name.
-
Click the Action drop-down to select an action.
-
In the Expression field, enter an expression.
-
Click Create.
-
-
Once you have created the policy, policy needs to be put into effect. To do this, perform one of the following actions.
Policies can be bound to override global/LB vserver/CS vserver/default global.
-
Bind the policy globally so that it applies to all traffic that flows through the NetScaler.
-
Bind the policy to a specific virtual server so that it applies only to traffic related to that virtual server.
-
-
Configure AppFlow settings to customize the information that is sent to the collector. From the menu on the left, under System, select AppFlow.
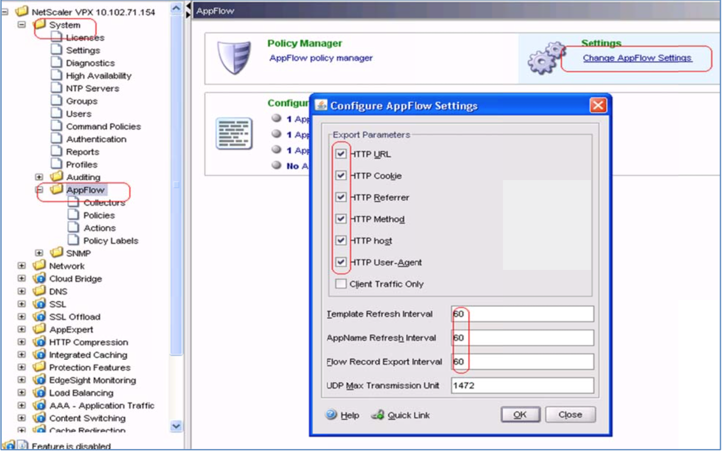
-
In the right panel, under Settings, click Change AppFlow Settings.
-
In the Configure AppFlow Settings pop-up, specify the necessary settings to customize the information that will be sent to the collector.
-
The following NetScaler unique fields are available in reports, along with Bandwidth and Packets metrics. During configuration in SevOne NMS, provide the field names by using the FlowFalcon View Editor.
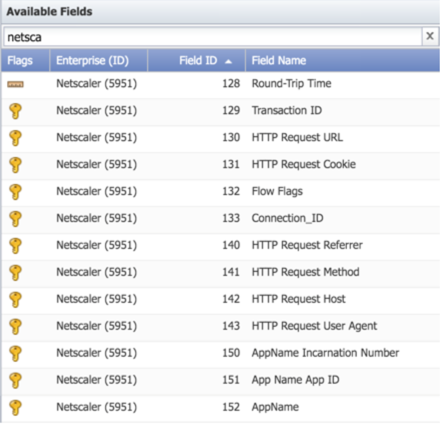
-
After AppFlow is set and SevOne NMS settings are configured, you may create report views and generate reports on your AppFlow data.
Example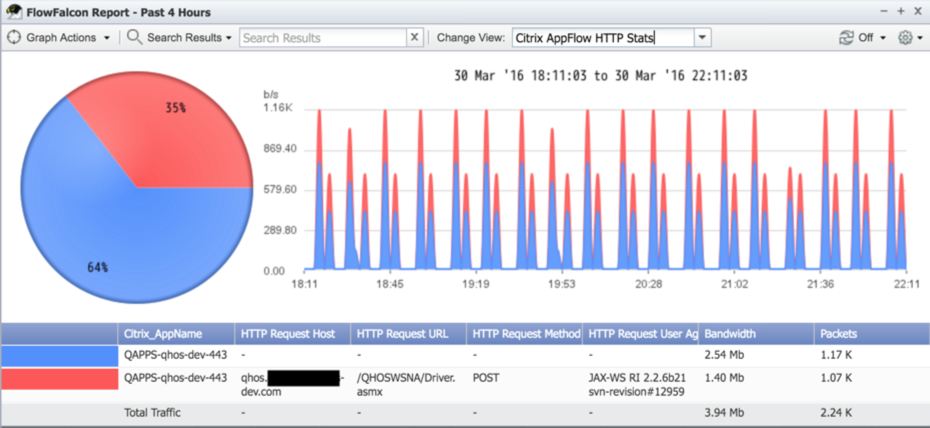
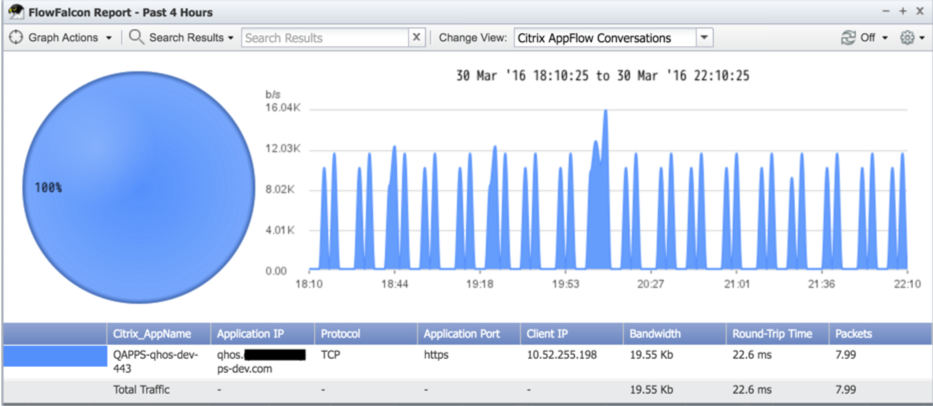
Configuration
FlowFalcon Cluster-level and Peer-level Settings
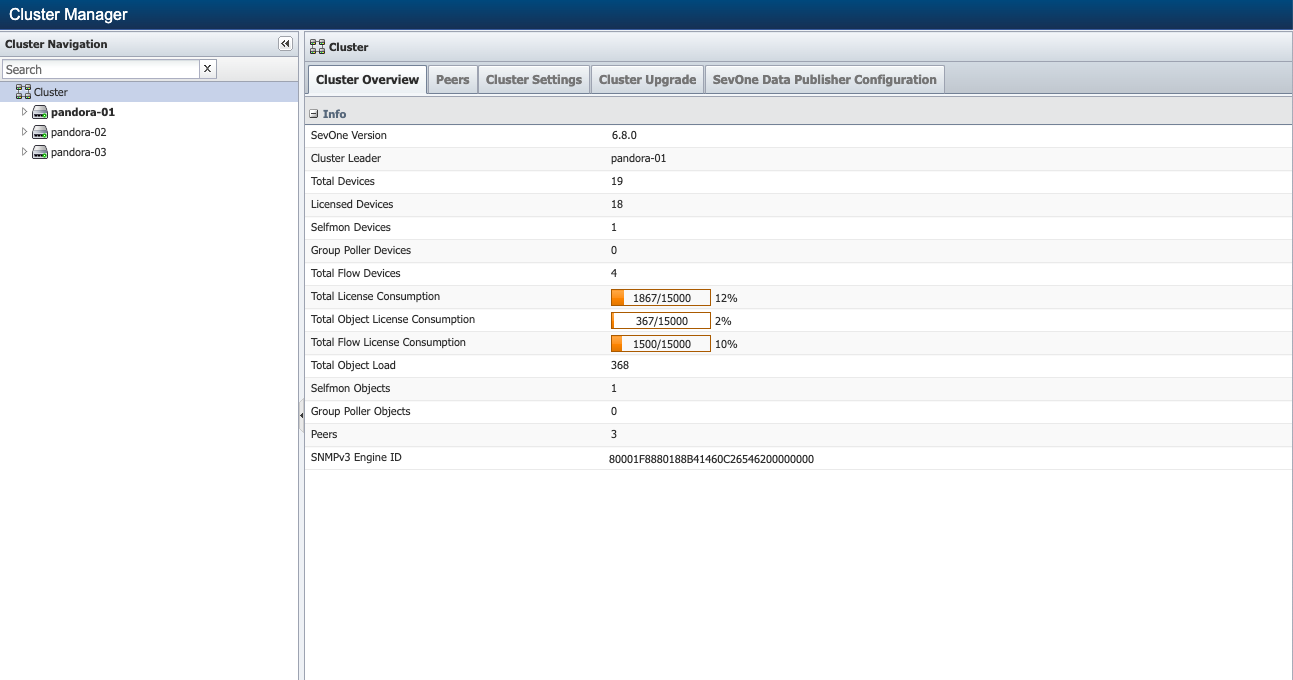
The Cluster Manager displays statistics and lets you define settings at the cluster level, peer level, and appliance level. With a few exceptions, the default Cluster Manager settings enable you to run SevOne NMS right out of the box.
To access the Cluster Manager from the navigation bar, click Administration and select Cluster Manager.
Configure Cluster-level Flow Settings
Please refer to SevOne NMS System Administration Guide > section Cluster Manager > sub-section Cluster Settings > FlowFalcon for details.
Configure Peer-level Flow Settings
Please refer to SevOne NMS System Administration Guide > section Cluster Manager > sub-section Peer Settings > FlowFalcon (available when you click  <peer name> in the cluster hierarchy on the left) for details.
Flow Rules
Define rules to process flow data received by SevOne NMS. Please refer to SevOne NMS System Administration Guide > section Flow Rules for details.
Flow Interface Manager
Please refer to SevOne NMS System Administration Guide > section Flow Interface Manager to enable you to limit flow data that SevOne NMS processes from specific devices and from specific interfaces.
FlowFalcon View Editor
Please refer to SevOne NMS System Administration Guide > section FlowFalcon View Editor for details on how to manage FlowFalcon report views.
MPLS Flow Mapping
Please refer to SevOne NMS System Administration Guide > section MPLS Flow Mapping for details on how to upload MPLS flow maps.
Network Segment Manager
Please refer to SevOne NMS System Administration Guide > section Network Segment Manager to define network segments to group flow data.
Object Mapping
Please refer to SevOne NMS System Administration Guide > section Map Flow Objects for details on how to map object indicators to flow interfaces.
Protocols and Services
Please refer to SevOne NMS System Administration Guide > section Flow Protocols and Services to define protocols and services to collect flow data from.
Report Creation
The FlowFalcon reports can be created using,
-
Report Attachment Wizard - please refer to SevOne NMS User Guide > section Report Attachment Wizard > subsection FlowFalcon Source for details.
-
FlowFalcon Reports - please refer to SevOne NMS User Guide > section FlowFalcon Reports for details.
FlowFalcon Report Views
Please refer to SevOne NMS System Administration Guide or SevOne NMS User Guide > section FlowFalcon Views for details.
Flow Alerting
Network Operations teams are under increasing pressure to keep the network performing at its best. They need to leverage capabilities at their disposal to be able to reduce MTTR and solve performance problems faster. Flow alerting takes advantage of the performance information being collected from network routers, switches, firewalls, wireless LAN controllers, etc. via flow. As flow data is being processed, SevOne users will be notified based on flow alerting policies put in place by the SevOne administrator. They will be presented with threshold violations based on aggregated NetFlow tuples representing protocol, host, and conversation information that is seen traversing the network. With this information, they can monitor for conditions that warrant investigation, such as backup traffic occurring during business hours, multicast traffic rates that drop below the required bit rate, etc.
How It Works
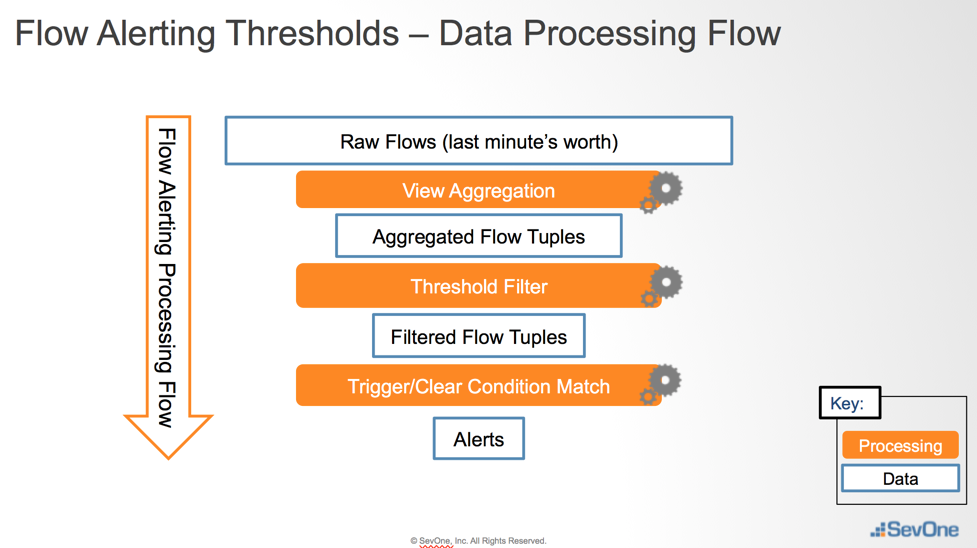
Flow alerting takes advantage of the data aggregation process that occurs every minute by NetFlowd to look for threshold violations and trigger alerts. When the per-minute data aggregation occurs, all tuples are available to be used when looking for threshold violations–not just the top 100 in the view.
Looking at the diagram below, each minute, all raw flows are gathered to calculate the top 100 aggregation per interface per direction. At this time, all raw flow data available. As view aggregation occurs, we get a list of all tuples that align with that aggregation. The tuples are examined based on the flow alerting policies and thresholds defined by the SevOne admin. FlowFalcon filters can be applied to the policies and thresholds in order to further reduce and focus the data set on the desired set of tuples. Once the tuples have been filtered, trigger and clear conditions can be applied, along with a duration from 1 to 60 minutes. If a match occurs, then an alert is triggered and interested parties can be notified via SevOne Alerts dashboard, email, or SNMP Trap.
Benefits of flow alerting are,
-
can configure alerting policies on flow data using any of the Aggregated View templates.
-
can be alerted proactively based on information extracted from flow data.
-
RTAGx or any additional object licenses are not required.
Use Case
A network operations engineer wants to be alerted if backup traffic is seen during working hours (9 a.m. - 5 p.m., M-F) because this can cause network congestion when the network is needed most.
Required Information
Application port(s) that network backup systems use. Application port used for the example below is 2222.
Alerting Strategy
-
Create a FlowFalcon filter using the legacy FlowFalcon interface that identifies the information you are interested in.
-
Create a flow alerting policy for all interfaces/directions.
-
Define your general settings.
-
Select device or object group containing your flow interfaces.
-
Select Aggregated View that contains application port information, such as Top Applications or Top Applications with Protocol.
-
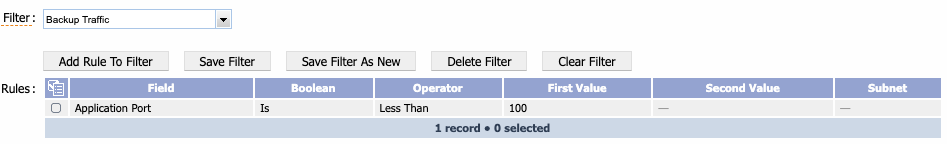
Select the FlowFalcon filter you created earlier (for example, Backup Traffic).
-
Select Direction = Any (this will create thresholds for both Ingress and Egress traffic on the interface).
-
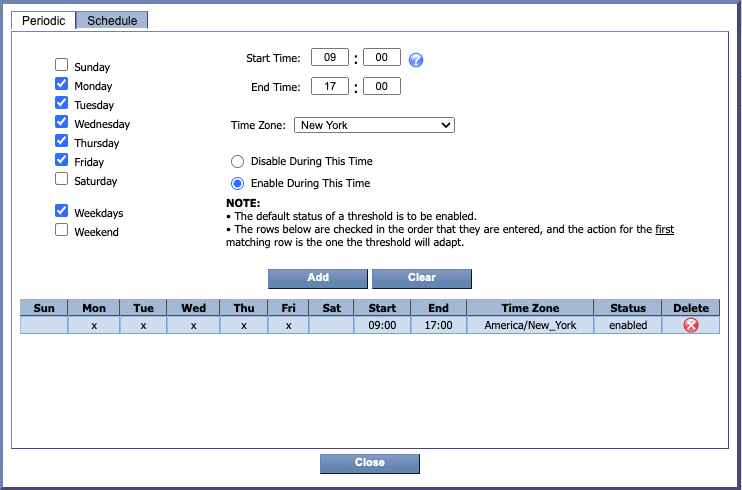
Configure Schedule to only include Business Hours, Monday - Friday.
-
-
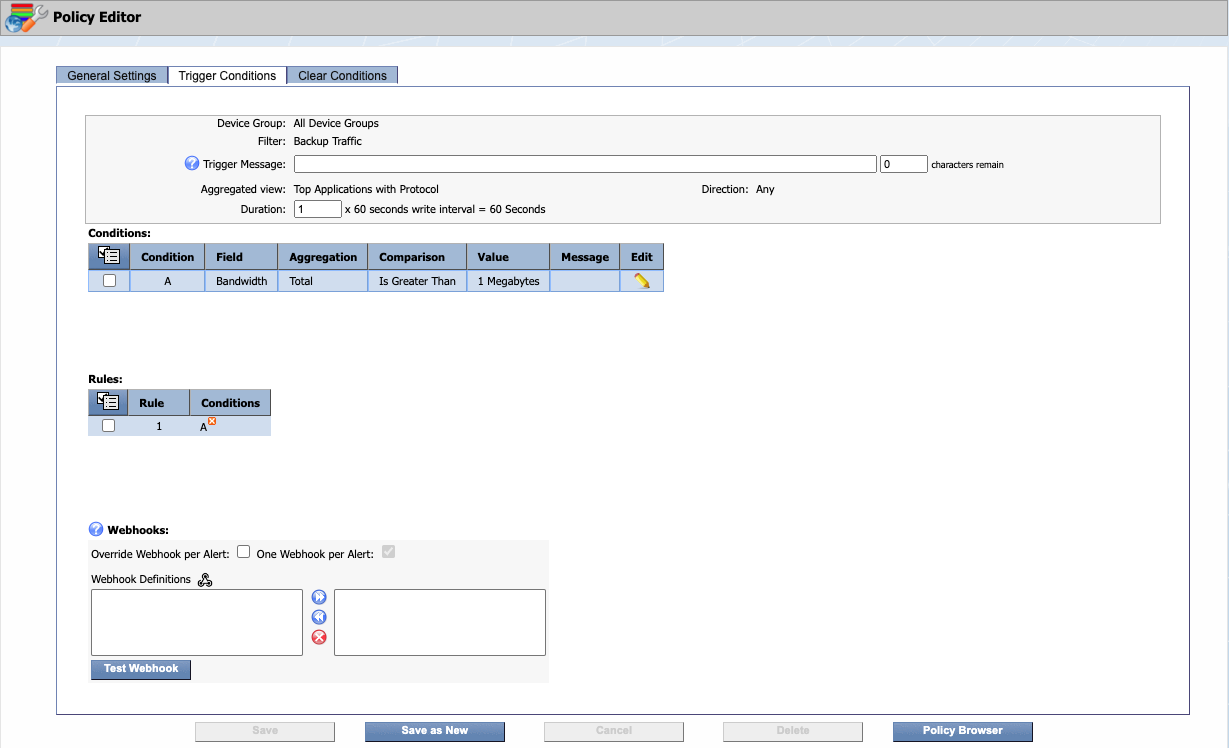
Define your alert conditions.
-
Raise an alert when average Network Backup application port traffic is greater than 1 MB for a duration of 1 minute.
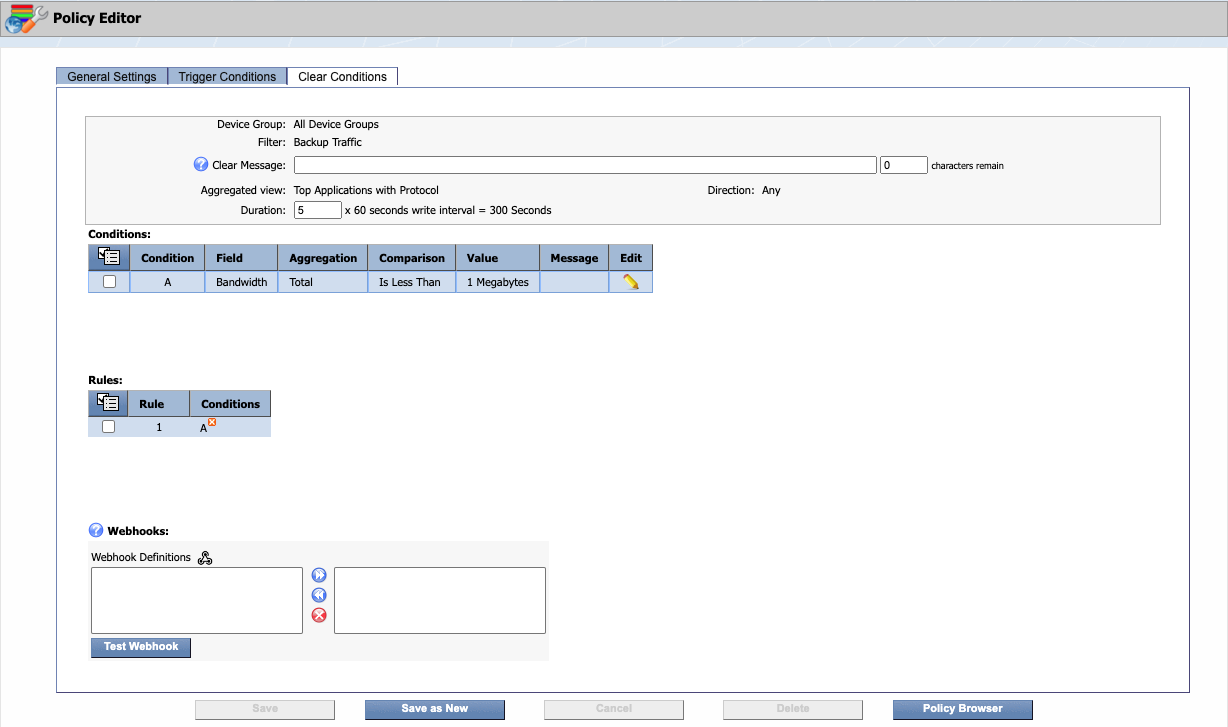
-
Clear an alert when average Network Backup application port traffic is less than 1 MB for a duration of 5 minutes.
-
-
Step-By-Step Instructions
-
Create a FlowFalcon filter using the legacy FlowFalcon interface that identifies the information you are interested in. Please refer to SevOne NMS User Guide > section FlowFalcon Reports > Filters.
-
Create a flow alerting policy for all interfaces/directions.
-
Define your general settings.
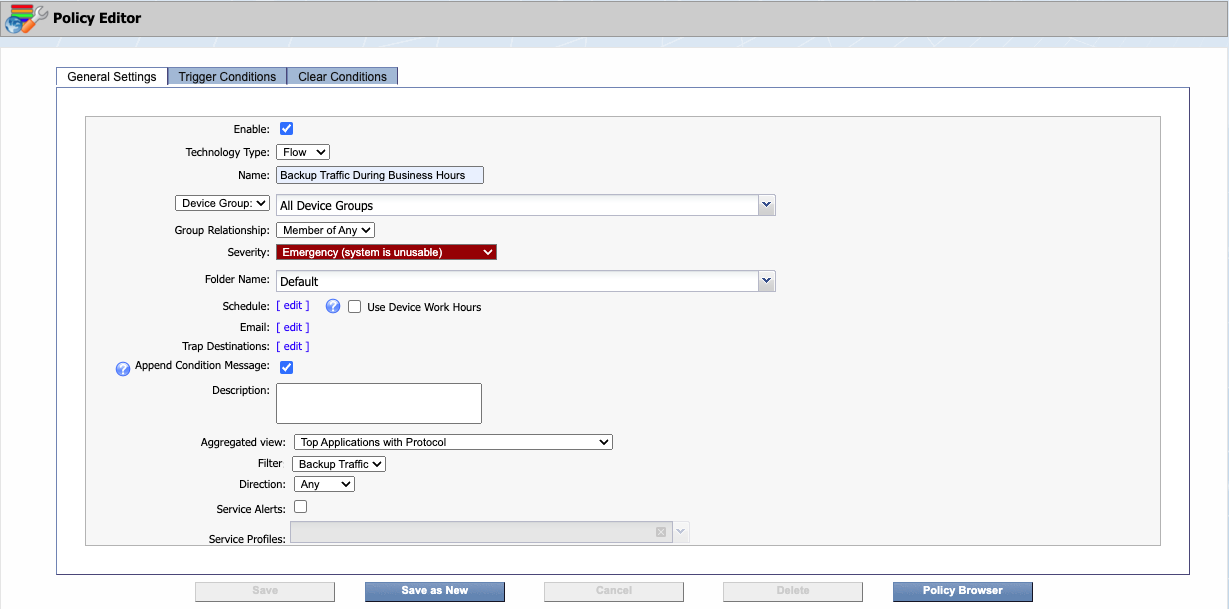
-
Configure Schedule to only include the hours of 9 am to 5 pm (09:00 to 17:00), Monday - Friday.
-
-
Define your alert conditions.
-
Raise an alert when average network backup application port traffic is greater than 1 Megabytes / second for a duration of 60 seconds.
-
Clear an alert when average Network Backup application port traffic is less than 1 Megabytes / second for a duration of 300 seconds.
-
Click Save As New to save your policy.
-
-
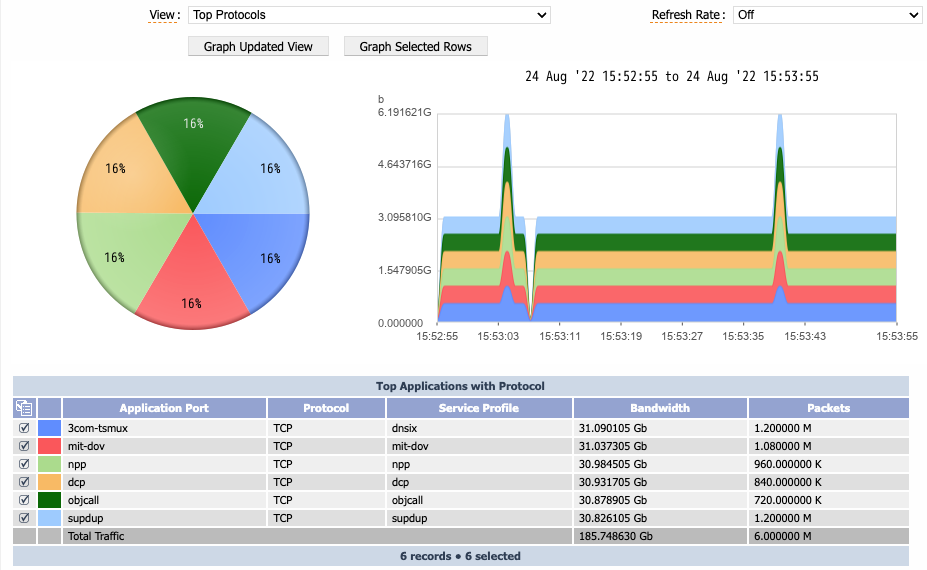
Go to Events > Alerts and check to see if you have an alert.
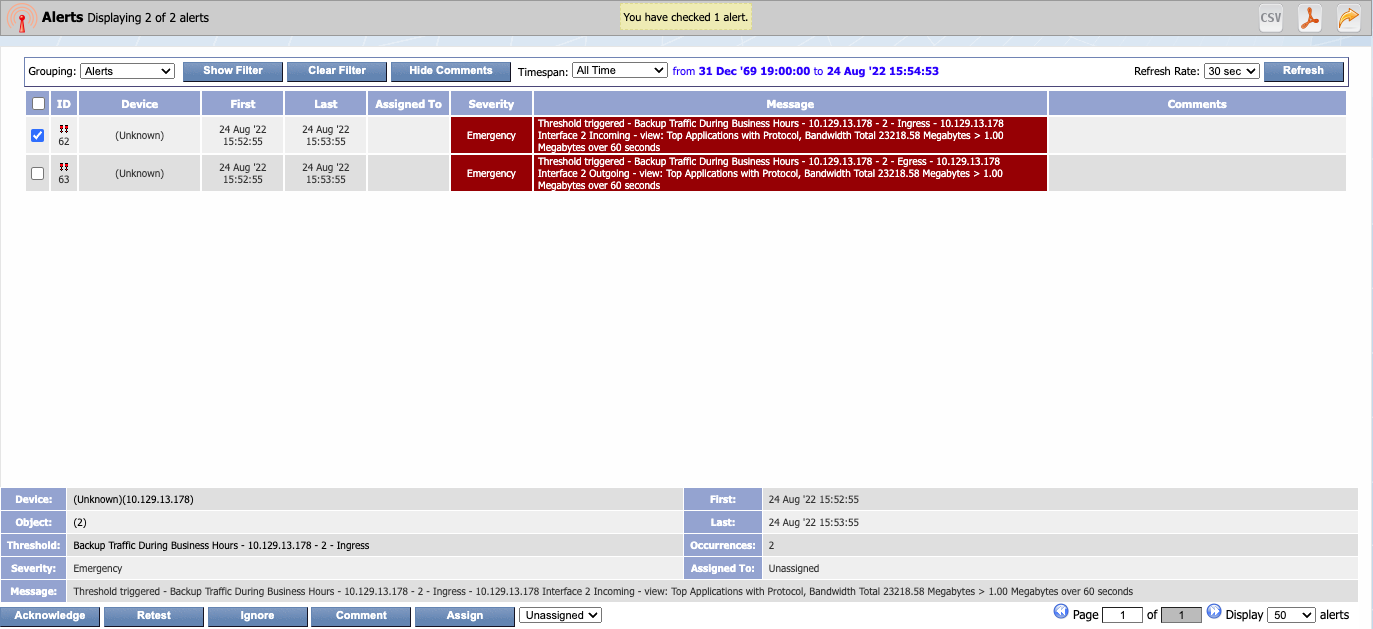
-
When you click on (2) next to field Object in the screenshot above, it will provide the context of FlowFalcon interface to show you the data that caused the alert to trigger.
FlowDB
In the course of troubleshooting performance issues, sometimes network engineers and troubleshooters need to have visibility into all of the flow tuples related to the situation at hand. While aggregated views are great for showing you the top things for a particular view, their reports typically have a large Other area, which are the tuples that did not make it into the top 100 for the time period being analyzed. By utilizing raw flow data, the user has access to all tuples of interest; not just the top 100.
Systems normally only have 10 aggregated views available. So what happens if the user needs to be presented with a different set of views that are not included in the 10 aggregated views? The user is able to create any number of non-aggregated raw views, allowing them to view the data and generate reports to meet any use case.
While non-aggregated views provide the user great flexibility, the trade-off is in performance with regard to the amount of time it takes to generate a report using raw data vs. aggregated data. Raw flows are massive in quantity, requiring the system to analyze a lot of data before it can generate the results in the form of a FlowFalcon report. Unfortunately, this can take a long time.
Benefits
The following are some of the benefits:
-
FlowDB enhances SevOne's ability to process large amounts of raw flow records via the introduction of a columnar LMDB Lightning database. It has shown to generate raw non-aggregated reports from 6x - 20x faster than in previous releases. However, results vary depending on the number of interfaces, timespan, and filtering applied.
-
FlowDB changes the underlying data storage and retrieval method. The front-end workflow and options when running non-aggregated flow reports have not changed. It will visually look the same to the user. However, the non-aggregated raw data reports will complete faster than before.
-
FlowDB uses LZ4 compression. It is always on and cannot be turned off. This type of compression is high performing and reduces the storage requirement of raw data by two thirds. This means that you can store three times as much raw data as you were previously able to using the same amount of disk.
Use Case
A network analyst needs to see all flows originating from a particular host IP address during the last 15 minutes.
Step-By-Step Instructions
-
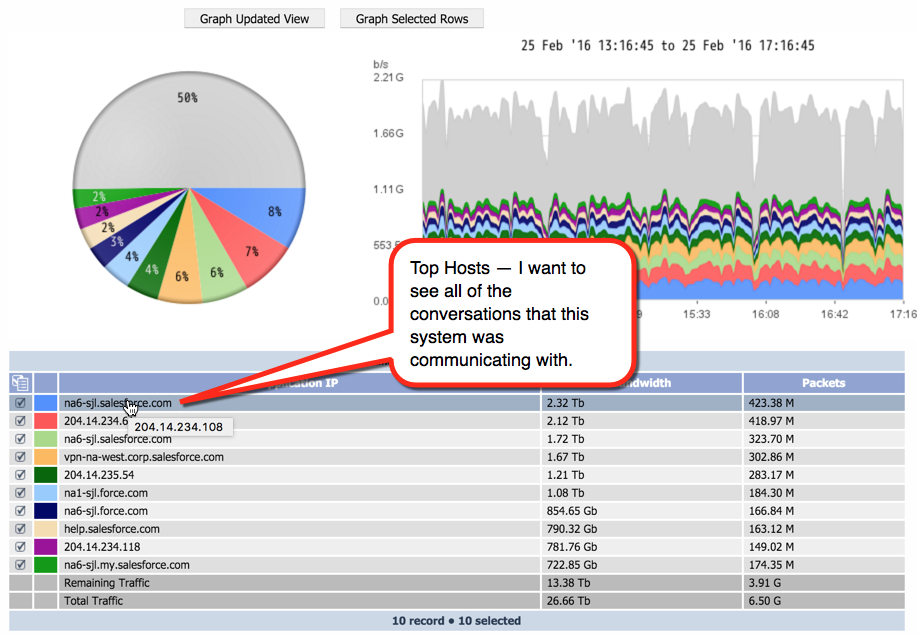
Run an aggregated view report using the view Top Talkers (Bandwidth, Packets, Flows) to identify hosts of interest. Then select one of the hosts.
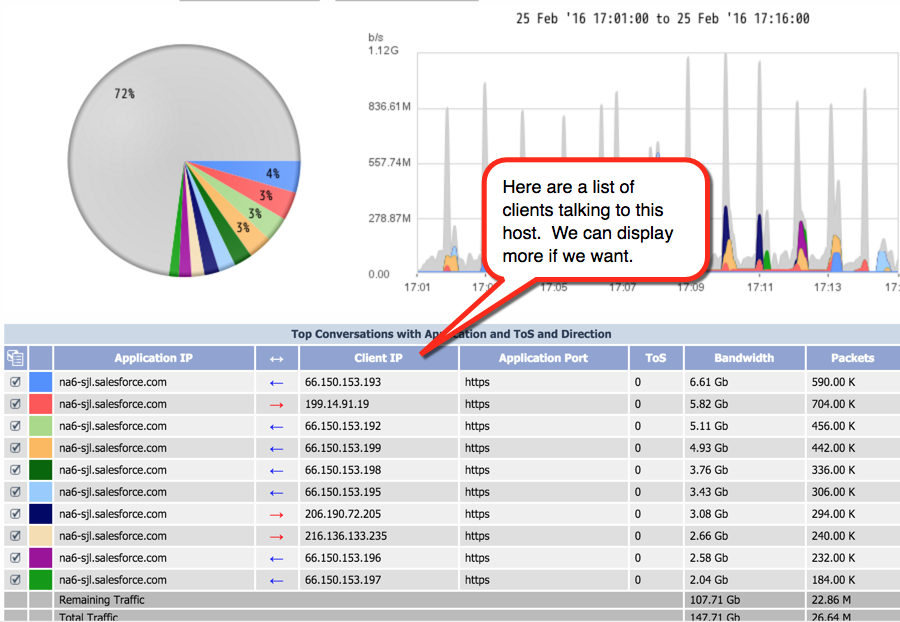
2. Run a non-aggregated view report using the view Top Conversations with Application and ToS and Direction. Use the following settings:
-
Aggregated Data = No
-
View = Top Conversations with Application and ToS and Direction
-
Time Span = Custom. Then configure the time span to show you the last 15 minutes.
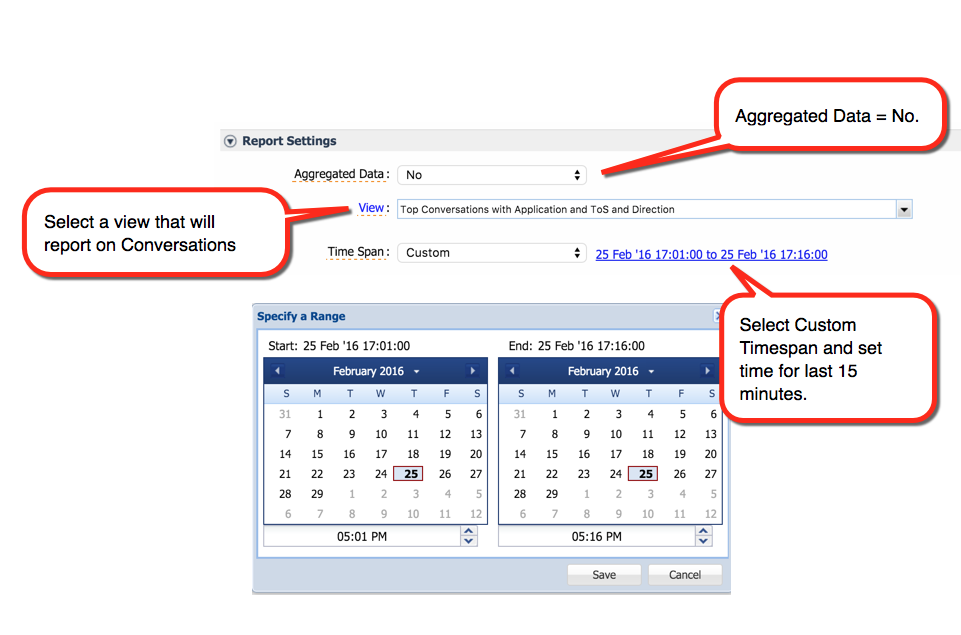
-
Create a filter with the Application IP configured to your host IP from the Top Hosts report that you ran in step 1.
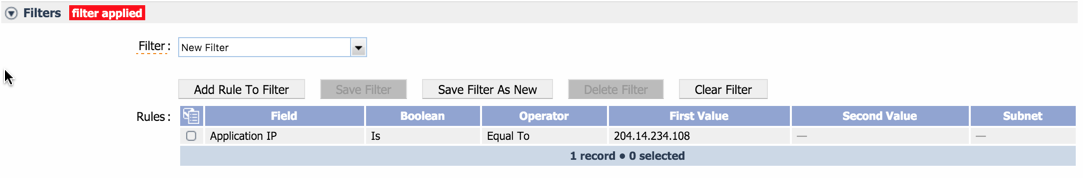
-
Click Get Results to run the report.

-
-
The screenshot below shows the resulting report. It contains conversations that occurred with our host. This report displays the top 10, but we can configure the system to display all results in the table.
Troubleshooting
Flow data is not displaying for my device
If flow data does not display for a device, you may need to check for traffic. Perform the following actions to confirm that SevOne NMS actually receives the data via tcpdump.
Log in to SevOne NMS appliance via command line interface and run one of the following commands.
$ tcpdump -i eth0 port 9996$ tcpdump -i eth0 port 9996 | grep '<ip address in question>'
If data comes into SevOne NMS, you should eventually see a message similar to the following example.
17:55:47.934113 IP <ip address question>.49359 > \ <SevOne>.9996: UDP, length 1464
If no data comes in from the IP address, there may be a routing issue.
Flow data is coming in, but nothing displays
If flow data comes in, but nothing displays, the version may be wrong.
Enter the following command to dump the first portions of the packets to the page.
$ tcpdump -XX -i eth0 port 999619:55:26.326485 IP <source>.52292 > <destination>.9996: UDP, length 14160x0000: 0030 482d 9e1b 0011 5d24 aec0 0800 4500 .0H-....]$....E.0x0010: 05a4 f187 0000 fb11 ce64 0aff ff0c cc1b .........d......0x0020: 2435 cc44 270c 0590 2b9f 0005 001d cada $5.Dâ...+.......0x0030: 5584 45a3 f32e 0cd7 dd44 8682 7d8d 0001 U.E......D..}...0x0040: 0000 aa94 ....19:55:26.326609 IP <source>.58101 > <destination>.9996: UDP, length 14280x0000: 0030 482d 9e1b 0011 5d24 aec0 0800 4500 .0H-....]$....E.0x0010: 05b0 b449 0000 f611 810a 0a00 8f98 cc1b ...I............0x0020: 2435 e2f5 270c 059c fa38 0007 001b cdb8 $5..â....8......0x0030: 2bdc 45a3 f32e 11a3 844e 29a1 03b4 0000 +.E......N).....0x0040: 0000 0a33In the above example, the first traffic is v5 (0005) and the second is v7 (0007), as indicated in the third row's sixth column. The last two digits in the column are the version.
The following is a visual aid to help find the version as indicated by the XX.
-::.----- IP <source>.----- > <destination>.9996: UDP, length ----0x0000: ---- ---- ---- ---- ---- ---- ---- ---- ----------------0x0010: ---- ---- ---- ---- ---- ---- ---- ---- ----------------0x0020: ---- ---- ---- ---- ---- --XX ---- ---- ----------------0x0030: ---- ---- ---- ---- ---- ---- ---- ---- ----------------0x0040: ---- ----Device configured to send flow but not appearing in SevOne NMS
Occasionally, while administering the SevOne NMS, you may run into an issue where Netflow devices or Interfaces do not appear in SevOne NMS after the devices have been configured to send those flows to the NMS. Very Frequently, this will be the result of some configuration issue, or unexpected requirement that is preventing the NMS from receiving or parsing those flow packets. The sub-sections below provide step-by-step guidance to troubleshoot the most common issues. When adding Netflow to the NMS, it is important to confirm the configuration is correct on both the Device and in the NMS.
Please check the following scenarios to determine where the issue may be.
Confirm that there are no rules in place that will prevent newly-found interfaces from being created / enabled
From SevOne NMS, navigate to Administration > Flow Configuration > Flow Rules. You will find there are rules set to determine whether a newly-found flow interface, meaning an interface for which we are newly receiving flows, will be enabled or disabled by default. Please check through these rules to confirm that the flow is not being blocked unintentionally.
Is the NetFlow traffic definitely reaching SevOne?
When this issue arises, it is often an issue where there is an unexpected network issue preventing the flows from reaching the NMS, such as an incorrectly configured firewall rule.
To rule this out, you will need to run a packet capture on the PAS or DNC that should be receiving these NetFlow packets.
-
Check in the NMS what port is configured to receive NetFlow on. By default, it is port 9996. This can be found by navigating to Administration > Cluster Manager > Cluster Settings tab > FlowFalcon subtab > field Incoming Port.
-
Check this against the device configuration. This is especially true if a non-standard port has been configured in the NMS.
-
If all is fine with the port configuration, keep this port number handy, as you will need it for a future step.
-
-
Run a packet capture on the SevOne Peer in question. If you do not see flow in this packet capture, it means that there is a network configuration issue that is preventing those packets from reaching the NMS such as, a bad firewall rule. Once the tcpdump has been started, you will see packets appearing noting direction and length.
-
Execute the following command from the Command Line Interface.
$ tcpdump port [Port] and host [Device IP] -s0 -
If the flow is coming in on the non-default interface or the NMS is running on a CentOS based version, which can be identified denoted by a 'c' in the name, you will need to use the -i flag to denote the network interface that this flow should be coming in on.
-
If you do not know, you can run the following command to identify the interface the flow should be coming in on.
$ route -n -
Once you have identified, the gateway that the flow will be arriving from, the far right-column from the output will show the name of the interface. i.e., eno1, ens32, etc.
-
Execute the following command to check the tcpdump.
$ tcpdump port [port] and host [deviceIP] -i [interfaceName] -s0
-
-
Confirm that the necessary template fields are being received
Once flow is confirmed, ensure that the flows being received, contain the necessary template details.
NetFlow includes template packets along with its flow packets. These are necessary for SevOne to be able to parse out the flow packets and know what the data included is. Because of this, there needs to be some uniformity in the NetFlow templates. Below, a number of fields are listed. Each o these fields need to be in the template for the NMS to be able to parse it out. The device, in question, needs to have its configuration modified to include the following fields.
- Source ip/port (ip4 or 6) (L4_SRC_ADDR/L4_SRC_PORT)- Dest ip/port (ip4 or 6) (L4_DST_ADDR/L4_DST_PORT)- Ingress interface (INPUT_SNMP)- Bandwidth (BYTES)- Number of packets (IN_PKTS/PKTS)- Start Time (FIRST_SWITCHED)- End Time (LAST_SWITCHED)- Source ip/port (ip4 or 6) (L4_SRC_ADDR/L4_SRC_PORT)- Dest ip/port (ip4 or 6) (L4_DST_ADDR/L4_DST_PORT)- Ingress interface (INPUT_SNMP)- Bandwidth (BYTES)- Number of packets (IN_PKTS/PKTS)- Start Time - any one of the following matching the end time unit. -- (FIRST_SWITCHED) -- (flowStartSeconds) -- (flowStartMilliseconds) -- (flowStartMicroseconds) -- (flowStartNanoseconds)- End Time - any one of the following matching the start time unit. -- (LAST_SWITCHED) -- (flowEndSeconds) -- (flowEndMilliseconds) -- (flowEndMicroseconds) -- (flowEndNanoseconds)To check if you are receiving flows, you can collect a packet capture and review it using a tool such as wireshark.
-
To collect a packet capture, execute the following command. To ensure that you will get at least one template packet, it is configured to run for 15 minutes.
$ timeout 15m tcpdump port [port] and host [deviceIP] -i [interfaceName] \-s0 -w/Path/to/tcpdump.pcap -
Once the packet capture has been downloaded, open the packet capture in wireshark, for example, or any other packet capture analysis tool. In this guide, wireshark is used.
-
You can find the flow template packets in wireshark using the following filter.
$ cflow.template_id -
If you do not see any packets after filtering for this, it means that you are not receiving the necessary template packets, and either the device is not properly configured to send templates, or there is an issue on the device preventing them from being sent.
-
If you do see packets, check to confirm if the template identifies the fields (mentioned above) necessary to parse. If any of them are missing, you will be unable to parse the flow.
-
You may need to check multiple templates. Often you will receive an additional template under a different template id called an Options template which contains additional details. Each template will have a specific ID, and the flow packets they are associated with, will point to which template ID they are associated with.
-
If there is any confusion on the fields being sent, here is the list.
List of field IDsnfl[2]="IN_PKTS"nfl[3]="FLOWS"nfl[4]="PROTOCOL"nfl[5]="SRC_TOS"nfl[6]="TCP_FLAGS"nfl[7]="L4_SRC_PORT"nfl[8]="IPV4_SRC_ADDR"nfl[9]="SRC_MASK"nfl[10]="INPUT_SNMP"nfl[11]="L4_DST_PORT"nfl[12]="IPV4_DST_ADDR"nfl[13]="DST_MASK"nfl[14]="OUTPUT_SNMP"nfl[15]="IPV4_NEXT_HOP"nfl[16]="SRC_AS"nfl[17]="DST_AS"nfl[18]="BGP_IPV4_NEXT_HOP"nfl[19]="MUL_DST_PKTS"nfl[20]="MUL_DST_BYTES"nfl[21]="LAST_SWITCHED"nfl[22]="FIRST_SWITCHED"Additional fields can be found on the official Cisco documentation for NetFlow.
-
Confirm if flow is being dropped by the NMS or not
Long Flows
In SevOne NMS, there is a setting for dropping overly long flows. This setting exists because NMS can stall while handling large flow packets, resulting in performance issues. By default, this is set to 120 seconds in SevOne NMS. If you exceed flows of a duration longer than this setting, by default, you will drop those flow packets.
When a device is set up to export flow records it will use the following conditions to determine when to send flows.
-
The active timer expires for long-lived flows. For example, the interval set by a setting like ip flow-cache timeout active 1.
-
The flow becomes inactive after a period set by a parameter known as the inactive timeout. Often times, this is set at 15 seconds. For example, this can happen if no traffic is seen on a TCP connection or if the flow is using UDP.
This can be confirmed by filtering on the following field in wireshark.
cflow.timedelta > 120To resolve this issue, update the Flow configuration on the device to set the following or equivalent settings for your specific device.
-
Inactive Timeout
-
Active Timeout
-
Update Timeout (applicable to Cisco Flexible)
-
-
The flow ended as observed by the TCP flags such as, finished (FIN) or reset (RST).
Not all hardware platforms support this.
-
Flows are exported early if the flow cache becomes full. Cisco calls this emergency expire where flows are randomly chosen for early expiry at 90% of the cache being full. When this occurs, flows are dropped and an Admin Message is generated that will pop-up when a user with admin privileges logs into the NMS.
SevOne does not recommend but if you wish to continue maintaining the long flows, you may disable the Drop Long Flows in the Cluster Manager by navigating to Administration > Cluster Settings tab > FlowFalcon subtab > field Drop Long Flows.
Zero and Negative Duration Flows
Conversely, flows with zero or negative duration are dropped. This can be confirmed by filtering the tcpdump on the following field in wireshark.
cflow.timedelta <= 0If you experience this issue, it is usually a sign of a problem existing on the device in question.
This section is specific to NetFlow or cFlow. For sFlow, a special tool, sflowtool, is used which parses the received NetFlow and redirects it to SevOne to parse correctly.
After executing the scenarios above, if you are still experiencing an issue, please contact SevOne Support.
Terms
|
Flow |
A series of packets that have the same source and destination IP address, source and destination port, transport protocol, etc. |
|
Flow Record |
A collection of information about a flow, including protocol, source and destination IP address, source and destination port, amount of data transmitted, date and time of transmission, etc. |