Table of Contents (Start)
- Topics
- Introducing SevOne
- Login
- Startup Wizard
- Dashboard
- Global Search - Advanced Search
- Report Manager
- Report Attachment Wizard
- Report Properties
- Report Interactions
- Instant Graphs
- TopN Reports
- Alerts
- Alert Archives
- Alert Summary
- Instant Status
- Status Map Manager
- Edit Maps
- View Maps
- FlowFalcon Reports
- NBAR Reports
- Logged Traps
- Unknown Traps
- Trap Event Editor
- Trap Destinations
- Trap Destination Associations
- Policy Browser
- Create and Edit Policies
- Webhook Definition Manager
- Threshold Browser
- Create and Edit Thresholds
- Probe Manager
- Discovery Manager
- Device Manager
- New Device
- Edit Device
- Object Manager
- High Frequency Poller
- Device Summary
- Device Mover
- Device Groups
- Object Groups
- Object Summary
- Object Rules
- VMware Browser
- AWS Plugin
- Azure Plugin (Public Preview)
- Calculation Plugin
- Database Manager
- Deferred Data Plugin
- DNS Plugin
- HTTP Plugin
- ICMP Plugin
- IP SLA Plugin
- JMX Plugin
- NAM
- NBAR Plugin
- Portshaker Plugin
- Process Plugin
- Proxy Ping Plugin
- SDWAN Plugin
- SNMP Plugin
- VMware Plugin
- Web Status Plugin
- WMI Plugin
- xStats Plugin
- Indicator Type Maps
- Device Types
- Object Types
- Object Subtype Manager
- Calculation Editor
- xStats Source Manager
- User Role Manager
- User Manager
- Session Manager
- Authentication Settings
- Preferences
- Cluster Manager
- Maintenance Windows
- Processes and Logs
- Metadata Schema
- Baseline Manager
- FlowFalcon View Editor
- Map Flow Objects
- FlowFalcon Views
- Flow Rules
- Flow Interface Manager
- MPLS Flow Mapping
- Network Segment Manager
- Flow Protocols and Services
- xStats Log Viewer
- SNMP Walk
- SNMP OID Browser
- MIB Manager
- Work Hours
- Administrative Messages
- Enable Flow Technologies
- Enable JMX
- Enable NBAR
- Enable SNMP
- Enable Web Status
- Enable WMI
- IP SLA
- SNMP
- SevOne Data Publisher
- Quality of Service
- Perl Regular Expressions
- Trap Revisions
- Integrate SevOne NMS With Other Applications
- Email Tips and Tricks
- SevOne NMS PHP Statistics
- SevOne NMS Usage Statistics
- Glossary and Concepts
- Map Flow Devices
- Trap v3 Receiver
- Guides
- Quick Start Guides
- AWS Quick Start Guide
- Azure Quick Start Guide (Public Preview)
- Data Miner Quick Start Guide
- Flow Quick Start Guide
- Group Aggregated Indicators Quick Start Guide
- IP SLA Quick Start Guide
- JMX Quick Start Guide
- Metadata Quick Start Guide
- RESTful API Quick Start Guide
- Self-monitoring Quick Start Guide
- SevOne NMS Admin Notifications Quick Start Guide
- SNMP Quick Start Guide
- Synthetic Indicator Types Quick Start Guide
- Topology Quick Start Guide
- VMware Quick Start Guide
- Web Status Quick Start Guide
- WMI Quick Start Guide
- xStats Quick Start Guide
- xStats Adapter - Accedian Vision EMS (TM) Quick Start Guide
- Deployment Guides
- Automated Build / Rebuild (Customer) Instructions
- Generate a Self-Signed Certificate or a Certificate Signing Request
- SevOne Best Practices Guide - Cluster, Peer, and HSA
- SevOne Data Platform Security Guide
- SevOne NMS Implementation Guide
- SevOne NMS Installation Guide - Virtual Appliance
- SevOne NMS Advanced Network Configuration Guide
- SevOne NMS Installation Guide
- SevOne NMS Port Number Requirements Guide
- SevOne NMS Upgrade Process Guide
- SevOne Physical Appliance Pre-Build BIOS and RAID Configuration Guide
- SevOne SAML Single Sign-On Setup Guide
- Cloud Platforms
- Other Guides
- Quick Start Guides
SevOne NMS Admin Notifications Quick Start Guide
SevOne Documentation
All documentation is available from the IBM SevOne Support customer portal.
© Copyright International Business Machines Corporation 2024.
All right, title, and interest in and to the software and documentation are and shall remain the exclusive property of IBM and its respective licensors. No part of this document may be reproduced by any means nor modified, decompiled, disassembled, published or distributed, in whole or in part, or translated to any electronic medium or other means without the written consent of IBM.
IN NO EVENT SHALL IBM, ITS SUPPLIERS, NOR ITS LICENSORS BE LIABLE FOR ANY DAMAGES, WHETHER ARISING IN TORT, CONTRACT OR ANY OTHER LEGAL THEORY EVEN IF IBM HAS BEEN ADVISED OF THE POSSIBILITY OF SUCH DAMAGES, AND IBM DISCLAIMS ALL WARRANTIES, CONDITIONS OR OTHER TERMS, EXPRESS OR IMPLIED, STATUTORY OR OTHERWISE, ON SOFTWARE AND DOCUMENTATION FURNISHED HEREUNDER INCLUDING WITHOUT LIMITATION THE WARRANTIES OF DESIGN, MERCHANTABILITY OR FITNESS FOR A PARTICULAR PURPOSE, AND NONINFRINGEMENT.
IBM, the IBM logo, and SevOne are trademarks or registered trademarks of International Business Machines Corporation, in the United States and/or other countries. Other product and service names might be trademarks of IBM or other companies. A current list of IBM trademarks is available on ibm.com/trademark.
About
SevOne NMS self-monitoring based on integration with Prometheus, expands the concepts of SevOne admin messages. Prometheus is chosen for its ability to collect small-scale, short duration data; while also serving as a backup notification system that is fully decoupled from SevOne NMS. This integration is provided to the users at no additional cost.
Each NMS peer periodically checks itself and other appliances for potential problems and records the information locally. SevOne NMS automatically aggregates and stores this information for a short duration by leveraging Prometheus and Alertmanager. Alertmanager notifies the NMS administrators if peers fail to push updates to Prometheus, or if the data it receives indicates a potential problem.
As Prometheus operates outside of SevOne NMS software, it is not affected by SevOne NMS outages unless the host(s) running it are completely unavailable. Prometheus can be configured to run redundantly so the odds of missing a notification for a critical outage is significantly reduced. For example, if MySQL goes down, the NMS host is neither able to collect self-monitoring data nor alert on it, whereas Prometheus alert manager is not affected by this outage. This helps the NMS administrators by notifying appropriate individuals of potential NMS service disruption(s) by the system, prior to service tickets getting opened by the end-users.
The original NMS self-monitoring tool is still required for monitoring SevOne NMS appliance performance metrics such as utilization, process statistics, database performance, etc. and storage of raw data for one-year.
SevOne NMS now comes with pre-configured and ready-to-use admin notifications. All services are up and running enabling the collection of out-of-the-box metrics. The alerts are predefined and triggered automatically.
In this guide if there is,
-
[any reference to master] OR
-
[[if a CLI command contains master] AND/OR
-
[its output contains master]],
it means leader.
And, if there is any reference to slave, it means follower.
Starting SevOne NMS 6.7.0, MySQL has moved to MariaDB 10.6.12 .
Admin Notifications
The Admin notifications trigger if:
-
Peers stop reporting status updates to the Prometheus alertmanager pipeline
-
Peers are in split-brain or unknown states
-
Failovers take too long to execute or do not complete
-
Critical processes are running on appliances based on their type (PAS vs DNC) and role (primary vs. secondary (HSA))
-
Ingestion is delayed or the indicators per second (IPS) load on an appliance exceeds the specification
-
Writes to an appliance's database fails
Configure Alertmanager
By default, the email notifications from Prometheus' alertmanager are disabled. However, services for both Prometheus and alertmanager are running in the background to aggregate metrics and to evaluate the alerts.
Administration > Access Configuration > User Role Manager has two user-level permissions for prometheus alertmanager.
-
Can consume Admin notifications
-
User with proper permissions can subscribe/unsubscribe to Alertmanager email notifications from Administration > My Preferences > field Admin Notifications.
-
Subscribed user will receive notifications for triggered alert. Unsubscribed user will not receive any notifications.
-
User with invalid permission will have an option to edit the field.
-
-
Can edit Admin Notifications
-
User with proper permission can enable/disable Alertmanager email service from Administration > Cluster Manager > Cluster Settings tab > General subtab > field Enable Alert-Manager Admin Notifications. If service is disabled then no emails will be sent. If enabled, subscribed users will receive the emails.
-
User with invalid permissions will not have an option to edit the field; it is disabled.
-
-
AlertManager email service is enabled by default from Administration > Cluster Manager > Cluster Settings tab > General subtab > field Enable Alert-Manager Admin Notifications.
-
Each user is required to subscribe to notifications manually from Administration > My Preferences > field Admin Notifications.
-
Enable AlertManager email service from Administration > Cluster Manager > Cluster Settings tab > General subtab > field Enable Alert-Manager Admin Notifications.
-
Subscribe to notifications from Administration > My Preferences > field Admin Notifications.
Verify using Prometheus Graphical User Interface
-
To check if the data collection is working correctly, login to the Prometheus graphical user interface and verify that all targets are up and green. For example, enter URL http://<Cluster Leader IP address>/prometheus/targets in your web browser. Repeat this for Cluster Leader's HSA, if there is one.
-
To check if all the rules are properly parsed and operational, enter http://<Cluster Leader IP address>/prometheus/rules in your web browser.
-
To check for active alerts, enter http://<Cluster Leader IP address>/prometheus/alerts in your web browser. If any alerts are being sent, you will see the details for them.
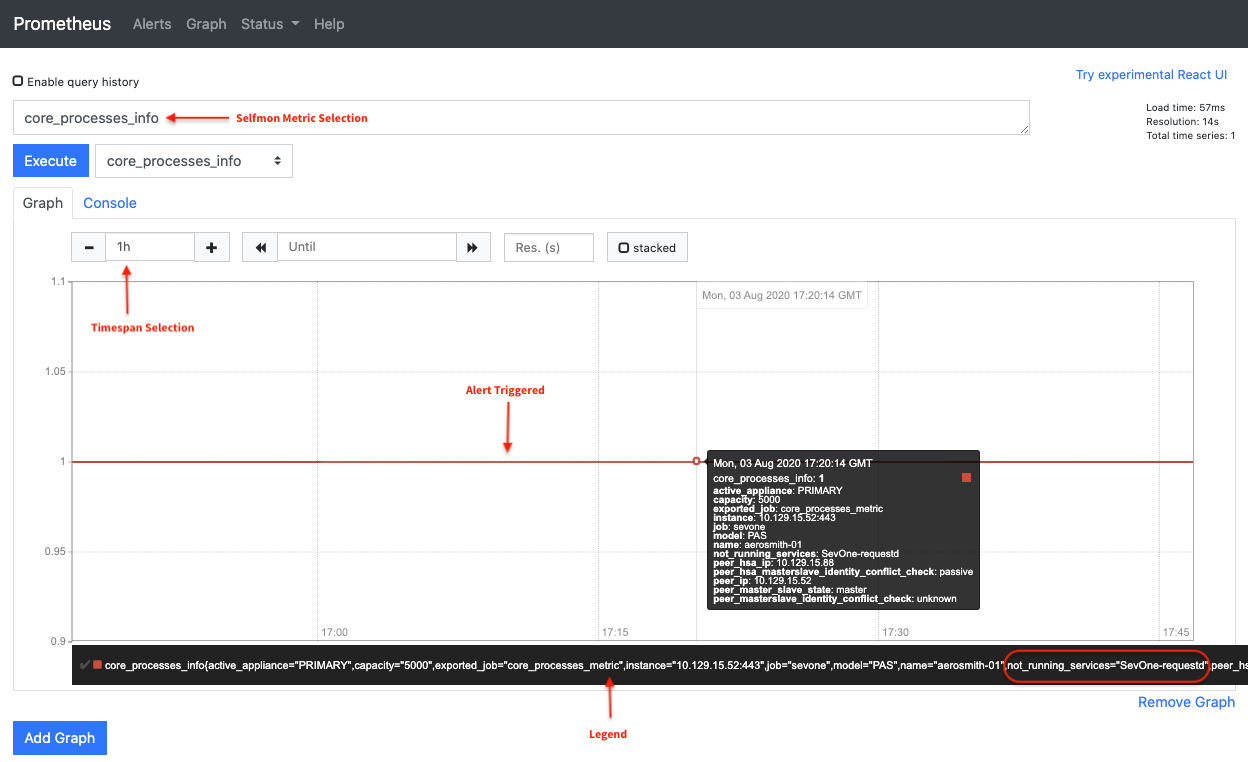
After SevOne-requestd process is turned off on an active appliance, alert triggering appears as the following in the graphical user interface.
Value of 1 indicates that the alert has been triggered.
Verify using Alertmanager Graphical User Interface
-
To check if Alertmanager is working properly, enter http://<Cluster Leader IP address>/alertmanager/#/status in your web browser.
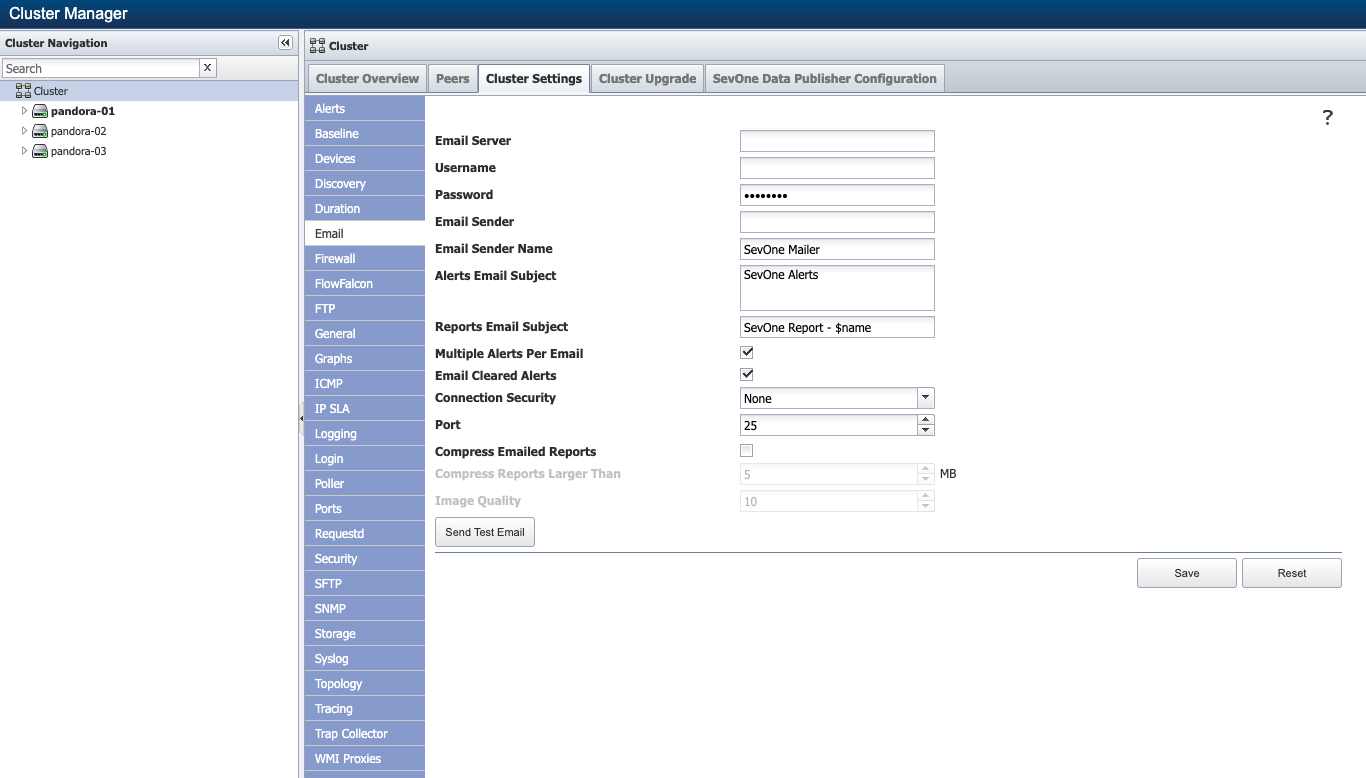
The Alertmanager service to start a mail server must be configured from your NMS > Administration > Cluster Manager > Cluster Settings tab > Email subtab.
-
Alertmanager is a separate service from Prometheus and much of the information for alertmanager is exposed from the Prometheus user interface.
-
To see active alerts, acknowledge and silence them from Prometheus' user interface. Enter http://<Cluster Leader IP address>/prometheus in your web browser.
Notification Delivery Mechanisms
Prometheus can send notifications via email and Webhooks. Administrators may refer to https://prometheus.io/docs/alerting/latest/configuration/#webhook_config to set up Webhook notification.
SNMP Trap Support
SNMP traps are not currently supported by Prometheus.
Port Configuration
The following ports are required to be open on both the Cluster Leader and its HSA, if there is one.
|
Port |
Service |
|
TCP 9094 |
Alertmanager clustering port |
|
UDP 9094 |
|
|
TCP 80 / 443 |
Prometheus and Alertmanager Uses port 80 (for HTTP protocol) and port 443 (for HTTPS protocol) |
It is expected that both the Cluster Leader and its HSA can communicate over these ports with each other. This is important for alert deduplication. If this requirement is not met then it will cause duplicate alerts to be sent.
About Prometheus
Prometheus is used for self-monitoring the SevOne NMS cluster. Prometheus collects various metrics of components of the SevOne NMS cluster and generates alerts if an alerting rule is satisfied. SevOne NMS users can specify their email address to receive notifications on the alerts they are interested in. This guide helps you walkthrough the basic concepts and configurations.
Architecture
Prometheus has two main functions.
-
Collect metrics
-
Send alerts based on metric rules
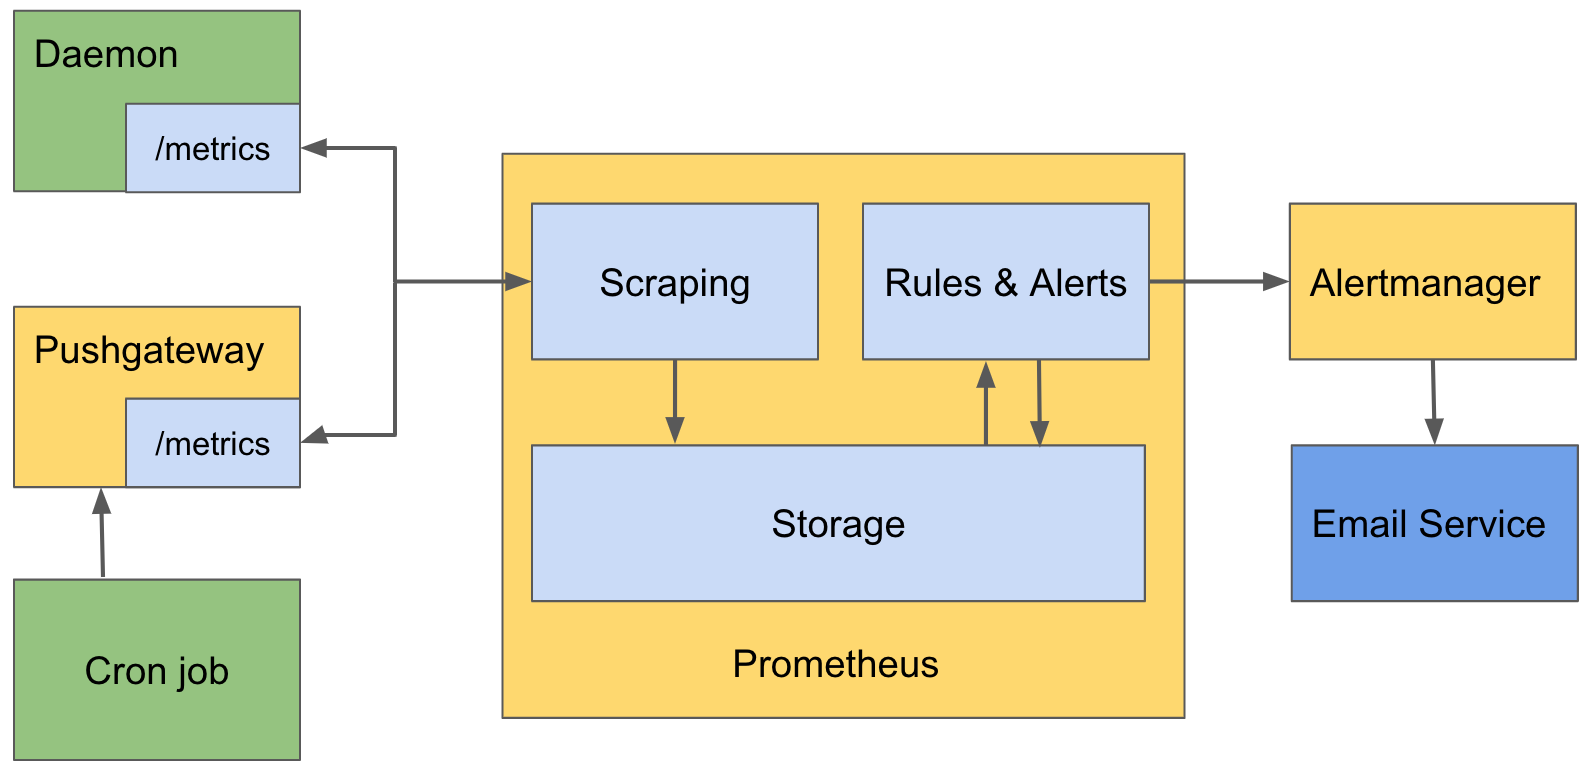
Collect Metrics from Long Running Daemon
To collect, known as scrape in Prometheus, metrics from a long running daemon, Prometheus requires the daemon to expose an endpoint. For example, /metrics, which returns a list of {metric_name, value} pairs as a response. Prometheus calls the endpoint periodically and saves the resulting metrics inside its storage.
Collect Metrics from Cron Job
To collect metrics from a cron job, Prometheus cannot simply ask the cron job to expose an endpoint because the cron job is not long-running. When the cron job completes, there is no way for Prometheus to collect the metrics. To solve this problem, Prometheus is bundled with a daemon called Pushgateway. The cron job can send its metrics to Pushgateway. Pushgateway saves the metrics and expose the /metrics for Prometheus to scrape.
Rules & Alerts
Rules can be defined on top of the collected metrics in Prometheus. When a rule is satisfied, Prometheus generates an alert. For example, if you have a metric for disk free space, you can define a rule disk free space < 1G so that when the disk free space of an appliance is less than 1G, an alert is generated. After Prometheus generates an alert, it sends the alert to another daemon called Alertmanager. Alertmanager receives the alert and notify any users that are interested in it by email.
Prometheus Deployment in SevOne NMS Cluster
The following figure shows the architecture of Prometheus deployment in a 4-peer SevOne NMS cluster.
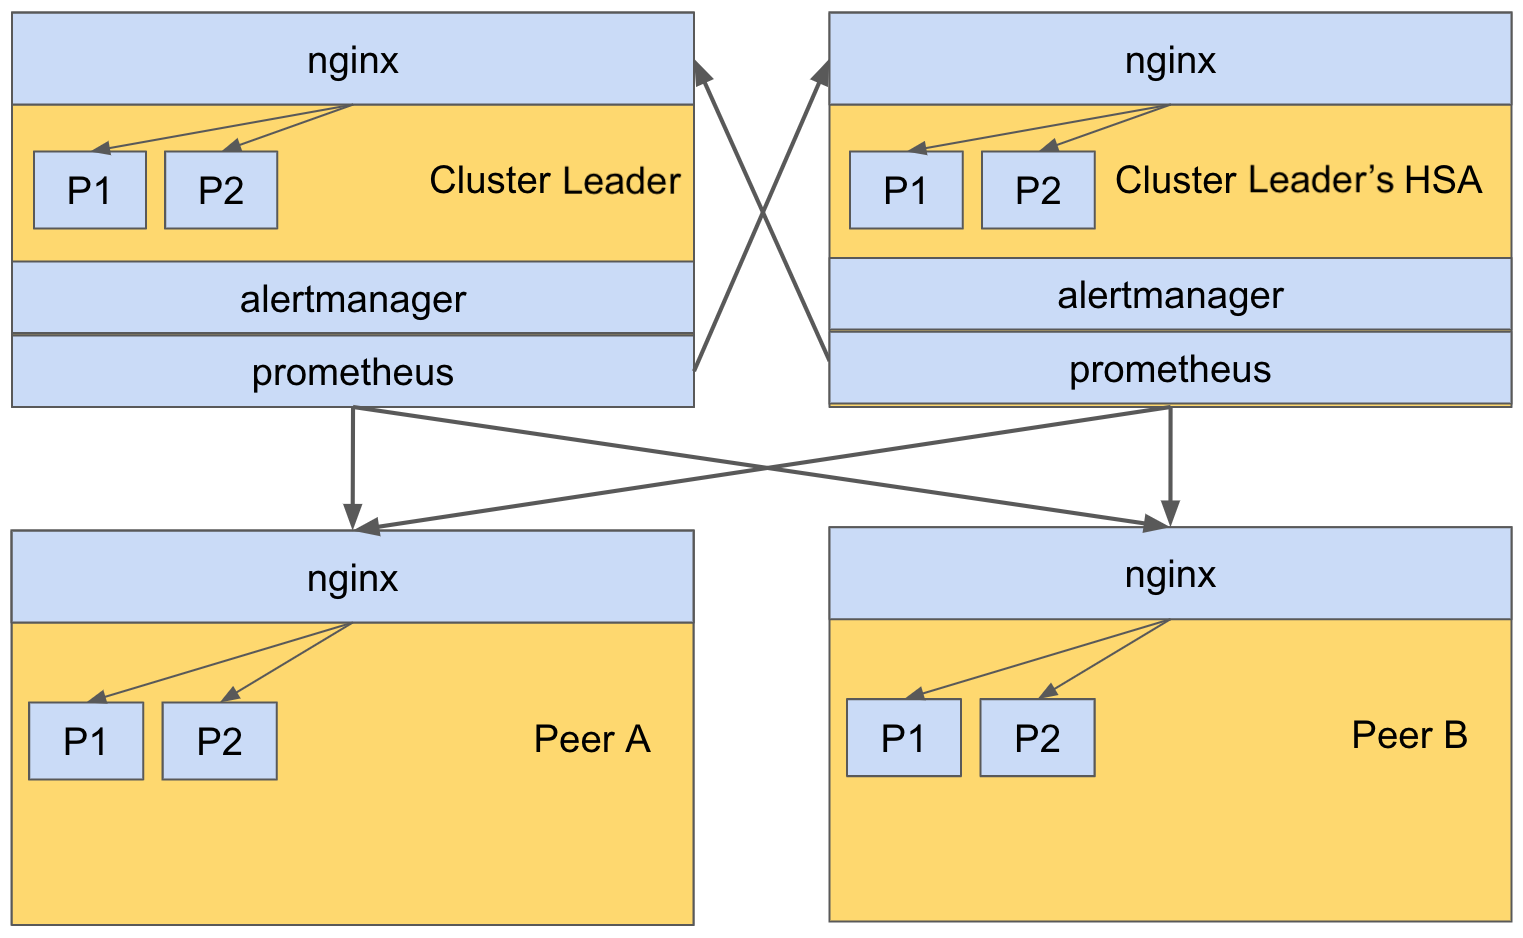
Prometheus and Alertmanager are deployed only on the Cluster Leader and its HSA, in an active-active mode. Prometheus on both the Cluster Leader and its HSA scrape the metrics of processes on all peers via nginx. Nginx is responsible to route a scrape request to an appropriate /metrics endpoint exposed by a process. For example, if Prometheus on the Cluster Leader would like to scrape the metrics of process P1 on Peer A, Prometheus will send a request to Peer A. The nginx on Peer A receives the request and routes it to the /metrics endpoint on process P1.
In this example, prometheus and alertmanager are configured with a set of alerting rules to achieve self-monitoring. You must configure an email address to receive alert notifications. Other than that, it works right out-of-the-box (OOTB). Please refer to Set up OOTB Rules for Self-monitoring to set rules and Set up Alert Email Configuration to set email address(es).
Self-monitoring System Components
The self-monitoring system is currently comprised of 5 distinct components.
|
Component |
Service |
Port |
Description |
URL |
|
1. |
Prometheus |
|
The main data collection service (only runs on the Cluster Leader and its HSA). |
https://www.prometheus.io/docs/introduction/overview/ |
|
2. |
Alertmanager |
|
The main alerting service (only runs on the Cluster Leader and its HSA). |
https://www.prometheus.io/docs/alerting/latest/alertmanager/ |
|
Alertmanager |
TCP 9094
|
The high availability clustering port for alertmanager. |
https://github.com/prometheus/alertmanager#high-availability |
|
|
3. |
Pushgateway |
9091
|
Local service to store metrics for ephemeral scripts. It will supersede SevOne-statsd (runs on all peers). |
https://prometheus.io/docs/practices/pushing/ |
|
4. |
Node Exporter |
9100
|
Local service that exposes various metrics for each peer (runs on all peers). |
https://github.com/prometheus/node_exporter |
Along with these 4 distinct components, the 5th component are the following scripts available to push the metrics to the local Pushgateway installed on each peer. The scripts can be found in /usr/local/scripts/prometheus. The scripts run through cron at a predetermined interval. Each script collects its log in individual logs files in /var/log/prometheus directory.
|
Component |
Script |
Description |
Core Schedule |
Log File |
|
5. |
SevOne-notify-core-processes-status.py |
Exposes metrics for the running core processes. |
Every 1 minute |
SevOne-notify-core-processes-status.log |
|
SevOne-notify-peer-state-check.py |
Exposes metrics for the peer state. |
Every 1 minute |
SevOne-notify-peer-state-check.log |
|
|
SevOne-notify-peer-takeover-status.py |
Exposes metrics during HSA failover/takeover. |
Every 1 minute |
SevOne-notify-peer-takeover-status.log |
|
|
SevOne-notify-DBTable-crash.py |
Exposes when database table crashes and it cannot be repaired automatically. |
Every day at 6:00 am UTC |
SevOne-notify-DBTable-crash.log |
|
|
SevOne-notify-split-brain |
Exposes metrics for the split-brain state. |
Every 1 minute |
SevOne-notify-split-brain.log |
The following processes expose the metrics to Prometheus. But, these are exposed as local port only and are only accessible from within the system.
|
Process |
Description |
Local Port |
|
SevOne-datad |
Exposes metrics when SevOne-datad experiences database write errors. |
60123 |
|
SevOne-ingestion-resolved |
Exposes metrics if a peer is overloaded, i.e. if a peer exceeds its Indicators per second (IPS) capacity. |
6666 |
# SevOne-datad metrics$ curl http://localhost:60123/metrics# SevOne-ingestion-resolved metrics$ curl http://localhost:6666/metricsGather Data using Prometheus
Prometheus service gathers data by polling predefined REST API end points. The URLs expose the metrics that Prometheus parses and stores locally. A list of all configured collection targets can be found on the Cluster Leader's Prometheus instance, CLUSTER_LEADER_IP/prometheus/targets. The following table lists the URLs that Prometheus polls periodically.
|
URL |
Service |
|
CLUSTER_LEADER_IP/prometheus/metrics |
Prometheus metrics. |
|
https://PEER_IP/metrics/datad |
SevOne-datad metrics for a peer. |
|
https://PEER_IP/metrics/ingestion-resolved |
SevOne-ingestion-resolved metrics per peer. |
|
https://PEER_IP/metrics/push |
Pushgateway metrics per peer. |
|
https://PEER_IP/metrics/node |
Node Exporter metrics per peer. |
All metrics are under a common /metrics/ endpoint. This allows you to use the nginx proxy to expose all local ports. The local ports are not accessible from outside a peer and all communication with the metrics endpoints is over TLS.
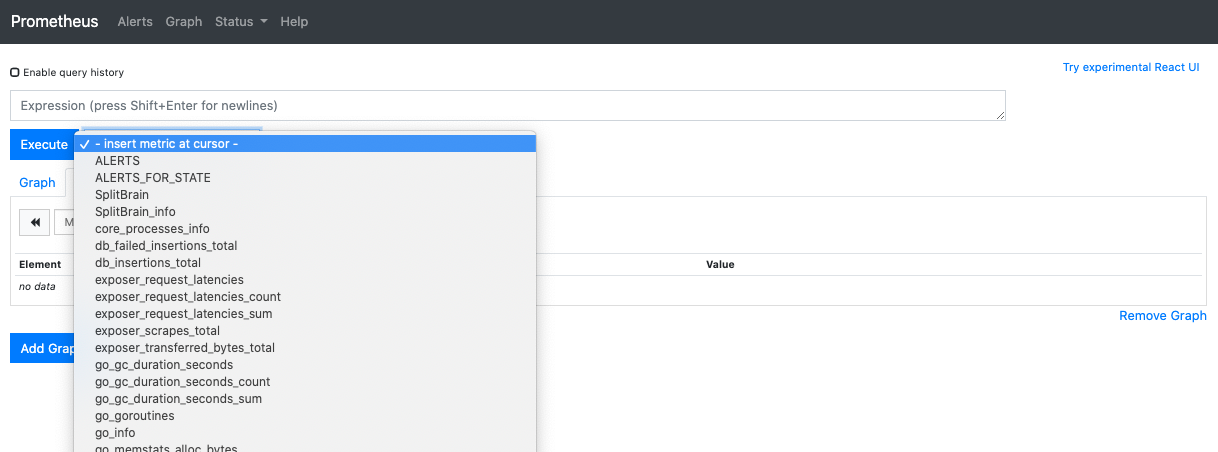
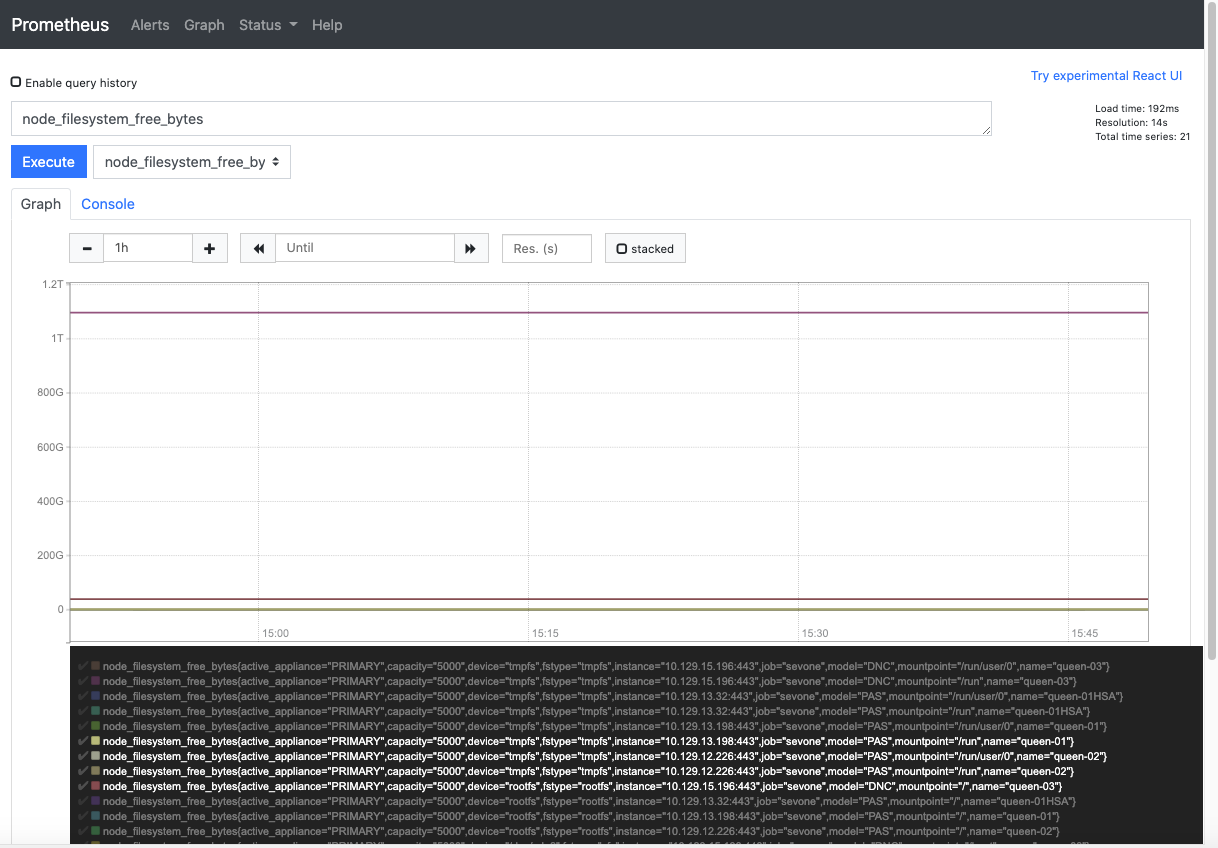
View Metrics
The metrics are available for the entire cluster on Prometheus user interface.
-
Navigate to http://<Cluster Leader IP address>/prometheus.
-
Click on - insert metric at cursor drop-down to view the collected metrics.
-
Select the metric you want to see. For example, node_filesystem_free_bytes.
-
Select Graph tab.
-
Click Execute button.
The graph for the selected metric is plotted for all the peers in the cluster. The default time interval is 1 hour, but it can be changed. The individual peer data can be selected or unselected by clicking on  in the legend.
Start & Run Self-monitoring System
The main services are owned by supervisorctl and must be running by default based on the peer type. If a service needs to be started manually, execute the following commands.
$ supervisorctl start prometheus $ supervisorctl start alertmanager $ supervisorctl start node_exporter $ supervisorctl start pushgatewayEach service keeps its log files in /var/log/prometheus. In case of an error, check the log files in this directory for the probable causes.
When the services are operational, the following URLs can be used.
|
URL |
Service |
|
<Cluster Leader IP address>/prometheus |
Prometheus |
|
<Cluster Leader IP address>/alertmanager |
Alert Manager |
Configure Self-monitoring System
All communication between prometheus, alertmanager, and various scrape nodes are secured via basic_auth provided by Nginx. The following command can be used to configure the basic_auth username and password.
If your appliance is on SevOne NMS version <= 5.7.2.25 and you have configured prometheus without SevOne-act prometheus credential-change script, then you must follow these steps.
-
Upgrade to SevOne NMS 5.7.2.32.
-
Upgrade to SevOne NMS 6.1.0.
-
By default, prometheus will be disabled until you configure it with SevOne-act prometheus credential-change script (please see the command below). This is a required step.
$ SevOne-act prometheus credential-change --username <username> --password <password>The username and password entered in the command above can be used by SevOne NMS user to view prometheus and alertmanager via the Web user interface. The configuration URLs for prometheus and alertmanager can be found below.
The command above also auto-generates the username and password that can be used for API communication between prometheus, alertmanager, and scrape nodes.
To access SevOne NMS Graphical User Interface, you are required to set the password. Execute the following command to set it.
The default username is SevOneUser.
$ SevOne-act prometheus credential-change --username SevOneUser --password <password>If you choose to change the username and password, enter the new <username> and <password> in the following command.
$ SevOne-act prometheus credential-change --username <username> --password <password>
The configuration files can be found in the following location.
|
File |
Description |
|
/etc/prometheus/prometheus.yml |
The main Prometheus configuration file. It includes the configuration for each peer in the cluster and the available Alert Managers. |
|
/etc/prometheus/rules.yml |
Defines the rules to use in order to trigger alerts. |
|
/etc/alertmanager/alertmanager.yml |
The Alert Manager configuration file. It is automatically populated with the configured SMTP settings in SevOne NMS upon the start of the service(s). |
Enable / Disable Rule for Alert
Rules to trigger alerts are defined in /etc/prometheus/rules.yml file.
groups: - name: SevOne Rules rules: - alert: SevOne Core Processes are not running expr: core_processes_info{not_running_services!=""} for: 10s labels: severity: critical annotations: summary: "SevOne Core Processes like {{ $labels.not_running_services }} are not running on {{ $labels.peer_ip }}." description: "Please run `SevOne-act check services` on {{ $labels.peer_ip }}." - alert: SevOne Peer State information unavailable expr: peer_state_info{healthy="0"} for: 10s labels: severity: critical annotations: summary: "Peer State information is unavailable on a peer" description: "{{ $labels.peerstateinfo }}"To disable an alert from being triggered, using a text editor of your choice, you may open /etc/prometheus/rules.yml file to comment out the alert block you want to disable (by adding the #). Save the file and restart the prometheus service.
After an upgrade, /etc/prometheus/rules.yml file is subject to be reset. Although the file can be modified, you must proceed with CAUTION!
groups: - name: SevOne Rules rules: # - alert: SevOne Core Processes are not running # expr: core_processes_info{not_running_services!=""} # for: 10s # labels: # severity: critical # annotations: # summary: "SevOne Core Processes like {{ $labels.not_running_services }} are not running on {{ $labels.peer_ip #}}." # description: "Please run `SevOne-act check services` on {{ $labels.peer_ip }}." - alert: SevOne Peer State information unavailable expr: peer_state_info{healthy="0"} for: 10s labels: severity: critical annotations: summary: "Peer State information is unavailable on a peer" description: "{{ $labels.peerstateinfo }}"To enable an alert that is currently disabled, using a text editor of your choice, you may open /etc/prometheus/rules.yml file to uncomment out the alert block (by removing the #). Save the file and restart the prometheus service.
To validate the syntax of /etc/prometheus/rules.yml file prior to running the prometheus application normally, execute the following command.
$ promtool check rules /etc/prometheus/rules.ymlChecking /etc/prometheus/rules.yml SUCCESS: 1 rules foundThe response from this command lets you know how many rules are configured in the file.
When any change is made to /etc/prometheus/rules.yml file, you are required to restart the prometheus service for the changes to take effect. Execute the following command.
$ supervisorctl restart prometheusFor details on how to configure Prometheus and Alert Manager, please refer to the following configuration URLs.
|
Service |
Configuration URL |
|
Prometheus |
https://prometheus.io/docs/prometheus/latest/configuration/configuration/ |
|
Alert Manager |
https://www.prometheus.io/docs/alerting/latest/alertmanager/ |
Set up OOTB Rules for Self-monitoring
-
Using a text editor of your choice, open the Prometheus configuration file in /etc/prometheus/prometheus.yml. The rule_files section lists the path of all the rule files.
After an upgrade, /etc/prometheus/prometheus.yml file is subject to be reset. Although the file can be modified, you must proceed with CAUTION!
Example: /etc/prometheus/prometheus.yml file$ vi /etc/prometheus/prometheus.yml# my global configglobal:scrape_interval: 1m # Set the scrape interval to every15seconds. Default is every1minute.evaluation_interval: 15s # Evaluate rules every15seconds. Thedefaultis every1minute.# scrape_timeout is set to the globaldefault(10s).external_labels:dc: master1# Alertmanager configurationalerting:alert_relabel_configs:- source_labels: [dc]regex: (.+)\d+target_label: dcalertmanagers:- static_configs:scheme: httpfile_sd_configs:- files:-'alertmanager_peers.json'refresh_interval: 1m# Load rules once and periodically evaluate them according to the global'evaluation_interval'.rule_files:-"rules.yml"# A scrape configuration containing exactly one endpoint to scrape:# Here it's Prometheus itself.scrape_configs:# The job name is added as a label `job=<job_name>` to any timeseries scraped fromthisconfig.- job_name:'prometheus'static_configs:- targets: ['localhost:9090']- job_name:'sevone'tls_config:insecure_skip_verify:truescheme:'https'file_sd_configs:- files:-'prometheus_peers.json'refresh_interval: 1mrelabel_configs:- source_labels: [__address__]regex:'[^/]+(/.*)'# capture'/...'parttarget_label: __metrics_path__ # change metrics path- source_labels: [__address__]regex:'([^/]+)/.*'# capture host:porttarget_label: __address__ # change target -
Using a text editor of your choice, you may open each rule file to see its details. The rules are readable. As required, more rules will be added.
Example: /etc/prometheus/rules.yml fileAfter an upgrade, /etc/prometheus/rules.yml file is subject to be reset. Although the file can be modified, you must proceed with CAUTION!
$ vi /etc/prometheus/rules.ymlgroups:- name: SevOne Rulesrules:- alert: SevOne Core Processes are not runningexpr: core_processes_info{not_running_services!=""}for: 10slabels:severity: criticalannotations:summary:"SevOne Core Processes like {{ $labels.not_running_services }} are not running on {{ $labels.peer_ip }}."description:"Please run `SevOne-act check services` on {{ $labels.peer_ip }}."- alert: SevOne Peer State information unavailableexpr: peer_state_info{healthy="0"}for: 10slabels:severity: criticalannotations:summary:"Peer State information is unavailable on a peer"description:"{{ $labels.peerstateinfo }}"- alert: IngestionPipelineOverloadexpr: incoming_data_points{State="Overload"} >0annotations:title:'Ingestion Pipeline Overload'description:'The incoming data points per second exceeds the pipeline limit.'labels:severity:'critical'- alert: HighDbInsertionErrorRateexpr: rate(db_failed_insertions_total[5m]) / rate(db_insertions_total[5m]) >0.5for: 1mannotations:title:'SevOne-datad has a high database insertion error rate'description:'The database insertion error rate of SevOne-datad has been higher than 50% for more than 1 minute.'labels:severity:'critical'- alert: PAS-HSA Pair Split Brainexpr: SplitBrain_info{notify ="1"}for: 10slabels:severity: pageannotations:summary:"{{ $labels.exported_job }} in Split Brain"description:" Current state is {{ $labels.current_state }}\n pair_status: {{ $labels.pair_status }}"- alert: SevOne Take Over Actionexpr: take_over_info{healthy="0"}for: 1slabels:severity: criticalannotations:summary:"Peer take over time exceeds set time"description:"Please check take over action : {{ $labels.takeoverinfo }}"
Set up Alert Email Configuration
You may optionally configure email addresses to receive Alert notifications. From SevOne NMS user interface, if you have set up the details in Administration > Cluster Manager > Cluster Settings tab > Email subtab, then the SMTP settings will be set in /etc/alertmanager/alertmanager.yml when alertmanager service has been started.
$ supervisorctl start alertmanager-
In Cluster Leader and Cluster Leader's HSA, using a text editor of your choice, edit /etc/alertmanager/alertmanager.yml file.
After an upgrade, /etc/alertmanager/alertmanager.yml file is subject to be reset. Although the file can be modified, you must proceed with CAUTION!
$vi/etc/alertmanager/alertmanager.yml -
Add new email address(es) to email_configs section.
Example: /etc/alertmanager/alertmanager.yml fileglobal:resolve_timeout: 5mroute:group_by: ['alertname']group_wait: 10sgroup_interval: 10srepeat_interval: 1hreceiver:'web.hook'receivers:- name:'web.hook'email_configs:- to: foo@gmail.com,bar@gmail.comfrom: prometheus@gmail.comsmarthost: smtp.gmail.com:587auth_username: foo@gmail.comauth_identity: foo@gmail.comauth_password: xxxxxsend_resolved:truewebhook_configs:- url:'http://127.0.0.1:5001/'inhibit_rules:- source_match:severity:'critical'target_match:severity:'warning'equal: ['alertname','dev','instance']Only TLS connections to the SMTP server are supported. For details, please refer to https://www.prometheus.io/docs/alerting/latest/configuration/#email_config.
To receive email alerts on multiple email ids, the to field in the example above can contain email addresses separated by commas.
Optionally, after editing the alertmanager.yml file, it is recommended that you validate the config file for any syntax or other errors by before starting or restarting the alertmanager service.
Validate config file$ amtool --alertmanager.url=http://localhost/alertmanagercheck-config \/etc/alertmanager/alertmanager.yml -
Restart the alertmanager service after updating the alertmanager.yml file.
$ supervisorctl restart alertmanager -
Repeat the steps above in this section on the Cluster Leader's HSA.
-
Test if the new email configurations is working.
Example$ amtool --alertmanager.url=http://localhost/alertmanageralert add Testing123-
After updating the email settings from SevOne NMS user interface, the alertmanager service must be restarted for the email settings to take effect.
-
If you are editing alertmanager.yml manually, make sure it is owned by user/group prometheus.
-
Silence Alert for some Duration
During Maintenance Windows or Upgrade Process, alerts must either disabled or silenced for some time. This can be achieved via the graphical user interface.
Silence Alert with User Interface
To silence alert with user interface, open the alertmanager user interface from your browser.
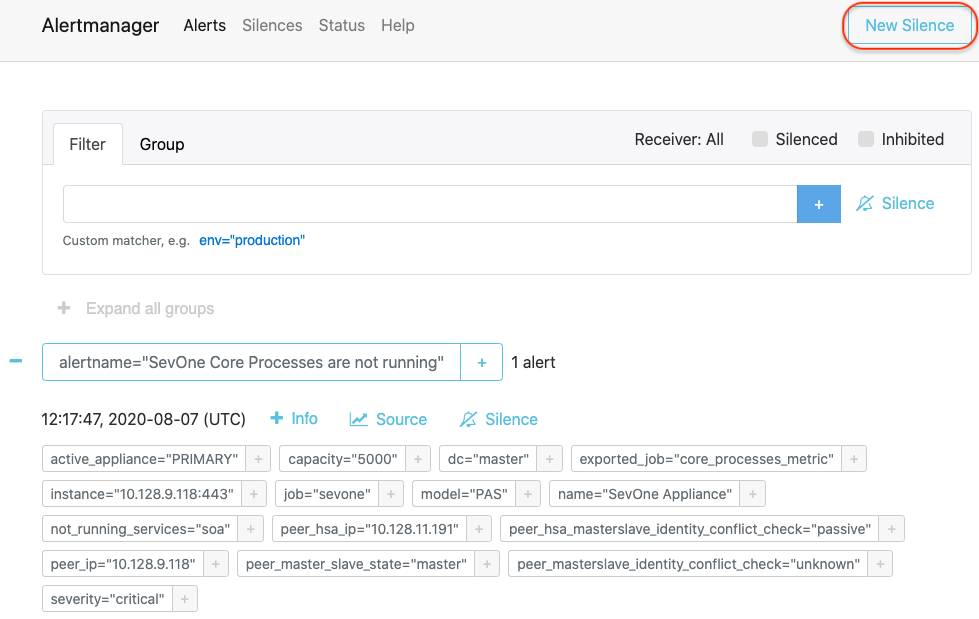
-
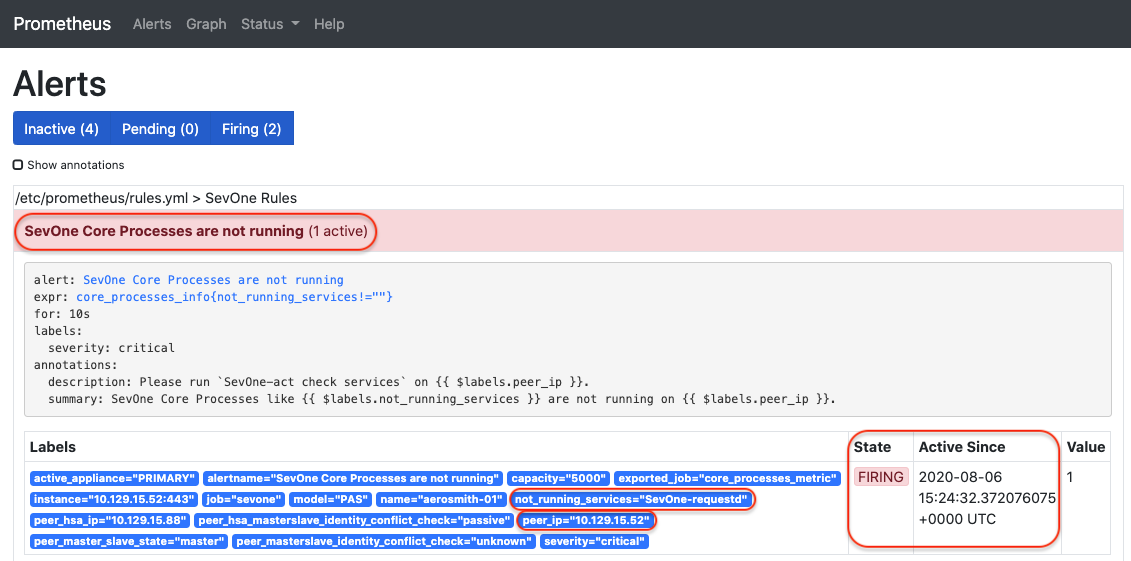
Click New Silence button in the upper-right corner to open the New Silence page for alertname="SevOne Core Processes are not running" alert.
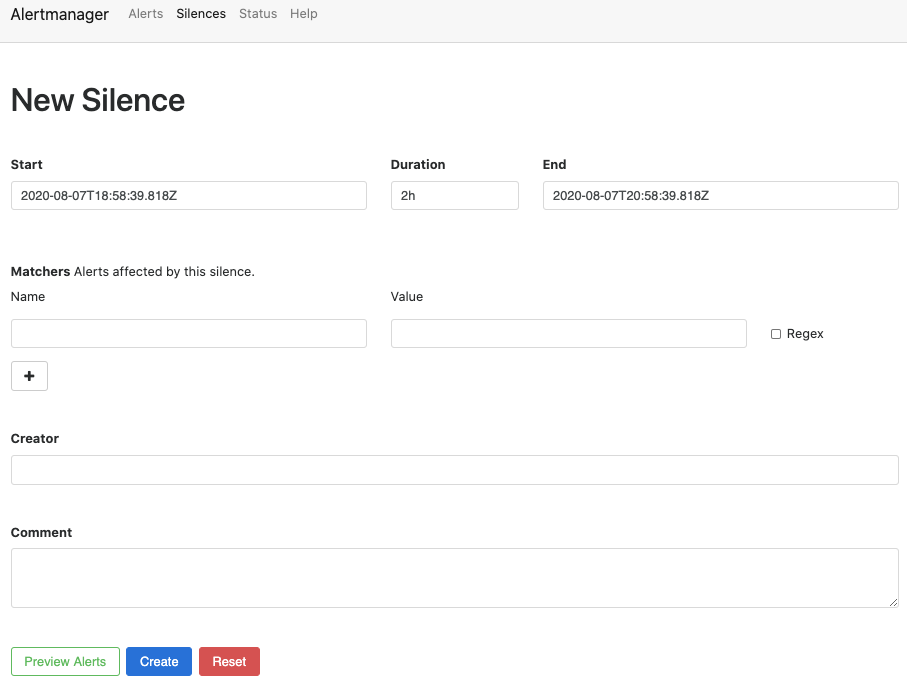
-
Based on the example above, alertname="SevOne Core Processes are not running" is an alert and it contains various alert labels such as, active_appliance="PRIMARY", capacity="5000", ..., job="sevone", etc.
An alert can contain multiple labels and a label can be a part of more than one alert.
-
In the Name field, enter the label name of the alert you want to silence. For example, job.
-
In the Value field, enter the value for the label name selected in the Name field. For example, sevone.
-
In the Creator field, enter the name of the person who is silencing the alert.
-
In the Comment field, enter the reason for silencing the alert. For example, Maintenance Windows, Upgrade Process, etc.
-
In the Duration field, enter the period (in hours) you want to silence this alert.
Example: Silence alert 'SevOne Take Over Action' generated by SevOne NMS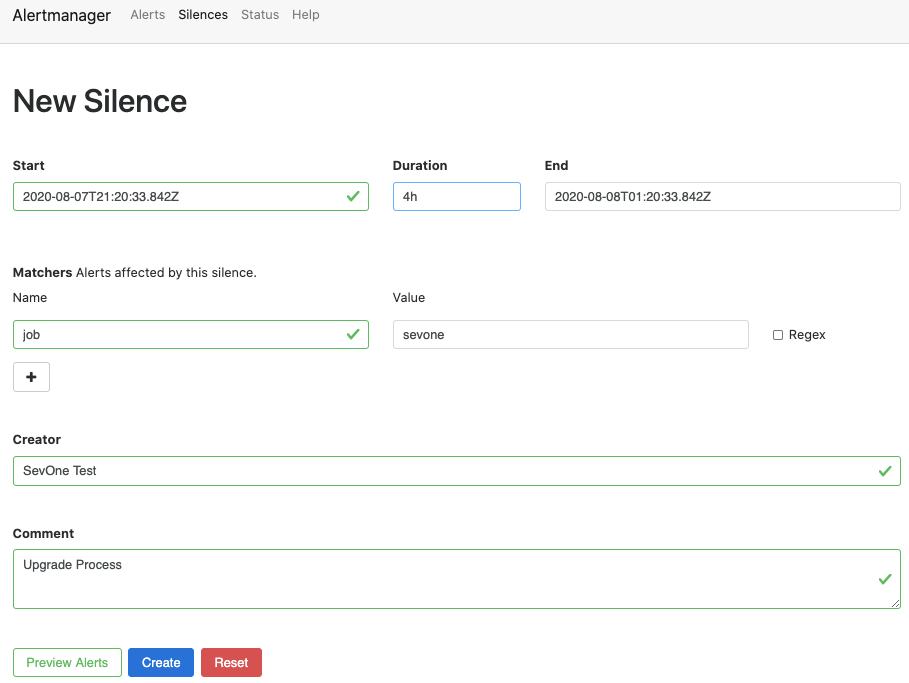
-
Click Create button to create the rule to silence the alert. Preview Alerts button shows the alerts that match your configuration. Click Preview Alerts button to confirm the alerts which will be affected by the silence configuration.
-
Alert Manager High Availability Configuration
High Availability Prometheus Alerting & Notification
To gracefully handle any machine that is failing, two Prometheus servers and two Alert Managers are running - one on the Cluster Leader and the other on its HSA.
# my global configglobal: scrape_interval: 1m # Set the scrape interval to every 15 seconds. Default is every 1 minute. evaluation_interval: 15s # Evaluate rules every 15 seconds. The default is every 1 minute. # scrape_timeout is set to the global default (10s). external_labels: dc: master1 # Note that this is only going to be different only by the trailing number on CM's HSA# Alertmanager configurationalerting: alert_relabel_configs: - source_labels: [dc] regex: (.+)\d+ target_label: dc alertmanagers: - static_configs: scheme: http file_sd_configs: - files: - 'alertmanager_peers.json' refresh_interval: 1m-
Both Cluster Leader and Cluster Leader's HSA Prometheus servers talk to both Alert Managers. In addition to this, the two Prometheus servers have slightly different external labels so that their data does not conflict.
-
Alert relabelling ensures a High Availability pair of Prometheus servers with different external labels send identical labelled alerts, which the Alert Manager automatically deduplicate. Alert relabelling is applied after external labels.
-
High Availability Prometheus Alerting & Notification ensures that if the Cluster Leader's Prometheus Alert Manager fails, no alerts will be missed as Prometheus and Alert Manager are running on HSA as well. And, in normal case, this will also ensure to deduplicate alerts.
Change Scrape Interval
In /etc/prometheus/prometheus.yml file, section scrape_configs specifies a set of targets and parameters describing how to scrape them.
-
scrape_interval defines the prometheus scrape metrics from monitored targets at regular intervals. The default value is 1m. The scrape_interval can be configured globally and then, overridden per job.
In this example, prometheus is configured to scrape metrics every 1 minute.
# my global configglobal: scrape_interval: 1m # Set the scrape interval to every 15 seconds. Default is every 1 minute. evaluation_interval: 15s # Evaluate rules every 15 seconds. The default is every 1 minute. # scrape_timeout is set to the global default (10s). external_labels: dc: master1Troubleshooting
Verify Correct Metrics are exposed on a Peer
To verify if the correct metrics are exposed on a peer, connect to the peer's nginx proxy endpoints for each exposed metric.
$ curl -k -X GET https://localhost:443/metrics/ingestion-resolved# HELP exposer_transferred_bytes_total Transferred bytes to metrics services# TYPE exposer_transferred_bytes_total counterexposer_transferred_bytes_total 1398319.000000# HELP exposer_scrapes_total Number of times metrics were scraped# TYPE exposer_scrapes_total counterexposer_scrapes_total 3675.000000# HELP exposer_request_latencies Latencies of serving scrape requests, in microseconds# TYPE exposer_request_latencies summaryexposer_request_latencies_count 3675exposer_request_latencies_sum 1830967.000000exposer_request_latencies{quantile="0.500000"} 387.000000exposer_request_latencies{quantile="0.900000"} 406.000000exposer_request_latencies{quantile="0.990000"} 406.000000# HELP incoming_data_points Number of data points ingestion pipeline is receiving# TYPE incoming_data_points gaugeincoming_data_points{Process="SevOne-ingestion-resolved",State="Overload"} 0.000000incoming_data_points{Process="SevOne-ingestion-resolved",Count="Total",Granularity="30min"} 0.000000This can be done for all supported metric endpoints.
$ curl -k -X GET https://localhost:443/metrics/push$ curl -k -X GET https://localhost:443/metrics/node$ curl -k -X GET https://localhost:443/metrics/datad$ curl -k -X GET https://localhost:443/metrics/ingestion-resolvedYou can also navigate to the URLs from your web browser. Each peer must export these metrics. DNCs normally do not have SevOne-datad and SevOne-ingestion-resolved running on them so these endpoints will fail.
Verify Metrics Endpoints
Each metric endpoint is served by nginx via a proxy configuration in /etc/nginx/proxy.d/20_prometheus.conf file.
location ~ ^/metrics/push { proxy_intercept_errors on; set $upstream http://127.0.0.1:9091/metrics; proxy_pass $upstream; proxy_http_version 1.1; proxy_set_header Upgrade $http_upgrade; proxy_set_header Connection "upgrade"; include /etc/nginx/proxy_settings.conf; proxy_read_timeout 18000;}location ~ ^/metrics/node { proxy_intercept_errors on; set $upstream http://127.0.0.1:9100/metrics; proxy_pass $upstream; proxy_http_version 1.1; proxy_set_header Upgrade $http_upgrade; proxy_set_header Connection "upgrade"; include /etc/nginx/proxy_settings.conf; proxy_read_timeout 18000;}location ~ ^/metrics/datad { proxy_intercept_errors on; set $upstream http://127.0.0.1:60123/metrics; proxy_pass $upstream; proxy_http_version 1.1; proxy_set_header Upgrade $http_upgrade; proxy_set_header Connection "upgrade"; include /etc/nginx/proxy_settings.conf; proxy_read_timeout 18000;}location ~ ^/metrics/ingestion-resolved { proxy_intercept_errors on; set $upstream http://127.0.0.1:6666/metrics; proxy_pass $upstream; proxy_http_version 1.1; proxy_set_header Upgrade $http_upgrade; proxy_set_header Connection "upgrade"; include /etc/nginx/proxy_settings.conf; proxy_read_timeout 18000;}Each proxy endpoint redirects to local-only ports as follows.
|
Pushgateway |
127.0.0.1:9091 |
|
Node Exporter |
127.0.0.1:9100 |
|
SevOne-datad |
127.0.0.1:60123 |
|
SevOne-ingestion-resolved |
127.0.0.1:6666 |
If the nginx proxy is not working, try to reach the local port of the peer. You will need to SSH into that peer since the port is not exposed.
$ ssh root@peer1$ curl -X GET http://127.0.0.1:60123/metrics# HELP exposer_transferred_bytes_total Transferred bytes to metrics services# TYPE exposer_transferred_bytes_total counterexposer_transferred_bytes_total 1275032.000000# HELP exposer_scrapes_total Number of times metrics were scraped# TYPE exposer_scrapes_total counterexposer_scrapes_total 3774.000000# HELP exposer_request_latencies Latencies of serving scrape requests, in microseconds# TYPE exposer_request_latencies summaryexposer_request_latencies_count 3774exposer_request_latencies_sum 1748553.000000exposer_request_latencies{quantile="0.500000"} 574.000000exposer_request_latencies{quantile="0.900000"} 589.000000exposer_request_latencies{quantile="0.990000"} 589.000000# HELP db_insertions_total The number of insertion queries to save data points# TYPE db_insertions_total counterdb_insertions_total 0.000000# HELP db_failed_insertions_total The number of failed insertion queries to save data points# TYPE db_failed_insertions_total counterdb_failed_insertions_total 0.000000If the local port is reachable but the nginx endpoint is not, then something is wrong with the proxy configuration and must be debugged. If the local port is not reachable as well, then something is wrong with the actual daemon (SevOne-datad, in this case).
Prometheus & Alertmanager Fail to Start
Prometheus and Alertmanager daemons will only run on the Cluster Leader and its HSA. These daemons will not run on any other peer. The scripts responsible for running them are:
-
/usr/local/scripts/prometheus/utilities/wrap-prometheus.sh
-
/usr/local/scripts/prometheus/utilities/wrap-alertmanager.sh
If you are unable to start the daemons, look at the log files in /var/log/prometheus/ for any obvious reason why the daemons are failing to start.
One important consideration is that the service discovery files /etc/prometheus/prometheus_peers.json and /etc/prometheus/alertmanager_peers.json need to be owned by the user prometheus. If not, you will see permission denied issues in the logs.
Running the wrapper scripts manually under root while debugging them, is not recommended. This will change the ownership of the service discovery files to root and the services will not to start due to permission denied errors. You must delete the service discovery files /etc/prometheus/*.json or change their ownership to the prometheus user after you are done debugging.
Alerts
You may use amtool that is bundled with the alertmanager installation. For additional details, please see https://github.com/prometheus/alertmanager#amtool.
Prometheus Service is Down
If prometheus service is down on both the Cluster Leader and its HSA,
-
You will not be able to access the prometheus user interface from both the Cluster Leader and its HSA.
-
You will not receive any new alerts.
If prometheus service is down on either the Cluster Leader or its HSA,
-
You will not be able to access the prometheus user interface on the machine where the prometheus service is down.
-
You will receive all alerts.
Alertmanager Service is Down
If alertmanager service is down on both the Cluster Leader and its HSA,
-
You will not be able to access the alertmanager user interface from both the Cluster Leader and its HSA.
-
You will not receive any new alert emails.
-
You will receive new alerts from prometheus user interface.
If alertmanager service is down on either the Cluster Leader or its HSA,
-
You will not be able to access the alertmanager user interface on the machine where the alertmanager service is down.
-
You will receive new alert emails.
If alertmanager service is down on both the Cluster Leader and its HSA and when it is back up, you do not get flooded with the alerts that occurred during its downtime. You will only receive the new alert emails after the alertmanager service is up.
References / Related Documents
|
Document |
URL |
|
Alertmanager Configuration |
https://www.prometheus.io/docs/alerting/latest/alertmanager/ |
|
Alertmanager Installation (amtool) |
https://github.com/prometheus/alertmanager#amtool |
|
Node Exporter |
https://github.com/prometheus/node_exporter |
|
Prometheus Configuration |
https://prometheus.io/docs/prometheus/latest/configuration/configuration/ |
|
Pushgateway |
https://prometheus.io/docs/practices/pushing/ |
|
Set up Webhook Notification |
https://prometheus.io/docs/alerting/latest/configuration/#webhook_config |
|
Service Alertmanager |
|
|
Service Prometheus |
https://www.prometheus.io/docs/introduction/overview/ |
|
TLS connections to SMTP server |
https://www.prometheus.io/docs/alerting/latest/configuration/#email_config |