Table of Contents (Start)
- Topics
- Introducing SevOne
- Login
- Startup Wizard
- Dashboard
- Global Search - Advanced Search
- Report Manager
- Report Attachment Wizard
- Report Properties
- Report Interactions
- Instant Graphs
- TopN Reports
- Alerts
- Alert Archives
- Alert Summary
- Instant Status
- Status Map Manager
- Edit Maps
- View Maps
- FlowFalcon Reports
- NBAR Reports
- Logged Traps
- Unknown Traps
- Trap Event Editor
- Trap Destinations
- Trap Destination Associations
- Policy Browser
- Create and Edit Policies
- Webhook Definition Manager
- Threshold Browser
- Create and Edit Thresholds
- Probe Manager
- Discovery Manager
- Device Manager
- New Device
- Edit Device
- Object Manager
- High Frequency Poller
- Device Summary
- Device Mover
- Device Groups
- Object Groups
- Object Summary
- Object Rules
- VMware Browser
- AWS Plugin
- Azure Plugin (Public Preview)
- Calculation Plugin
- Database Manager
- Deferred Data Plugin
- DNS Plugin
- HTTP Plugin
- ICMP Plugin
- IP SLA Plugin
- JMX Plugin
- NAM
- NBAR Plugin
- Portshaker Plugin
- Process Plugin
- Proxy Ping Plugin
- SDWAN Plugin
- SNMP Plugin
- VMware Plugin
- Web Status Plugin
- WMI Plugin
- xStats Plugin
- Indicator Type Maps
- Device Types
- Object Types
- Object Subtype Manager
- Calculation Editor
- xStats Source Manager
- User Role Manager
- User Manager
- Session Manager
- Authentication Settings
- Preferences
- Cluster Manager
- Maintenance Windows
- Processes and Logs
- Metadata Schema
- Baseline Manager
- FlowFalcon View Editor
- Map Flow Objects
- FlowFalcon Views
- Flow Rules
- Flow Interface Manager
- MPLS Flow Mapping
- Network Segment Manager
- Flow Protocols and Services
- xStats Log Viewer
- SNMP Walk
- SNMP OID Browser
- MIB Manager
- Work Hours
- Administrative Messages
- Enable Flow Technologies
- Enable JMX
- Enable NBAR
- Enable SNMP
- Enable Web Status
- Enable WMI
- IP SLA
- SNMP
- SevOne Data Publisher
- Quality of Service
- Perl Regular Expressions
- Trap Revisions
- Integrate SevOne NMS With Other Applications
- Email Tips and Tricks
- SevOne NMS PHP Statistics
- SevOne NMS Usage Statistics
- Glossary and Concepts
- Map Flow Devices
- Trap v3 Receiver
- Guides
- Quick Start Guides
- AWS Quick Start Guide
- Azure Quick Start Guide (Public Preview)
- Data Miner Quick Start Guide
- Flow Quick Start Guide
- Group Aggregated Indicators Quick Start Guide
- IP SLA Quick Start Guide
- JMX Quick Start Guide
- Metadata Quick Start Guide
- RESTful API Quick Start Guide
- Self-monitoring Quick Start Guide
- SevOne NMS Admin Notifications Quick Start Guide
- SNMP Quick Start Guide
- Synthetic Indicator Types Quick Start Guide
- Topology Quick Start Guide
- VMware Quick Start Guide
- Web Status Quick Start Guide
- WMI Quick Start Guide
- xStats Quick Start Guide
- xStats Adapter - Accedian Vision EMS (TM) Quick Start Guide
- Deployment Guides
- Automated Build / Rebuild (Customer) Instructions
- Generate a Self-Signed Certificate or a Certificate Signing Request
- SevOne Best Practices Guide - Cluster, Peer, and HSA
- SevOne Data Platform Security Guide
- SevOne NMS Implementation Guide
- SevOne NMS Installation Guide - Virtual Appliance
- SevOne NMS Advanced Network Configuration Guide
- SevOne NMS Installation Guide
- SevOne NMS Port Number Requirements Guide
- SevOne NMS Upgrade Process Guide
- SevOne Physical Appliance Pre-Build BIOS and RAID Configuration Guide
- SevOne SAML Single Sign-On Setup Guide
- Cloud Platforms
- Other Guides
- Quick Start Guides
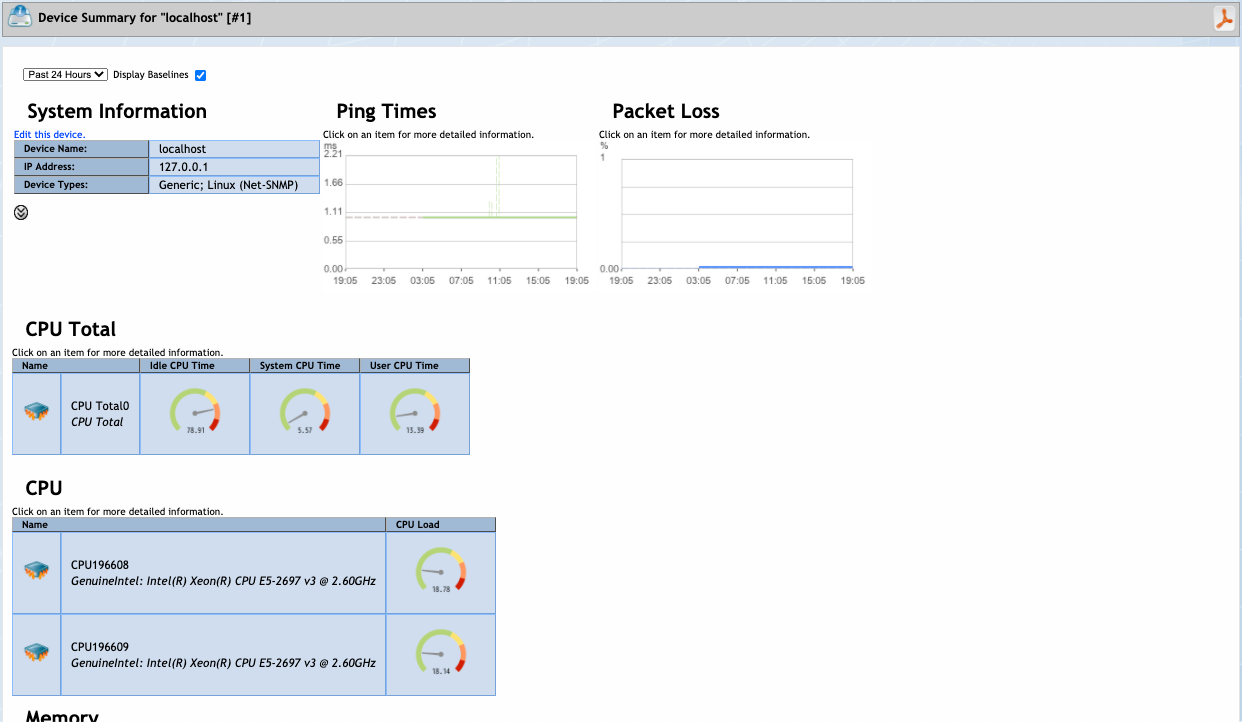
Device Summary
The Device Summary displays summary information about a device.
You can access the Device Summary from the following workflows: Advanced Search, Alert Archives, Alert Summary, Alerts, Device Manager, Edit Device, High Frequency Poller, Instant Graphs, Instant Status, Object Groups, Object Manager, Probe Manager, Status Map Viewer, TopN Reports, Topology Reports, VMware Browser, xStats Source Manager.
The following controls appear on the Device Summary.
-
Click the Past 24 Hours drop-down and select a time span to display data for a different time span.
-
Select the Display Baselines check box to display baseline data in graphs when baseline data is available.
-
 - Click to export the Device Summary data to a .pdf format.
 -
Move the cursor over graphs, related devices, and associated objects.
-
Click on a graph to add the graph as an attachment in a report on a new browser tab. You can modify reports to get more details. You can add other attachments to a report and you can save reports to the Report Manager. Report workflows enable you to designate reports to be your favorite reports and to define one report to appear as your custom dashboard.
-
Click on an object to display the Object Summary for that object.
-
System Information
The System Information section displays the following information.
Click the Edit This Device link to display the Edit Device page.
 - Click to display additional device system information.
-
Device Name - Displays the device name.
-
IP Address - Displays the device IP address.
-
Device Types - Displays the device types for which the device has membership.
-
Alternate Name - Displays the device alternate name.
-
Description - Displays the device description.
-
Last Discovery Attempt - Displays the date and time of the last device discovery attempt.
-
Discovery Status - Displays Queued if the device is in a queue for discovery or displays n/a when the device is not in a queue for discovery.
Plugin Specific Device Statistics
The Device Summary displays the data that each enabled plugin polls from the device.
ICMP Data
When you enable the ICMP plugin for the device, a Ping Times graph and a Packet Loss graph appear. Network computers use ICMP to send error messages that indicate when a requested service is not available or when a host or router could not be reached.
-
Ping Time - Displays the round-trip latency to this device from the peer. The three lines are the minimum, average, and maximum times along with the associated baselines for each.
-
Packet Loss - Displays the packet loss percentage.
VMware Data
When you enable the VMware plugin for the device, the following workflows appear in the VMware Status section.
If you view the VMware status for a device that is a virtual machine (VMware VM Status), click the Host Status link to display the Device Summary for the virtual machine's host device. If you view the VMware status for a device that is a host device (VMware Host Status), click the vCenter Status link to display the Device Summary for the host's vCenter device.
The following VMware indicators appear in graphs, charts, and reports, when available.
-
Object Icon - Provides access to the Object Summary.
-
CPU Total
-
CPU Percentage
-
CPU Ready but Unscheduled Percentage
-
Memory Used
-
Memory Swapped
-
Memory Ballooned
-
Disk I/O rate
-
Data Storage Usage
SNMP Data
When you enable the SNMP plugin for the device, the following SNMP data appears, when available.
-
CPU Total - Displays the following CPU total data.
-
Name - Displays the CPU name and provides access to the Object Summary.
-
Idle CPU Time
-
Kernel CPU Time
-
Nice CPU Time
-
System CPU Time
-
User CPU Time
-
Waiting CPU Time
-
-
CPU - Displays the following information for each CPU.
-
Name - Displays the CPU name and provides access to the Object Summary.
-
CPU Load
-
-
Memory - Displays the following memory information.
-
Name - Displays the memory name and provides access to the Object Summary.
-
Description
-
Available Real Memory
-
Available Swap Memory
-
Total Free Memory
-
Total Used Memory
-
-
Disks - Displays the following disk information.
-
Name - Displays the disk name and a link to the Object Summary.
-
Description
-
Available Disk Space
-
Used Disk Space
-
Storage Used
-
Used Storage Indicators
-
Hard Drive Storage Used
-
-
Interfaces - Displays the following information for each interface on the device.
-
Interface Name - Displays the interface name and provides access to the Object Summary.
-
Utilization (In Out)
-
Process Data
When you enable the Process plugin for the device, the following process data appears, when available.
-
Process Name - Displays the process name and a link to the Object Summary.
-
Description - Displays the process description.
-
Availability - Displays a process availability graph.
-
Instances - Displays the number of instances running.
-
Memory - Displays the amount of memory the process uses.
-
CPU - Displays the percentage of the CPU the process uses.
MySQL Database Data
When you enable the Databases plugin for the device, the following MySQL database data appears, when available.
-
Database Name - Displays the database name and provides access to the Object Summary.
-
Description - Displays the database description.
-
Availability - Displays a database availability graph.
-
Traffic (in and out) - Displays a traffic in and out graph.
Alert Data
The Current Alerts section displays the following alert data when the device has active alert messages. You manage alerts on the Alerts page and you define the thresholds to trigger alerts on the Threshold Browser.
-
ID - Displays the internal identifier.
-
Device - Displays the device name.
-
First - Displays the first time the alert was reported.
-
Last - Displays the last time the alert was modified.
-
Severity - Displays the alert severity level.
-
Message - Displays the alert message.
Plugins
The Plugins section displays whether the plugin is enabled or disabled for the device. Enabled plugins are currently configured for the device, even if the device does not support the plugin. You enable and disable plugins on the Edit Device page.
Polling
The Polling section displays the following poll information for the device. You manage device polling on the Device Manager.
-
Polled By - Displays the name of the peer that polls the device.
-
Poll Frequency - Displays how often the device is polled.
-
Pending Deletion - Displays Yes when the device is scheduled for deletion or displays No when the device is not scheduled for deletion.