Table of Contents (Start)
- Topics
- Introducing SevOne
- Login
- Startup Wizard
- Dashboard
- Global Search - Advanced Search
- Report Manager
- Report Attachment Wizard
- Report Properties
- Report Interactions
- Instant Graphs
- TopN Reports
- Alerts
- Alert Archives
- Alert Summary
- Instant Status
- Status Map Manager
- Edit Maps
- View Maps
- FlowFalcon Reports
- NBAR Reports
- Logged Traps
- Unknown Traps
- Trap Event Editor
- Trap Destinations
- Trap Destination Associations
- Policy Browser
- Create and Edit Policies
- Webhook Definition Manager
- Threshold Browser
- Create and Edit Thresholds
- Probe Manager
- Discovery Manager
- Device Manager
- New Device
- Edit Device
- Object Manager
- High Frequency Poller
- Device Summary
- Device Mover
- Device Groups
- Object Groups
- Object Summary
- Object Rules
- VMware Browser
- AWS Plugin
- Azure Plugin (Public Preview)
- Calculation Plugin
- Database Manager
- Deferred Data Plugin
- DNS Plugin
- HTTP Plugin
- ICMP Plugin
- IP SLA Plugin
- JMX Plugin
- NAM
- NBAR Plugin
- Portshaker Plugin
- Process Plugin
- Proxy Ping Plugin
- SDWAN Plugin
- SNMP Plugin
- VMware Plugin
- Web Status Plugin
- WMI Plugin
- xStats Plugin
- Indicator Type Maps
- Device Types
- Object Types
- Object Subtype Manager
- Calculation Editor
- xStats Source Manager
- User Role Manager
- User Manager
- Session Manager
- Authentication Settings
- Preferences
- Cluster Manager
- Maintenance Windows
- Processes and Logs
- Metadata Schema
- Baseline Manager
- FlowFalcon View Editor
- Map Flow Objects
- FlowFalcon Views
- Flow Rules
- Flow Interface Manager
- MPLS Flow Mapping
- Network Segment Manager
- Flow Protocols and Services
- xStats Log Viewer
- SNMP Walk
- SNMP OID Browser
- MIB Manager
- Work Hours
- Administrative Messages
- Enable Flow Technologies
- Enable JMX
- Enable NBAR
- Enable SNMP
- Enable Web Status
- Enable WMI
- IP SLA
- SNMP
- SevOne Data Publisher
- Quality of Service
- Perl Regular Expressions
- Trap Revisions
- Integrate SevOne NMS With Other Applications
- Email Tips and Tricks
- SevOne NMS PHP Statistics
- SevOne NMS Usage Statistics
- Glossary and Concepts
- Map Flow Devices
- Trap v3 Receiver
- Guides
- Quick Start Guides
- AWS Quick Start Guide
- Azure Quick Start Guide (Public Preview)
- Data Miner Quick Start Guide
- Flow Quick Start Guide
- Group Aggregated Indicators Quick Start Guide
- IP SLA Quick Start Guide
- JMX Quick Start Guide
- Metadata Quick Start Guide
- RESTful API Quick Start Guide
- Self-monitoring Quick Start Guide
- SevOne NMS Admin Notifications Quick Start Guide
- SNMP Quick Start Guide
- Synthetic Indicator Types Quick Start Guide
- Topology Quick Start Guide
- VMware Quick Start Guide
- Web Status Quick Start Guide
- WMI Quick Start Guide
- xStats Quick Start Guide
- xStats Adapter - Accedian Vision EMS (TM) Quick Start Guide
- Deployment Guides
- Automated Build / Rebuild (Customer) Instructions
- Generate a Self-Signed Certificate or a Certificate Signing Request
- SevOne Best Practices Guide - Cluster, Peer, and HSA
- SevOne Data Platform Security Guide
- SevOne NMS Implementation Guide
- SevOne NMS Installation Guide - Virtual Appliance
- SevOne NMS Advanced Network Configuration Guide
- SevOne NMS Installation Guide
- SevOne NMS Port Number Requirements Guide
- SevOne NMS Upgrade Process Guide
- SevOne Physical Appliance Pre-Build BIOS and RAID Configuration Guide
- SevOne SAML Single Sign-On Setup Guide
- Cloud Platforms
- Other Guides
- Quick Start Guides
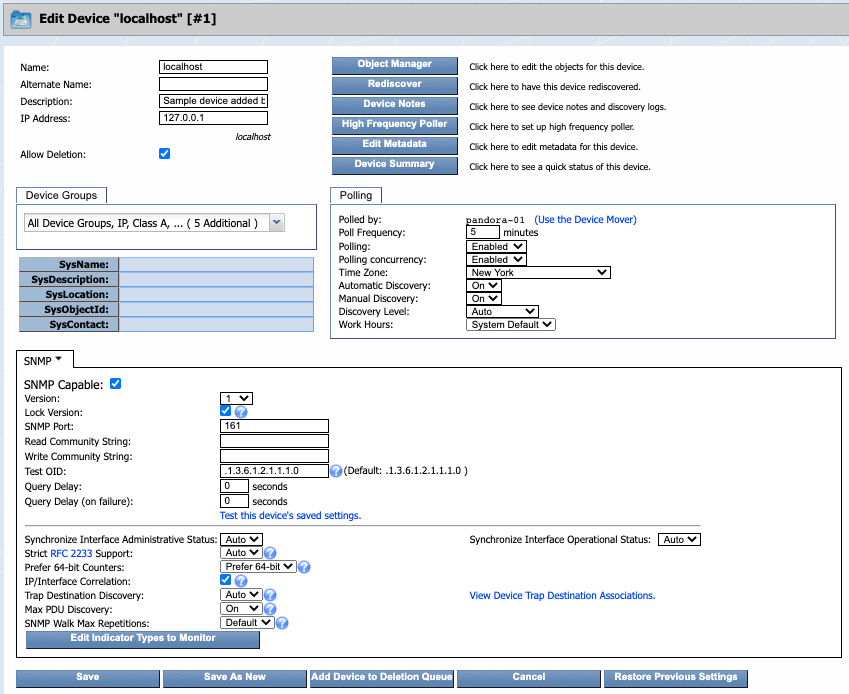
Edit Device
The Edit Device page enables you to edit a device, to edit the objects associated with a device, to manage device discovery, to add device notes, to set up high frequency polling, to manage metadata attribute values, to view the Device Summary, and use the Device Mover to move devices between peers.
To access the Edit Device page from the navigation bar, click the Devices menu and select Device Manager to display the Device Manager. On the Device Manager, click  next to the device to edit.
Device Name and IP Address
The top section enables you to define the device name and IP address information.
-
In the Name field, enter the device name. This can be either a Fully Qualified Domain Name (FQDN) or any unique name. If the name is a valid FQDN that can be resolved via DNS, the Cluster Manager > Cluster Settings tab provides a Resolve Device Names check box that enables you to have SevOne NMS update the IP address to the correct IP address upon discovery.
-
In the Alternate Name field, enter an alternate device name. Users can search for a device by its alternate name.
-
In the Description field, enter a device description to provide additional information.
-
In the IP Address field, enter the device IP address. If you enter a DNS resolvable FQDN in the Name field, settings on the Cluster Manager > Cluster Settings tab enable SevOne NMS to update the IP address you enter here to the device's actual IP address at the next discovery.
-
Select the Allow Deletion check box to enable users to delete the device. This check box appears for the admin user only. If you clear this check box, users cannot delete the device.
Object Manager
The Object Manager button provides access to the Object Manager. The Object Manager enables you to fine tune the objects discovery finds on the device and to enable or disable the objects plugins poll on the device.
Click Object Manager to display the Object Manager.
Rediscover
The Rediscover button enables you to queue the device for high priority discovery. The high priority discovery sequence is to discover the most recently queued high priority devices first followed by other high priority queue devices in a last in first out sequence. The low priority discovery sequence discovers the device that has been in the queue the longest in a first in first out sequence.
Click Rediscover to queue the device for high priority discovery. This is useful when you upgrade a device with new hardware and you want the change to be visible immediately. Devices also queue for high priority discovery when you click Save.
Device Notes
The Device Notes button provides access to the Device Notes tab on the Discovery Manager. Device notes are the messages discovery and polling generate for the device. These notes help you troubleshoot plugin configuration issues. You can also enter notes.
Click Device Notes to display the Discovery Manager.
High Frequency Poller
The High Frequency Poller button provides access to the High Frequency Poller. The High Frequency Poller enables you to poll objects on a device faster than once per minute. This helps you detect momentary spikes in network traffic that last less than a few seconds.
Click High Frequency Poller to display the High Frequency Poller.
Edit Metadata
The Edit Metadata button provides access to the Edit Metadata pop-up that enables you to edit the values for the metadata attributes you want to associate with the device. The SNMP plugin discovers metadata attributes such as sysContact, sysDescription, sysLocation, sysName, and sysObject ID which are useful for device group rules and device type rules (for details, please refer to section Device Types in SevOne NMS System Administration Guide.
The Metadata Schema page enables you to manage metadata attributes. For details on this, please refer to section Metadata Schema in SevOne NMS System Administration Guide.
-
Click
 in the Actions column to display the Edit Metadata pop-up.
 -
Click
 to make the Values field editable.
 -
In the Values field, enter the value for the attribute with the applicable attribute type specific format.
-
Date/Time: Must have a valid date and time format and can use natural language processing such as; 3 Thursdays ago at 5pm.
-
Integer: Type: Value must be numeric.
-
IP Address: Must use one of the following formats:
-
IPv4: for example, 10.1.1.100 or 172.16.254.1
-
IPv6: supports Zero Suppression format. For example, 2001:db8::1234::567:8:1 or 2601::0800:200c:417a
-
-
Latitude and Longitude: Must have valid coordinates that are decimal values: -90.00 to 90.00 values for Latitude and -180.00 to 180.00 for Longitude
-
MAC Address: Must use the following format: 0A:00:27:00:00:00
-
Text (Validated): Supports up to 1024 UTF-16 characters including PCRE regex that uses preg-match (perform a regular expression match) to validate the regular expression you enter against the attribute definition from the Metadata Schema page.
-
Text: Supports up to 65K UTF-16 varchar characters.
-
URL: Complete the following fields:
-
Link Display Text: Enter the text to display in reports as the link caption.
-
URL: Enter the URL. Must have FQDN validation, supports username prefix, ports, protocol AND ?/& for HTTP GET variables, and optional additional PCRE regex for validation, and must be fewer than 255 characters.
-
-
-
Click Update to save the value.
Device Summary
The Device Summary button displays a link to the Device Summary and links to the report templates that are applicable for the device. The Device Summary displays the status of the selected device.
Click Device Summary and select Device Summary to display the Device Summary or select a report template to display the report for the device.
Device Groups
The Device Groups section enables you to pin the device to the device groups you define on the Device Groups page and the device types you define on the Device Types page. Device groups enable you to restrict user access to devices and device types enable you to group devices for SNMP polling purposes. Device groups/device types enable you to filter the lists of devices for report and alert purposes. Auto-grouping rules enable you to automatically add devices to device groups/device types that meet the membership rule criteria upon next discovery.
You can use the following fields to create device group rules and device type rules. The SNMP plugin populates these fields upon device discovery when the SNMP plugin is enabled for the device.
-
sysName - The text you get when you SNMP walk the sysName OID. For details, please refer to section SNMP Walk in SevOne NMS System Administration Guide.
-
sysDescription - The text you get when you SNMP walk the sysDescr OID.
-
sysLocation - The text you get when you SNMP walk the sysLocation OID.
-
sysObjectID - The text you get when you SNMP walk the sysObjectID OID.
-
sysContact - The text you get when you SNMP walk the sysContact OID.
To manually pin devices to device groups/device types, click the Device Group drop-down and select the check box for each device group/device type to which to pin the device.
Polling
The Polling section enables you to select the peer to poll the device, and to define the poll frequency.
-
The Polled By field displays the peer you define to poll the device. When you have a multi-peer cluster, click the Use the Device Mover link to display the Device Mover where you can move the device to have a different peer poll the device.
-
In the Poll Frequency field, enter how often to poll the device. You can set poll frequency down to 1 minute. To poll more frequently than every 1 minute, see the High Frequency Polling section. You can negatively affect SevOne NMS performance when you turn on high frequency polling for an excessive number of objects. Please consult with your SevOne Support Engineer if you plan to use high frequency polling for a large number objects.
-
Click the Polling drop-down and select to either Enable or Disable polling.
-
Click the Polling Concurrency drop-down.
-
Select Enabled to enable multiple threads to simultaneously poll the device when the device takes longer to poll than the poll frequency you set. For most devices you want this set to Enabled to get regular poll intervals at the frequency you set.
-
Select Disabled to allot only one thread to poll the device.
-
-
Click the Time Zone drop-down and select the time zone in which the device is located. This enables you to accurately display and calculate work hours, reports, and alerts schedules.
-
Click the Automatic Discovery drop-down and select On to discover the device each time the automatic discovery process runs. You schedule automatic discovery on the Cluster Manager > Peer Settings tab. Select Off to not discover the device when the automatic discovery process runs.
-
Click the Manual Discovery drop-down and select On to enable manual discovery. Manual discovery occurs when you click Save on the Edit Device page and from all other manual discovery workflows. Select Off to not discover the device when you click Save on the Edit Device page and to block manual discovery of the devices. Select Off when a device is in maintenance.
-
Click the Discovery Level drop-down and select the level of notes to store for the device. Select Auto to set the discovery level to the value you set on the Cluster Manager > Cluster Settings tab.
-
Click the Work Hours drop-down and select a work hours group. You define work hour groups on the Work Hours page.
Plugins
The lower section displays SNMP in the tab header. This section provides the controls you use to enable the plugins to monitor the technologies on the device. Plugins are mechanisms that poll (collect, ask for, etc.) data from technologies. Plugins define a way to get data, usually via some protocol such as SNMP, ICMP, WMI, etc. Many plugins are automatically enabled when you add a device to SevOne NMS so you can poll applicable objects with minimal configuration. The exceptions are; JMX, NAM, VMware, and WMI which require device specific input.
Objects are discrete components of a device or a software component that have one or more performance indicators on which plugins can monitor, trend, and alert. An object is any performance element. Indicators are grouped by indicator types which in turn are grouped by object types.
-
Object Types - Define logical things to ask for information about.
-
Indicator Types - Define kinds of metrics that object types can have.
This section provides the controls you use to enable the plugins to monitor the technologies on the device. See the plugin specific chapters for details.
Discovery is triggered when you disable a plugin via the controls on the page. If you disable a plugin via the SOAP API you must manually re-discover the device.
-
AWS - To collect devices, metadata, and metrics from the AWS environment right out-of-the-box. The plugin makes use of AWS CloudWatch metric streams for overtime data as well as for API calls for metadata enrichment. The AWS plugin allows you to monitor multiple different AWS accounts and regions.
-
Azure - To collect devices, metadata and metrics from the Azure Public Cloud environment. The Azure plugin makes use of Azure Data Plane API for metric collection and allows you to monitor multiple different subscriptions and regions.
-
Calculation - To monitor the calculation objects you define on the Calculation Editor, enable the Calculation plugin for the device. Calculation objects are composed of variables that represent the calculations of data polled from multiple indicators.
-
Databases - To poll MySQL database statistics and/or to poll Oracle database statistics, enable the Databases plugin for the device.
-
Deferred Data - To use API scripts to import third party data from the device, enable the Deferred Data plugin for the device.
-
DNS - To poll the availability and response times of DNS requests for certain domain names, enable the DNS plugin for the device.
-
HTTP - To poll Web site data, enable the HTTP plugin for the device and if your cluster includes HTTP proxy servers, define the default HTTP proxy server for each peer on the Cluster Manager > Peer Settings tab. To monitor via https, upload certificates on the Authentication Settings page.
-
ICMP - To poll basic response time data, enable the ICMP plugin for the device and define cluster wide ICMP settings on the Cluster Manager > Cluster Settings tab.
-
IP SLA - To poll Cisco IP SLA data, enable the IP SLA plugin for the device, configure device specific IP SLAs on the Probe Manager, and configure cluster wide IP SLA settings on the Cluster Manager > Cluster Settings tab.
-
JMX - To poll JMX data, enable the device to send JMX data to SevOne NMS, enable the JMX plugin for the device, and enable the JMX object types to monitor on the Object Types page.
-
NAM - To poll Cisco NAM data, enable NAM for the device. NAM data appears in FlowFalcon Reports.
-
NBAR - To poll NBAR data, enable the device to send NBAR data to SevOne NMS, enable the SNMP plugin for the device, and enable the NBAR plugin for the device.
-
Portshaker - To poll TCP port response time, enable the Portshaker plugin for the device.
-
Process - To poll performance data for specific processes, enable the SNMP plugin for the device, enable the Process plugin for the device, and add the processes to monitor on the Object Subtype Manager.
-
Proxy Ping - To poll the latency of a link, enable the Proxy Ping plugin for the device.
-
SDWAN - To create integrations with supported SDWAN vendors.
-
SNMP - To poll basic performance metrics and QoS data, enable the device to send SNMP data to SevOne NMS, enable the SNMP plugin for the device, configure cluster wide SNMP settings on the Cluster Manager > Cluster Settings tab, and disable the SNMP object types to not monitor on the Object Types page. For details, please refer to section SNMP in SevOne NMS System Administration Guide.
-
VMware - To poll vCenters, ESX/ESXi data through your vSphere, enable the VMware plugin for the device.
-
Web Status - To poll Web server data, enable devices to send Web Status data to SevOne NMS and enable the Web Status plugin for the device. To monitor via https, upload certificates on the Authentication Settings page.
-
WMI - To poll WMI data, enable the device to send WMI data to SevOne NMS, enable the WMI plugin for the device, and enable the WMI object types to monitor on the Object Types page.
-
xStats - xStats is unique. Define your xStats sources on the xStats Source Manager. Data the source collects automatically creates devices in SevOne NMS and also creates applicable xStats object types.
After you enable plugins, click one of the following buttons to save your edits. When you click Save or Save as New, the discovery process starts for the device.
-
Click Save to save the device settings.
-
Click Save as New to add the changes as a new device.
-
Click Add Device to Deletion Queue to add the device to the queue for deletion. The devices in the deletion queue will be deleted after the number of days set in Administration > Cluster Manager > Cluster Settings tab > Devices subtab > section Device Deletion Queue Information, field Days to delay.
If Days to delay field is set to 0 days, then the device(s) in the deletion queue are marked for immediate deletion. This is to preserve the pre-existing behavior and allow the feature to be turned off.