Table of Contents (Start)
- Topics
- Introducing SevOne
- Login
- Startup Wizard
- Dashboard
- Global Search - Advanced Search
- Report Manager
- Report Attachment Wizard
- Report Properties
- Report Interactions
- Instant Graphs
- TopN Reports
- Alerts
- Alert Archives
- Alert Summary
- Instant Status
- Status Map Manager
- Edit Maps
- View Maps
- FlowFalcon Reports
- NBAR Reports
- Logged Traps
- Unknown Traps
- Trap Event Editor
- Trap Destinations
- Trap Destination Associations
- Policy Browser
- Create and Edit Policies
- Webhook Definition Manager
- Threshold Browser
- Create and Edit Thresholds
- Probe Manager
- Discovery Manager
- Device Manager
- New Device
- Edit Device
- Object Manager
- High Frequency Poller
- Device Summary
- Device Mover
- Device Groups
- Object Groups
- Object Summary
- Object Rules
- VMware Browser
- AWS Plugin
- Azure Plugin (Public Preview)
- Calculation Plugin
- Database Manager
- Deferred Data Plugin
- DNS Plugin
- HTTP Plugin
- ICMP Plugin
- IP SLA Plugin
- JMX Plugin
- NAM
- NBAR Plugin
- Portshaker Plugin
- Process Plugin
- Proxy Ping Plugin
- SDWAN Plugin
- SNMP Plugin
- VMware Plugin
- Web Status Plugin
- WMI Plugin
- xStats Plugin
- Indicator Type Maps
- Device Types
- Object Types
- Object Subtype Manager
- Calculation Editor
- xStats Source Manager
- User Role Manager
- User Manager
- Session Manager
- Authentication Settings
- Preferences
- Cluster Manager
- Maintenance Windows
- Processes and Logs
- Metadata Schema
- Baseline Manager
- FlowFalcon View Editor
- Map Flow Objects
- FlowFalcon Views
- Flow Rules
- Flow Interface Manager
- MPLS Flow Mapping
- Network Segment Manager
- Flow Protocols and Services
- xStats Log Viewer
- SNMP Walk
- SNMP OID Browser
- MIB Manager
- Work Hours
- Administrative Messages
- Enable Flow Technologies
- Enable JMX
- Enable NBAR
- Enable SNMP
- Enable Web Status
- Enable WMI
- IP SLA
- SNMP
- SevOne Data Publisher
- Quality of Service
- Perl Regular Expressions
- Trap Revisions
- Integrate SevOne NMS With Other Applications
- Email Tips and Tricks
- SevOne NMS PHP Statistics
- SevOne NMS Usage Statistics
- Glossary and Concepts
- Map Flow Devices
- Trap v3 Receiver
- Guides
- Quick Start Guides
- AWS Quick Start Guide
- Azure Quick Start Guide (Public Preview)
- Data Miner Quick Start Guide
- Flow Quick Start Guide
- Group Aggregated Indicators Quick Start Guide
- IP SLA Quick Start Guide
- JMX Quick Start Guide
- Metadata Quick Start Guide
- RESTful API Quick Start Guide
- Self-monitoring Quick Start Guide
- SevOne NMS Admin Notifications Quick Start Guide
- SNMP Quick Start Guide
- Synthetic Indicator Types Quick Start Guide
- Topology Quick Start Guide
- VMware Quick Start Guide
- Web Status Quick Start Guide
- WMI Quick Start Guide
- xStats Quick Start Guide
- xStats Adapter - Accedian Vision EMS (TM) Quick Start Guide
- Deployment Guides
- Automated Build / Rebuild (Customer) Instructions
- Generate a Self-Signed Certificate or a Certificate Signing Request
- SevOne Best Practices Guide - Cluster, Peer, and HSA
- SevOne Data Platform Security Guide
- SevOne NMS Implementation Guide
- SevOne NMS Installation Guide - Virtual Appliance
- SevOne NMS Advanced Network Configuration Guide
- SevOne NMS Installation Guide
- SevOne NMS Port Number Requirements Guide
- SevOne NMS Upgrade Process Guide
- SevOne Physical Appliance Pre-Build BIOS and RAID Configuration Guide
- SevOne SAML Single Sign-On Setup Guide
- Cloud Platforms
- Other Guides
- Quick Start Guides
Global Search - Advanced Search
The Advanced Search page enables you to define granular search parameters to find and act upon specific information.
To access the Advanced Search page from the navigation bar, click in the Search field, then either click the Advanced Search link or enter at least three characters and click the Show All menu option.
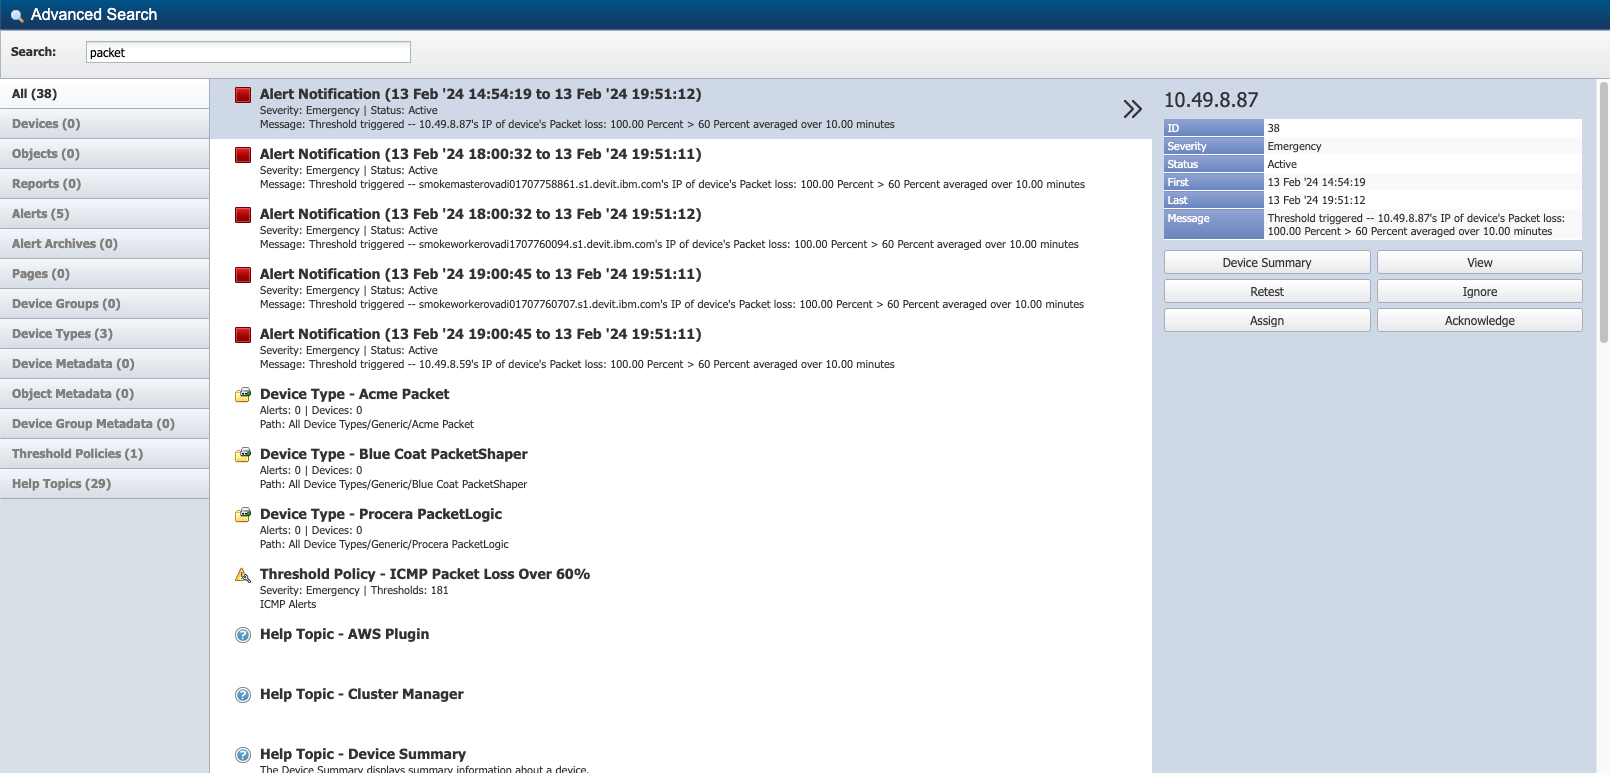
Search Results
The top section provides a Search field. This Search field initially displays the string you enter in the Search field on the navigation bar. Enter a new string or additional characters to further define the results. This field requires only one letter to begin the search. Wildcards are implied but when you explicitly enter a wildcard, it is treated as part of the search string.
Tabs appear on the left. When you click Show All to display the Advanced Search page, the All tab appears selected to display all results in the list. Click on a tab to display results that are specific for Devices, Objects, Reports, Alerts, Alert Archives, Pages, Device Groups, Device Types, Device Metadata, Object Metadata, Device Group Metadata, Thresholds Policies, or Help Topics.
The list displays rows of results that meet your filter criteria, ranked by an internal relevance score. The details and controls for the first result in the list appear on the right. Click on a result row to display row specific details and applicable controls. The information that appears on the right is dependent on the result type you select.
Devices
Each device result row displays the device name, alternate name, IP address, and description. Click on a device row to display the following information and controls:
-
ID - Displays the internal device identifier.
-
Alt. Name - Displays the device alternate name.
-
IP Address - Displays the device IP address.
-
Objects - Displays the number of objects on the device that are polled for data.
-
Poller - Displays the peer that polls the device.
-
Edit - Click to navigate to the Edit Device page for the device.
-
Device Summary - Click to display a link to the Device Summary page and links to applicable report templates.
-
Ping - Click to display the Ping Results pop-up, which displays the packet count and the minimum, maximum, and average ping times. The pop-up enables you to ping the device again and to ping the device every 30 seconds.
-
Discover - Click to queue the device for discovery.
-
SNMP Walk - Click to navigate to the SNMP Walk page. Please refer to section SNMP Walk in SevOne NMS System Administration Guide for details.
Objects
Each object row displays the object name, description, and the name or IP address of the device that the object is polled on. Click on an object row to display the following information and controls:
-
Plugin - Displays the plugin that polls the object.
-
Object ID - Displays the internal object identifier.
-
Alt Name - Displays user-friendly alternate name for the object.
-
Description - Displays the object description.
-
Subtype - Displays the name of the object subtype.
-
Device - Displays the name of the device that the object is polled on. Click the link to display the Object Manager, filtered to display all objects for the device.
-
Object Summary - Click to display a link to the Object Summary page and links to applicable report templates.
Reports
Each report row displays the report name, description, and owner. Click on a report row to display the following information and controls:
-
Owner - Displays the name of the report owner.
-
Description - Displays the report description.
-
View - Click to view the report on a new browser tab.
-
Delete - Click to delete the report.
-
Favorite - Click to mark the report as one of your favorite reports.
-
Dashboard - Click to make the report your custom dashboard.
Alerts
Each alert row displays the alert severity color block, the date/time of the first trigger and the last modification, the severity level, status, message, and threshold name. Click on an alert row to display the following information and controls:
-
ID - Displays the internal alert identifier.
-
Severity - Displays the severity you assign to the alert.
-
Status - Displays the alert status.
-
First - Displays the date and time SevOne NMS first received the alert.
-
Last - Displays the date and time the alert was last modified.
-
Message - Displays the message generated by the threshold.
-
Device Summary - Click to display a link to the Device Summary for the device that triggered the alert and links to applicable report templates.
-
View - Click to navigate to the Alerts page filtered to the alert.
-
Retest - Click to see if the alert condition still exists. The alert engine runs every three minutes to retest all thresholds. If a threshold does not have a clear condition, the alert displays on the Alerts page until the alert is acknowledged. When you retest an alert that is triggered by a threshold with no clear condition, even if the trigger condition is no longer met, the alert continues to display on the Alerts page but the Last date and time does not change.
-
Ignore - Click to ignore the alert. A pop-up appears to enable you to define the time span to ignore the alert and to enter a comment. You can choose to not display the alerts you ignore on the Alerts page. No emails and traps are sent from ignored alerts for the duration you enter.
-
Assign - Click to assign the alert to a user. A pop-up appears to enable you to select the user to assign the alert to.
-
Acknowledge - Click to acknowledge the alert and move the alert to the Alert Archives. A pop-up appears to enable you to enter an acknowledgement message.
Alert Archives
Each alert archive row displays the alert severity color block, the date/time of the first trigger and the last modification, the severity level, status, message, and threshold name. Click on an alert archive row to display the following information and controls:
-
ID - Displays the internal alert identifier.
-
Severity - Displays the severity you assign to the alert.
-
Status - Displays the alert status.
-
First - Displays the date and time SevOne NMS first received the alert.
-
Last - Displays the date and time the alert was last modified.
-
Message - Displays the message generated by the threshold.
-
Device Summary - Click to display a link to the Device Summary for the device that triggered the alert and links to applicable report templates.
-
View - Click to navigate to the Alert Archives page filtered to the alert.
Pages
Each page row displays a very brief description of what the page enables you to accomplish and the path from the navigation bar to the page. Click on a page row to display the following information and controls:
-
Description - Displays a description of the page functionality.
-
Image - Displays an image of what the page could look like.
-
Go to Page - Click to navigate to the page.
Device Groups
Each device group row displays the number of alerts the device in the device group have triggered, the number of devices in the device group, and the location of the device group in the device group hierarchy. Click on a device group row to display the following information and controls:
-
ID - Displays the internal device group identifier.
-
Path - Displays the location of the device group within the device group hierarchy.
-
Manage - Click to navigate to the Device Groups page.
-
Threshold Policies - Click to navigate to the Policy Browser.
-
Alerts - Click to navigate to the Alerts page.
-
Devices - Click to navigate to the Device Manager to display all the devices.
Device Types
Each device type row displays the number of alerts the devices in the device type have triggered, the number of devices in the device type, and the location of the device type in the device type hierarchy. Click on a device type row to display the following information and controls:
-
ID - Displays the internal device type identifier.
-
Path - Displays the location of the device type within the device type hierarchy.
-
Manage - Click to navigate to the Device Types page. Please refer to section Device Types in SevOne NMS System Administration Guide for details.
-
Threshold Policies - Click to navigate to the Policy Browser.
-
Alerts - Click to navigate to the Alerts page.
-
Devices - Click to navigate to the Device Manager to display all the devices.
Device Metadata
Each device metadata row displays the device name, metadata attribute name, and metadata value. Click on a device metadata row to display the following information and controls:
-
ID - Displays the internal device identifier.
-
Alternate Name - Displays the device alternate name.
-
IP Address - Displays the device IP address.
-
Objects - Displays the number of objects on the device that are polled for data.
-
Poller - Displays the peer that polls the device.
-
Edit - Click to navigate to the Edit Device page for the device.
-
Device Summary - Click to display a link to the Device Summary page and links to applicable report templates.
-
Ping - Click to display the Ping Results pop-up, which displays the packet count and the minimum, maximum, and average ping times. The pop-up enables you to ping the device again and to ping the device every 30 seconds.
-
Discover - Click to queue the device for discovery.
-
SNMP Walk - Click to navigate to the SNMP Walk page. Please refer to section SNMP Walk in SevOne NMS System Administration Guide for details.
Object Metadata
Each object metadata row displays the object name, metadata attribute name, and metadata value. Click on an object metadata row to display the following information and controls:
-
Plugin - Displays the plugin that polls the object.
-
Object ID - Displays the internal object identifier.
-
Description - Displays the object description.
-
Subtype - Displays the name of the object subtype.
-
Device - Displays the name of the device that the object is polled on.
-
Object Summary - Click to display a link to the Object Summary page and links to applicable report templates.
Device Group Metadata
Each device group metadata row displays the device group name, metadata attribute name, and metadata value. Click on a device group metadata row to display the following information and controls:
-
ID - Displays the internal device identifier.
-
Alternate Name - Displays the device alternate name.
-
IP Address - Displays the device IP address.
-
Objects - Displays the number of objects on the device that are polled for data.
-
Poller - Displays the peer that polls the device.
-
Edit - Click to navigate to the Edit Device page for the device.
-
Device Summary - Click to display a link to the Device Summary page and links to applicable report templates.
-
Ping - Click to display the Ping Results pop-up, which displays the packet count and the minimum, maximum, and average ping times. The pop-up enables you to ping the device again and to ping the device every 30 seconds.
-
Discover - Click to queue the device for discovery.
-
SNMP Walk - Click to navigate to the SNMP Walk page. Please refer to section SNMP Walk in SevOne NMS System Administration Guide for details.
Threshold Policies
Each threshold policy row displays the threshold policy name, the severity of the alerts that the threshold triggers, the number of thresholds that have triggered, and the description. Click on a threshold policy row to display the following information and controls:
-
ID - Displays the internal threshold policy identifier.
-
Severity - Displays the severity you assign to the alerts that the threshold policy triggers.
-
Description - Displays the threshold policy description.
-
Edit - Click to navigate to the Policy Editor.
-
Alerts - Click to navigate to the Alerts page.
-
Thresholds - Click to navigate to the Threshold Browser.
-
Device Group - Click to navigate to the Device Groups page.
Help Topics
Each help topic row displays the help topic name and the first lines of text from the help topic. Click on a help topic row to display the following information and controls:
-
Description - Displays a summary of the help topic content.
-
Go to Help Topic - Click to display the help topic.