Table of Contents (Start)
- Topics
- Introducing SevOne
- Login
- Startup Wizard
- Dashboard
- Global Search - Advanced Search
- Report Manager
- Report Attachment Wizard
- Report Properties
- Report Interactions
- Instant Graphs
- TopN Reports
- Alerts
- Alert Archives
- Alert Summary
- Instant Status
- Status Map Manager
- Edit Maps
- View Maps
- FlowFalcon Reports
- NBAR Reports
- Logged Traps
- Unknown Traps
- Trap Event Editor
- Trap Destinations
- Trap Destination Associations
- Policy Browser
- Create and Edit Policies
- Webhook Definition Manager
- Threshold Browser
- Create and Edit Thresholds
- Probe Manager
- Discovery Manager
- Device Manager
- New Device
- Edit Device
- Object Manager
- High Frequency Poller
- Device Summary
- Device Mover
- Device Groups
- Object Groups
- Object Summary
- Object Rules
- VMware Browser
- AWS Plugin
- Azure Plugin (Public Preview)
- Calculation Plugin
- Database Manager
- Deferred Data Plugin
- DNS Plugin
- HTTP Plugin
- ICMP Plugin
- IP SLA Plugin
- JMX Plugin
- NAM
- NBAR Plugin
- Portshaker Plugin
- Process Plugin
- Proxy Ping Plugin
- SDWAN Plugin
- SNMP Plugin
- VMware Plugin
- Web Status Plugin
- WMI Plugin
- xStats Plugin
- Indicator Type Maps
- Device Types
- Object Types
- Object Subtype Manager
- Calculation Editor
- xStats Source Manager
- User Role Manager
- User Manager
- Session Manager
- Authentication Settings
- Preferences
- Cluster Manager
- Maintenance Windows
- Processes and Logs
- Metadata Schema
- Baseline Manager
- FlowFalcon View Editor
- Map Flow Objects
- FlowFalcon Views
- Flow Rules
- Flow Interface Manager
- MPLS Flow Mapping
- Network Segment Manager
- Flow Protocols and Services
- xStats Log Viewer
- SNMP Walk
- SNMP OID Browser
- MIB Manager
- Work Hours
- Administrative Messages
- Enable Flow Technologies
- Enable JMX
- Enable NBAR
- Enable SNMP
- Enable Web Status
- Enable WMI
- IP SLA
- SNMP
- SevOne Data Publisher
- Quality of Service
- Perl Regular Expressions
- Trap Revisions
- Integrate SevOne NMS With Other Applications
- Email Tips and Tricks
- SevOne NMS PHP Statistics
- SevOne NMS Usage Statistics
- Glossary and Concepts
- Map Flow Devices
- Trap v3 Receiver
- Guides
- Quick Start Guides
- AWS Quick Start Guide
- Azure Quick Start Guide (Public Preview)
- Data Miner Quick Start Guide
- Flow Quick Start Guide
- Group Aggregated Indicators Quick Start Guide
- IP SLA Quick Start Guide
- JMX Quick Start Guide
- Metadata Quick Start Guide
- RESTful API Quick Start Guide
- Self-monitoring Quick Start Guide
- SevOne NMS Admin Notifications Quick Start Guide
- SNMP Quick Start Guide
- Synthetic Indicator Types Quick Start Guide
- Topology Quick Start Guide
- VMware Quick Start Guide
- Web Status Quick Start Guide
- WMI Quick Start Guide
- xStats Quick Start Guide
- xStats Adapter - Accedian Vision EMS (TM) Quick Start Guide
- Deployment Guides
- Automated Build / Rebuild (Customer) Instructions
- Generate a Self-Signed Certificate or a Certificate Signing Request
- SevOne Best Practices Guide - Cluster, Peer, and HSA
- SevOne Data Platform Security Guide
- SevOne NMS Implementation Guide
- SevOne NMS Installation Guide - Virtual Appliance
- SevOne NMS Advanced Network Configuration Guide
- SevOne NMS Installation Guide
- SevOne NMS Port Number Requirements Guide
- SevOne NMS Upgrade Process Guide
- SevOne Physical Appliance Pre-Build BIOS and RAID Configuration Guide
- SevOne SAML Single Sign-On Setup Guide
- Cloud Platforms
- Other Guides
- Quick Start Guides
Synthetic Indicator Types Quick Start Guide
SevOne Documentation
All documentation is available from the IBM SevOne Support customer portal.
© Copyright International Business Machines Corporation 2024.
All right, title, and interest in and to the software and documentation are and shall remain the exclusive property of IBM and its respective licensors. No part of this document may be reproduced by any means nor modified, decompiled, disassembled, published or distributed, in whole or in part, or translated to any electronic medium or other means without the written consent of IBM.
IN NO EVENT SHALL IBM, ITS SUPPLIERS, NOR ITS LICENSORS BE LIABLE FOR ANY DAMAGES, WHETHER ARISING IN TORT, CONTRACT OR ANY OTHER LEGAL THEORY EVEN IF IBM HAS BEEN ADVISED OF THE POSSIBILITY OF SUCH DAMAGES, AND IBM DISCLAIMS ALL WARRANTIES, CONDITIONS OR OTHER TERMS, EXPRESS OR IMPLIED, STATUTORY OR OTHERWISE, ON SOFTWARE AND DOCUMENTATION FURNISHED HEREUNDER INCLUDING WITHOUT LIMITATION THE WARRANTIES OF DESIGN, MERCHANTABILITY OR FITNESS FOR A PARTICULAR PURPOSE, AND NONINFRINGEMENT.
IBM, the IBM logo, and SevOne are trademarks or registered trademarks of International Business Machines Corporation, in the United States and/or other countries. Other product and service names might be trademarks of IBM or other companies. A current list of IBM trademarks is available on ibm.com/trademark.
About
SevOne NMS plugins–such as SNMP – use indicator types to collect data from indicators on the objects that you monitor. There are two types of indicator types: atomic and synthetic. Atomic indicator types are measured directly by plugins. Synthetic indicator types, on the other hand, calculate values based on the values resulting from other indicator types.
SevOne NMS comes with some built-in synthetic indicator types. On the Object Types page, under Interface (SNMP Poller), for example, you'll find the synthetic indicator type s1_total_octets.
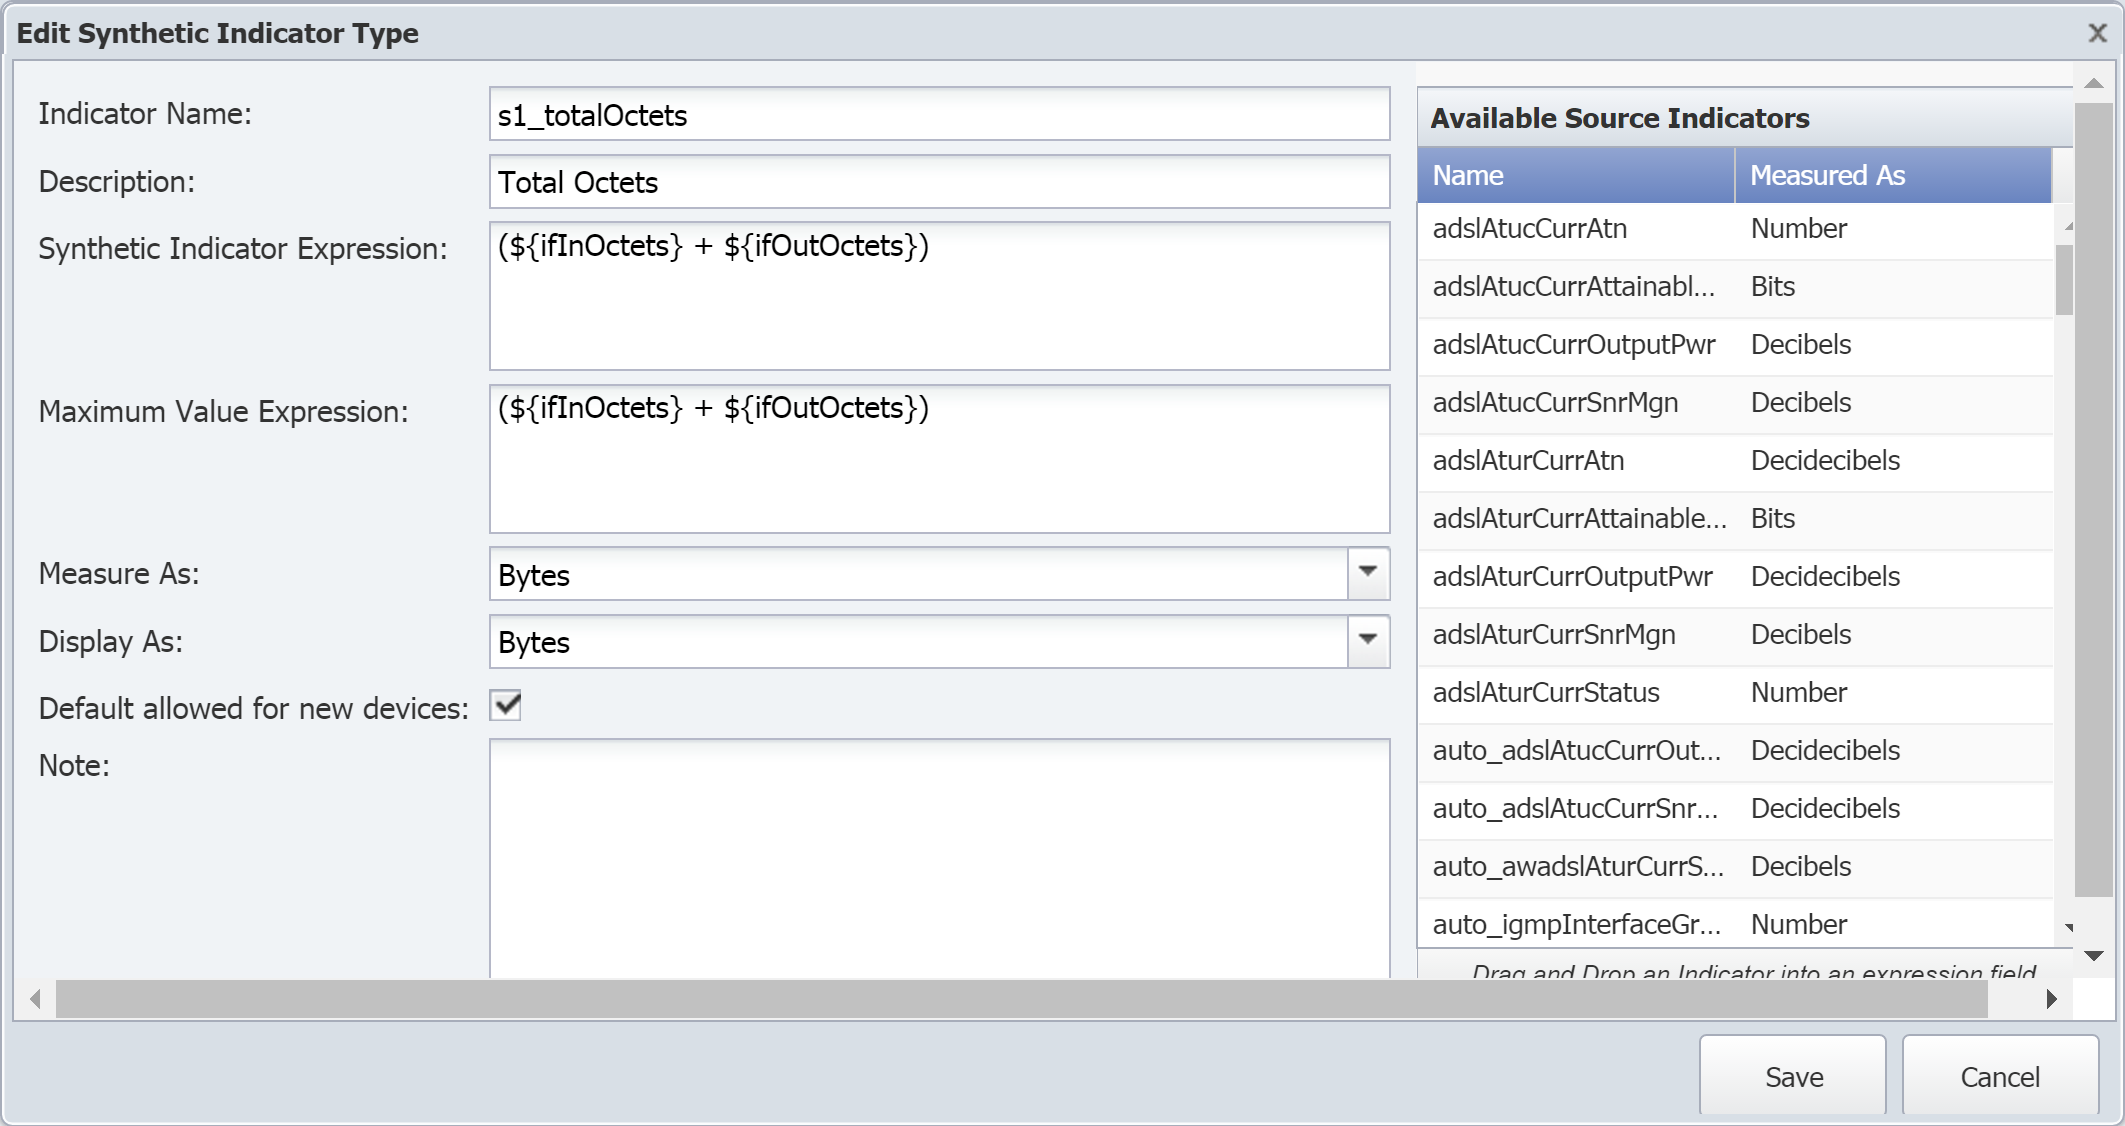
s1_total_octets provides the total number of octets based on an expression that adds the results of two existing indicator types, ifInOctets and ifOutOctets. Specifically, it adds the number of In Octets to the number of Out Octets to determine the total number of octets. In this case, our synthetic indicator type expression includes two atomic indicator types. The expression can also include other synthetic indicator types.
The total of synthetic indicators is computed differently from the total of atomic indicators on Performance Metrics graphs. Synthetic indicators are GAUGES, whose value, in the example of Interface Octets, is stored in rate form, so the total displayed in the graph will be a simple sum of rates, rather than a sum of the actual bandwidth. Toggling that setting will allow the rate to be summed over time (i.e., an integral over the rate) and will thus display the total bandwidth over time.
Atomic indicators are stored in raw format and are scalar quantities.
Synthetic indicators are vector quantities.
Using synthetic indicator types, you can create your own key performance indicators (KPIs) even when those KPIs–such as Percent Usage, Percent Loss, Percent Error, and Percent Idle–don't exist on a device. For example, let's say that you want to monitor voice gateways to find out which primary rate interface (PRI) is getting the most usage. Typical poll metrics can tell you the busy status of individual bearer channels, or B channels, but they can't tell you the sum of the statuses for all the B channels. This makes it difficult to find out the total usage of a particular PRI.
In SevOne NMS, you can create a single indicator type that tells you what percentage of a PRI is being used.
First, we need the following:
-
An existing indicator type that tells us how many busy B channels there are for a given PRI. Let's call this BChannelsBusy.
-
The total number of B channels for our PRI. That number is 23.
Using this information, we can create a synthetic indicator type with an expression to perform the following calculation:
(BChannelsBusy*23)/100
Now we have a new indicator type–a synthetic indicator type–that tells us what percentage of the PRI is being used. There's no need to look up the number of busy B channels and perform calculations manually.
Configuration Steps
Synthetic indicator types are created using existing indicator types, which can be either atomic or synthetic. This means that in order to create a new synthetic indicator type, there must already be at least one indicator type–either atomic or synthetic–to work with.
You can define synthetic indicator types for the following plugins:
-
Calculation
-
Deferred Data
-
JMX
-
SNMP
-
WMI
-
xStats
Perform the following steps to create (or edit) an SNMP synthetic indicator type.
-
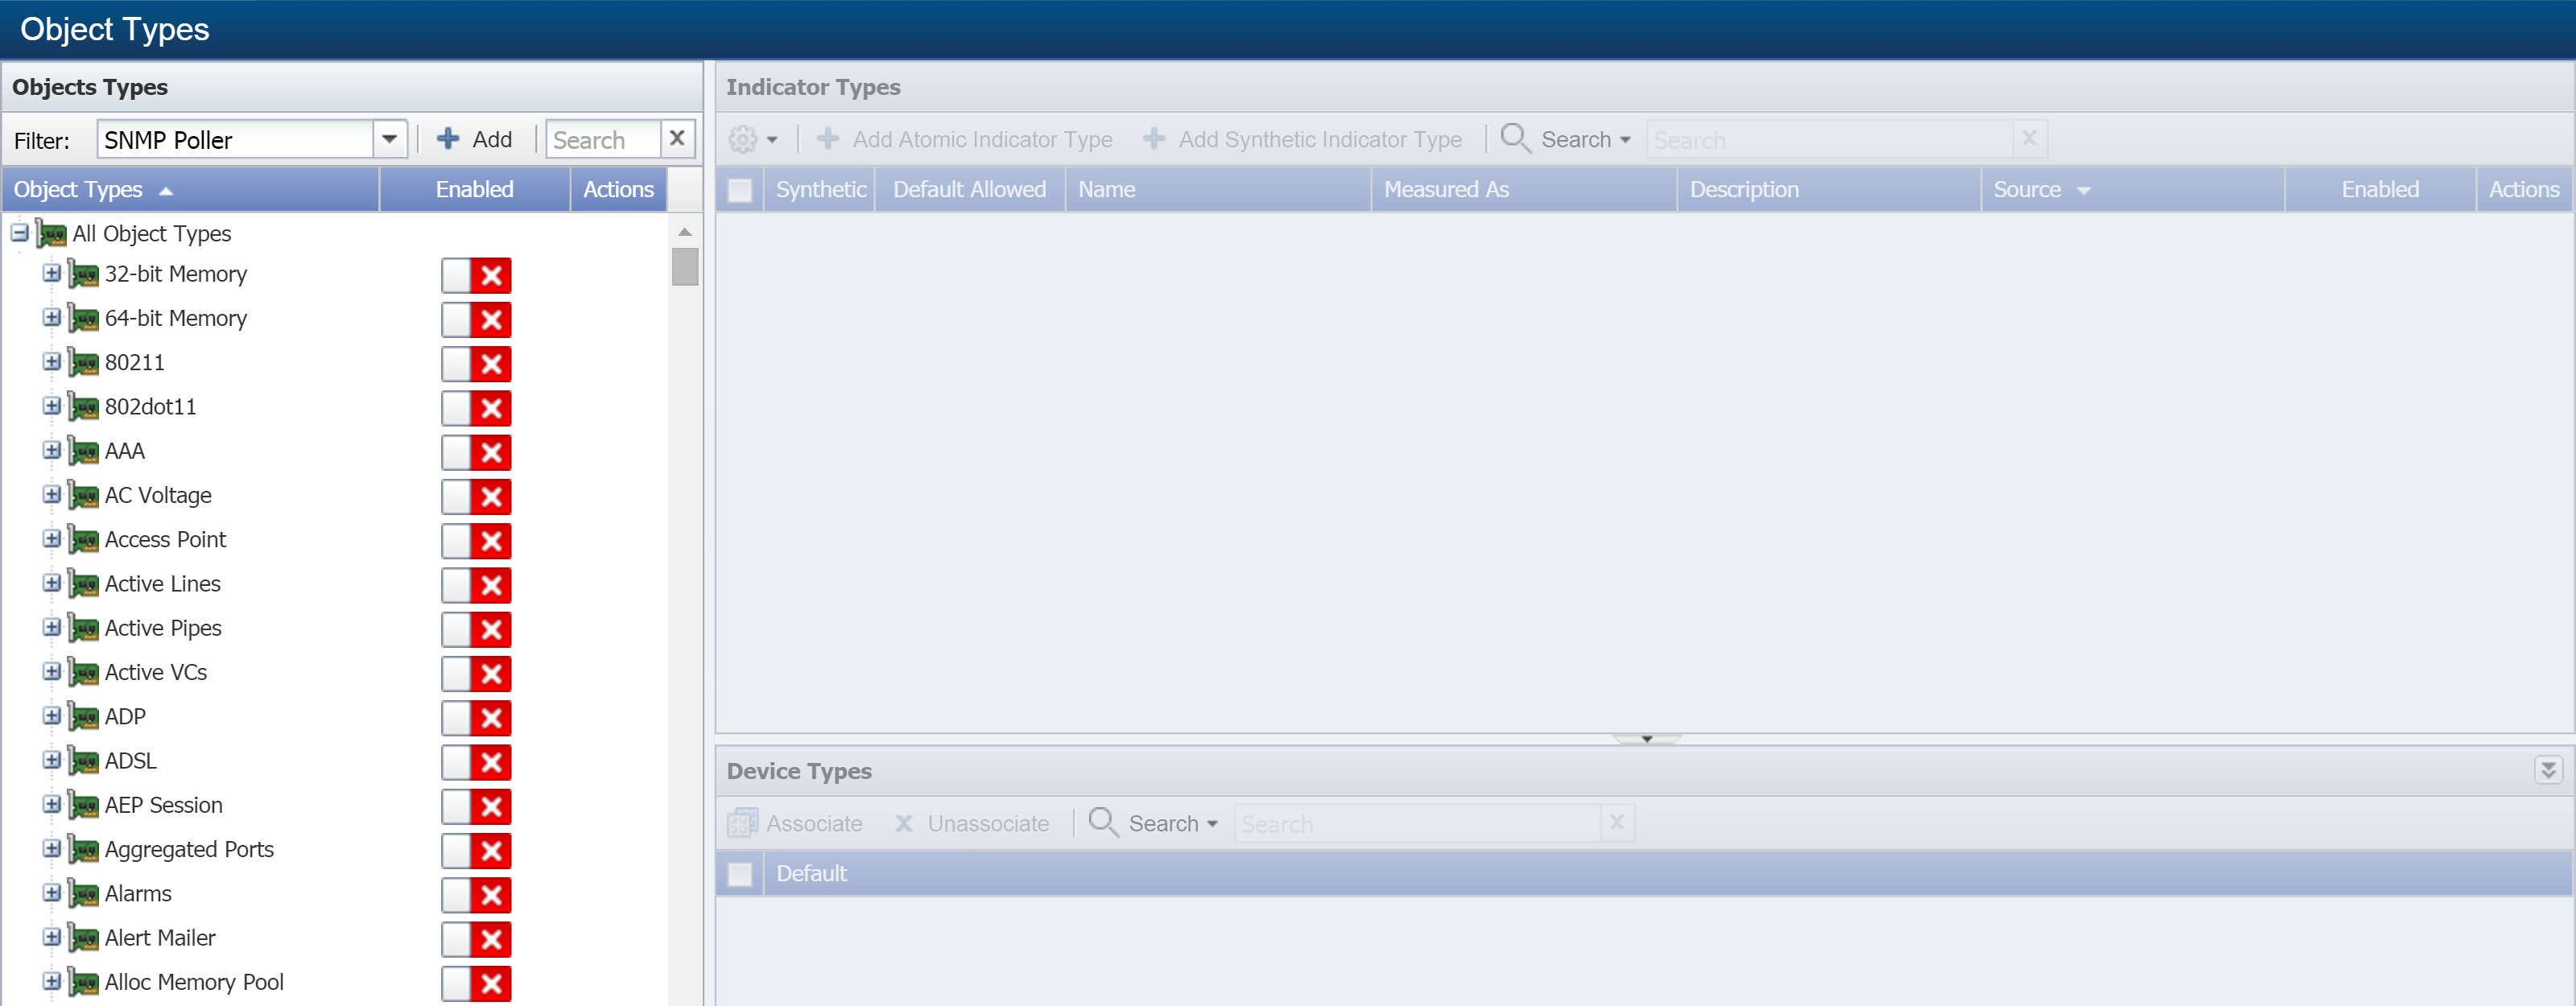
From the navigation bar, click Administration and select Monitoring Configuration, then Object Types.
-
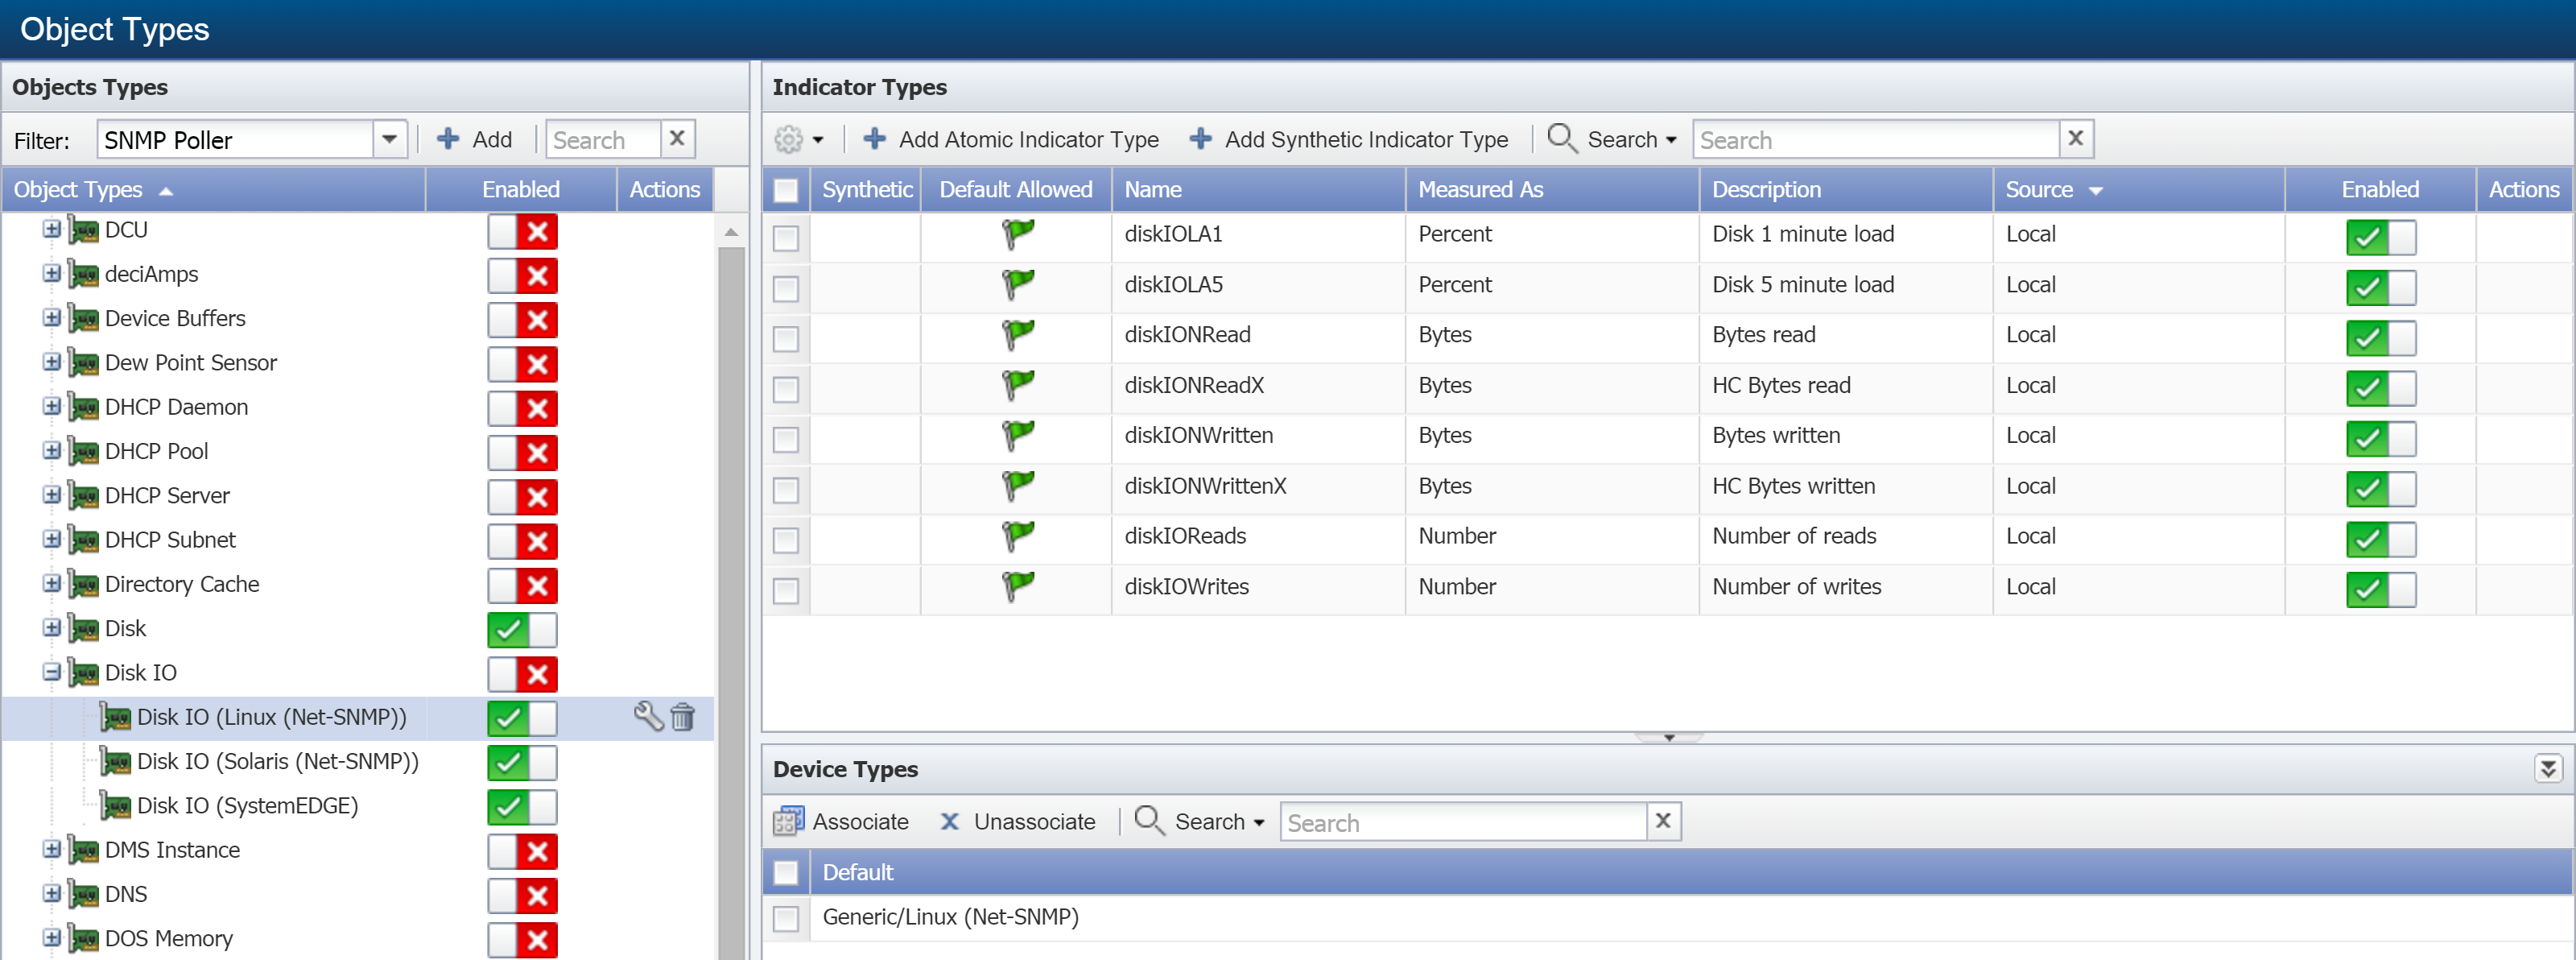
The Filter drop-down is set to SNMP Poller by default. In the Object Types hierarchy on the left, you'll see the object types that the SNMP plugin can poll.
-
Click on an object type to display its indicator types on the right. If the object type doesn't have any indicator types, the Add Synthetic Indicator Type button won't appear.
-
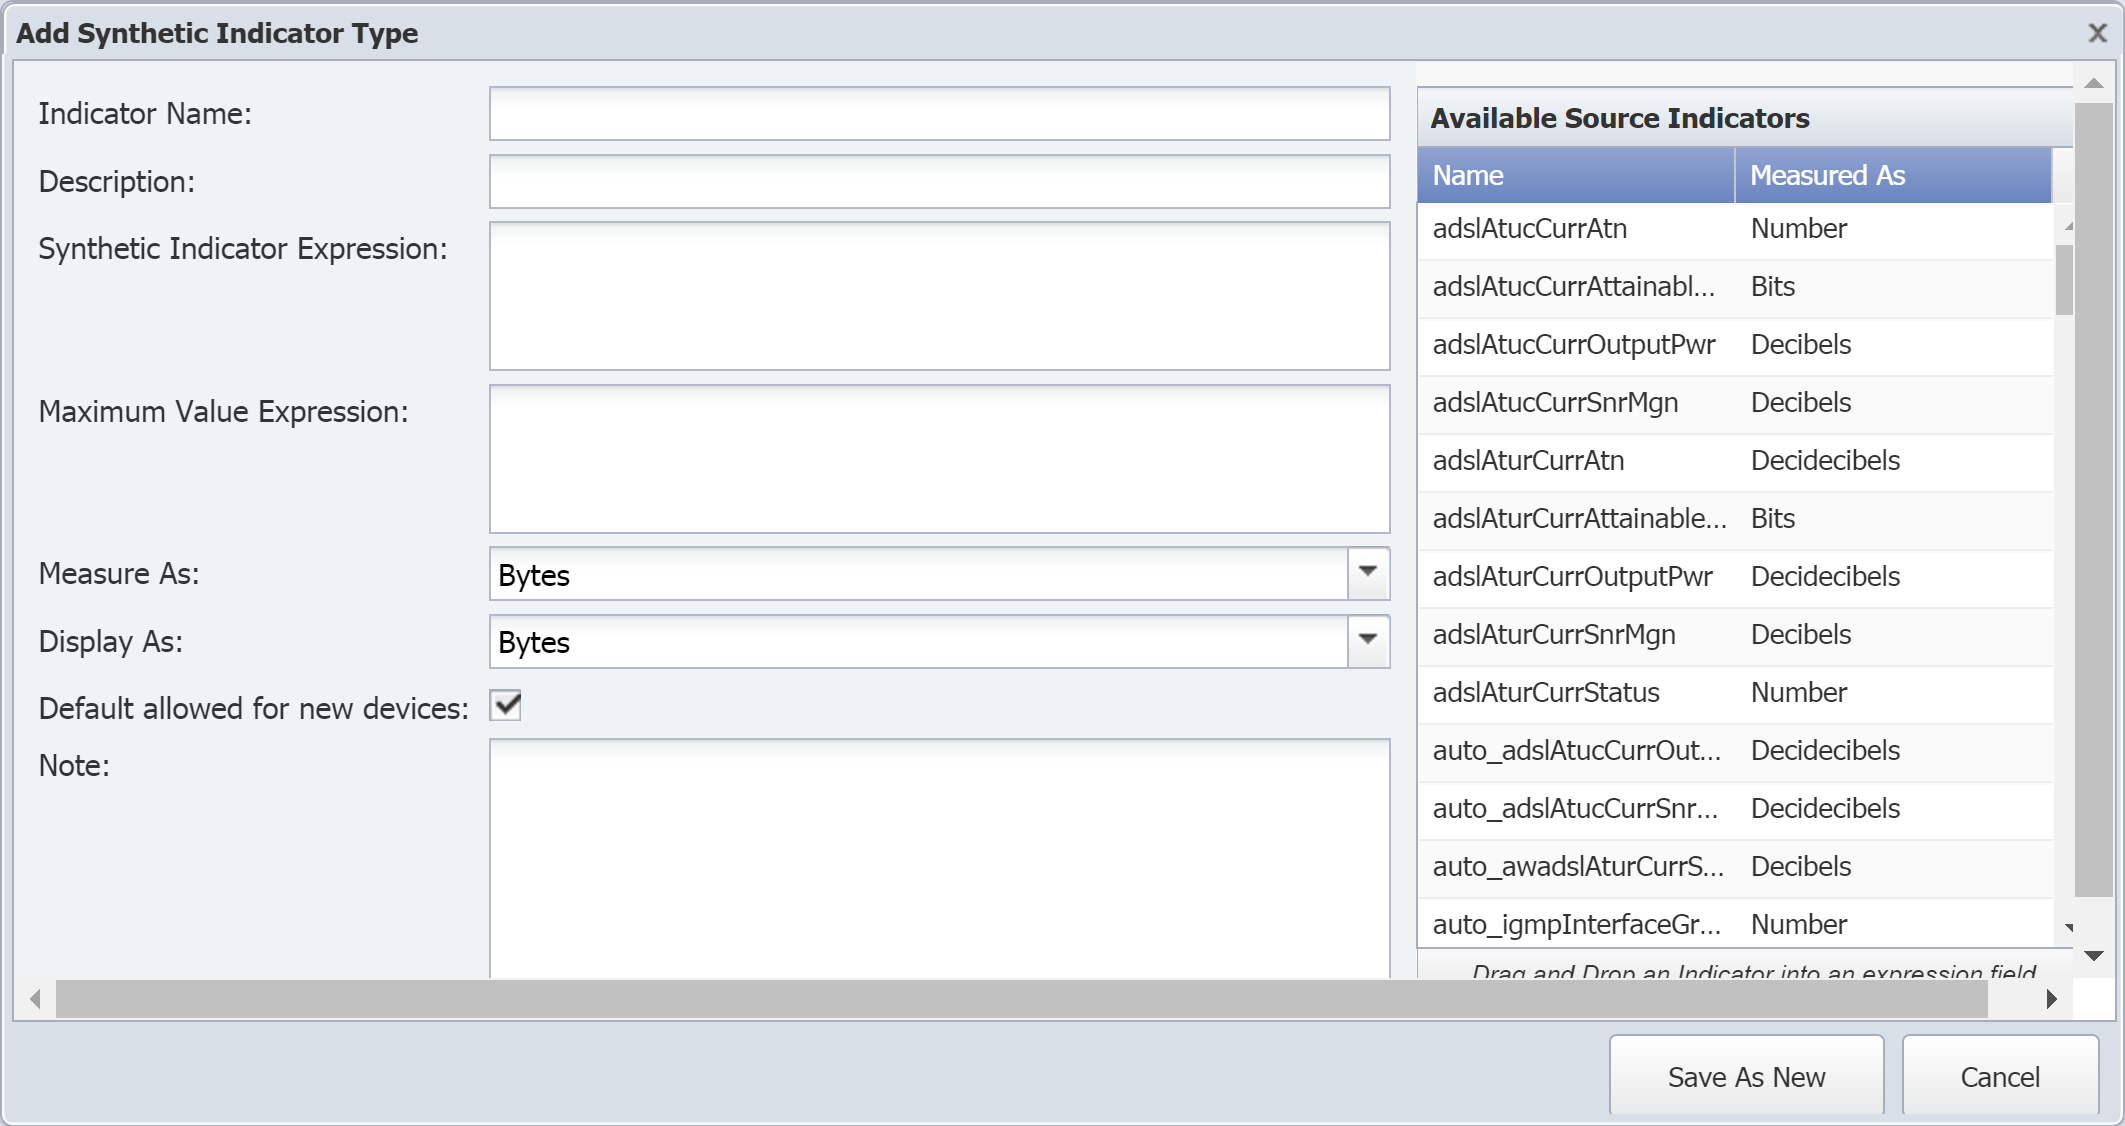
Click Add Synthetic Indicator Type to display the Add Synthetic Indicator Type pop-up. To edit an existing synthetic indicator type, select the indicator type and click
 under Actions to display the Edit Synthetic Indicator Type pop-up.
-
In the Indicator Name field, enter the name of the synthetic indicator type.
-
In the Description field, enter the name to display.
You'll see the indicator description displayed in reports and elsewhere in the UI. Keep this in mind when creating the indicator description. For example, when you look at an object's indicators, you'll notice that they're listed based on the first word of their description. If you have the two indicators Queued Bytes and Transmitted Bytes, they won't appear together. However, if you use the descriptions Bytes Queued and Bytes Transmitted, the indicators will appear in close proximity to each other.
-
The Synthetic Indicator Expression field is where you define the calculation. Perform the following actions to create the expression for this field.
A red border around the Synthetic Indicator Expression field indicates that your calculation is invalid. This also means that your graph results will be incorrect.
-
In the Available Source Indicators field on the right, select an indicator type to use in the expression. Drag and drop it into the Synthetic Indicator Expression field.
The Available Source Indicators field contains the indicator types for the object type that you selected a few steps ago.
-
Next, enter the applicable operators to formulate your calculation in the Synthetic Indicator Expression field. For a list of available operators, see Acceptable Operators below.
-
Drag any additional indicator types from the Available Source Indicators field and enter additional mathematical symbols to complete the expression in the Synthetic Indicator Expression field.
-
-
The Maximum Value Expression field lets you define a maximum value calculation for the indicator type. Perform the following actions to create the expression for this field.
-
In the Available Source Indicators field on the right, select an indicator type to use in the expression. Drag and drop it into the Maximum Value Expression field.
-
Next, enter the applicable operators to formulate your calculation in the Maximum Value Expression field. For a list of available operators, see Acceptable Operators below.
-
Drag any additional indicator types from the Available Source Indicators field and enter additional mathematical symbols to complete the expression in the Maximum Value Expression field.
-
-
Click the Measure As drop-down and select a data unit to measure in.
-
Click the Display As drop-down and select a unit to display results in.
-
Select the Default allowed for new devices check box to have the plugin poll this indicator type by default when the object type is enabled and when the plugin for a device is enabled.
-
In the Note field, enter any additional information you would like to include.
-
Click Save As New.
Acceptable Operators
Your expression formula can include the following characters:
-
+ add
-
- subtract
-
* multiply
-
/ divide
-
&& logical AND
-
|| logical OR
-
<= less than or equal to
-
>= greater than or equal to
-
! not equal to
-
== equal to
-
> greater than
-
< less than
-
^ raise x to the power of y
-
% modulus
-
?: if...then...else
-
isnan is Not a Number. This evaluates to 1 if the value is not a number. Otherwise, it evaluates to 0.
-
isValid is valid. This evaluates to 1 if the value has been discovered and is not isnan. Otherwise, it evaluates to 0.
-
useIfValid use if valid. This evaluates to the value if it has been discovered and is not isnan. It evaluates to the second argument otherwise.
If your calculation results in either of the following invalid values, there will be a gap in your graph:
-
Not a Number (NAN)
-
Infinity (+/-INF).
The following describes how SevOne NMS attempts to prevent invalid values. These are listed in the order that they're processed.
-
Zero divided by zero results in NAN.
-
Any positive value divided by zero results in +INF.
-
Any negative value divided by zero results in -INF.
-
Zero multiplied by +/-INF results in NAN.
-
Any value added to, subtracted from, multiplied by, divided by, or divided from NAN results in NAN.
-
Any value compared to NAN (<, <=, ==, >=, >) results in 0. NAN != NAN.
-
Any value compared to +INF is less than +INF, except that +INF == +INF
-
Any value compared to -INF is greater than -INF, except that -INF == -INF
-
Any value added to or subtracted from +INF results in +INF
-
Any positive value multiplied by +/-INF results in +/-INF
-
Any value divided by +/-INF results in 0