Table of Contents (Start)
- Topics
- Introducing SevOne
- Login
- Startup Wizard
- Dashboard
- Global Search - Advanced Search
- Report Manager
- Report Attachment Wizard
- Report Properties
- Report Interactions
- Instant Graphs
- TopN Reports
- Alerts
- Alert Archives
- Alert Summary
- Instant Status
- Status Map Manager
- Edit Maps
- View Maps
- FlowFalcon Reports
- NBAR Reports
- Logged Traps
- Unknown Traps
- Trap Event Editor
- Trap Destinations
- Trap Destination Associations
- Policy Browser
- Create and Edit Policies
- Webhook Definition Manager
- Threshold Browser
- Create and Edit Thresholds
- Probe Manager
- Discovery Manager
- Device Manager
- New Device
- Edit Device
- Object Manager
- High Frequency Poller
- Device Summary
- Device Mover
- Device Groups
- Object Groups
- Object Summary
- Object Rules
- VMware Browser
- AWS Plugin
- Azure Plugin (Public Preview)
- Calculation Plugin
- Database Manager
- Deferred Data Plugin
- DNS Plugin
- HTTP Plugin
- ICMP Plugin
- IP SLA Plugin
- JMX Plugin
- NAM
- NBAR Plugin
- Portshaker Plugin
- Process Plugin
- Proxy Ping Plugin
- SDWAN Plugin
- SNMP Plugin
- VMware Plugin
- Web Status Plugin
- WMI Plugin
- xStats Plugin
- Indicator Type Maps
- Device Types
- Object Types
- Object Subtype Manager
- Calculation Editor
- xStats Source Manager
- User Role Manager
- User Manager
- Session Manager
- Authentication Settings
- Preferences
- Cluster Manager
- Maintenance Windows
- Processes and Logs
- Metadata Schema
- Baseline Manager
- FlowFalcon View Editor
- Map Flow Objects
- FlowFalcon Views
- Flow Rules
- Flow Interface Manager
- MPLS Flow Mapping
- Network Segment Manager
- Flow Protocols and Services
- xStats Log Viewer
- SNMP Walk
- SNMP OID Browser
- MIB Manager
- Work Hours
- Administrative Messages
- Enable Flow Technologies
- Enable JMX
- Enable NBAR
- Enable SNMP
- Enable Web Status
- Enable WMI
- IP SLA
- SNMP
- SevOne Data Publisher
- Quality of Service
- Perl Regular Expressions
- Trap Revisions
- Integrate SevOne NMS With Other Applications
- Email Tips and Tricks
- SevOne NMS PHP Statistics
- SevOne NMS Usage Statistics
- Glossary and Concepts
- Map Flow Devices
- Trap v3 Receiver
- Guides
- Quick Start Guides
- AWS Quick Start Guide
- Azure Quick Start Guide (Public Preview)
- Data Miner Quick Start Guide
- Flow Quick Start Guide
- Group Aggregated Indicators Quick Start Guide
- IP SLA Quick Start Guide
- JMX Quick Start Guide
- Metadata Quick Start Guide
- RESTful API Quick Start Guide
- Self-monitoring Quick Start Guide
- SevOne NMS Admin Notifications Quick Start Guide
- SNMP Quick Start Guide
- Synthetic Indicator Types Quick Start Guide
- Topology Quick Start Guide
- VMware Quick Start Guide
- Web Status Quick Start Guide
- WMI Quick Start Guide
- xStats Quick Start Guide
- xStats Adapter - Accedian Vision EMS (TM) Quick Start Guide
- Deployment Guides
- Automated Build / Rebuild (Customer) Instructions
- Generate a Self-Signed Certificate or a Certificate Signing Request
- SevOne Best Practices Guide - Cluster, Peer, and HSA
- SevOne Data Platform Security Guide
- SevOne NMS Implementation Guide
- SevOne NMS Installation Guide - Virtual Appliance
- SevOne NMS Advanced Network Configuration Guide
- SevOne NMS Installation Guide
- SevOne NMS Port Number Requirements Guide
- SevOne NMS Upgrade Process Guide
- SevOne Physical Appliance Pre-Build BIOS and RAID Configuration Guide
- SevOne SAML Single Sign-On Setup Guide
- Cloud Platforms
- Other Guides
- Quick Start Guides
xStats Quick Start Guide
SevOne Documentation
All documentation is available from the IBM SevOne Support customer portal.
© Copyright International Business Machines Corporation 2024.
All right, title, and interest in and to the software and documentation are and shall remain the exclusive property of IBM and its respective licensors. No part of this document may be reproduced by any means nor modified, decompiled, disassembled, published or distributed, in whole or in part, or translated to any electronic medium or other means without the written consent of IBM.
IN NO EVENT SHALL IBM, ITS SUPPLIERS, NOR ITS LICENSORS BE LIABLE FOR ANY DAMAGES, WHETHER ARISING IN TORT, CONTRACT OR ANY OTHER LEGAL THEORY EVEN IF IBM HAS BEEN ADVISED OF THE POSSIBILITY OF SUCH DAMAGES, AND IBM DISCLAIMS ALL WARRANTIES, CONDITIONS OR OTHER TERMS, EXPRESS OR IMPLIED, STATUTORY OR OTHERWISE, ON SOFTWARE AND DOCUMENTATION FURNISHED HEREUNDER INCLUDING WITHOUT LIMITATION THE WARRANTIES OF DESIGN, MERCHANTABILITY OR FITNESS FOR A PARTICULAR PURPOSE, AND NONINFRINGEMENT.
IBM, the IBM logo, and SevOne are trademarks or registered trademarks of International Business Machines Corporation, in the United States and/or other countries. Other product and service names might be trademarks of IBM or other companies. A current list of IBM trademarks is available on ibm.com/trademark.
About
SevOne NMS supports several plugins. These out-of-the-box plugins can provide you with a lot of information about your network such as, CPU idle time, amount of time available to swap memory, fan status, duration of a phone call, network statistics, etc.
This document describes the xStats plugin. The xStats adapter collects the third-party, time-stamped data. It transforms this data for the xStats plugin to pull into SevOne NMS and monitor it just like how the data is monitored by the standard plugins.
In SevOne NMS, plugins are mechanisms that poll data from various technologies. They define a way to get data via a protocol such as SNMP, ICMP, WMI, etc. Most plugins are automatically enabled when you add a device to SevOne NMS, allowing you to poll applicable objects with minimal configuration. The xStats plugin is unique because it uses xStats Collection Sources, which are customized, to create devices in SevOne NMS. The xStats Collection Sources also create xStats object types and indicator types.
The following are some examples of SevOne's xStats adapters.
-
xStats Adapter for use with Arista EOS API (eAPI)
-
xStats Adapter for Flow Baselining and Alerting
-
xStats Adapter for use with Alcatel-Lucent 5620 Service Aware Manager
-
xStats Adapter for CSV
-
xStats Adapter for use with NSN NetAct IMS
To install / configure / customize an xStats adapter, please contact your SevOne Technical Account Manager. SevOne needs to first understand your environment, know the third-party systems you are working with, your goals, etc. to provide you with the best possible solution, pinpoint your unnecessary costs while improving your network's efficiency, etc.
Once all the details are gathered, SevOne's development team expert and professional services will create a customized xStats adapter for you. The customized parser will parse your third-party data and SevOne's xStats plugin will pull that data into SevOne NMS.
In this guide if there is,
-
[any reference to master] OR
-
[[if a CLI command contains master] AND/OR
-
[its output contains master]],
it means leader.
And, if there is any reference to slave or worker, it means follower.
Starting SevOne NMS 6.7.0, MySQL has moved to MariaDB 10.6.12 .
Prerequisites
Access Control Lists
Once SevOne has installed your xStats adapter, you will need to configure your Access Control Lists (ACLs) so that the appropriate ports are open for your network to communicate with the SevOne NMS appliance.
Device Information
You will need to have the following information on-hand.
-
IP address of the device that data will be monitored from
-
Name of the directory where your data will be monitored from
-
If you are using SFTP, the user name and password for authenticating onto the device that the data will be monitored from
PAS Information
Certain actions require you to SSH into the PAS and enter a few commands. Please make sure to have the following available.
-
An SSH client, such as PuTTY
-
Root username and password for your SSH session
Configuration Steps
xStats Collection Sources
The xStats Collection Source collects data. This data creates the xStats devices, xStats object types, and xStats indicator types in SevOne NMS. The xStats Collection Source is automatically created during the xStats adapter installation process. For further instructions on how to add and configure sources, please refer to your adapter's installation guide. Please see the sections below on how to manage the xStats collection sources.
Add / Modify xStats Collection Source
Perform the following steps to create / modify an xStats Collection Source.
-
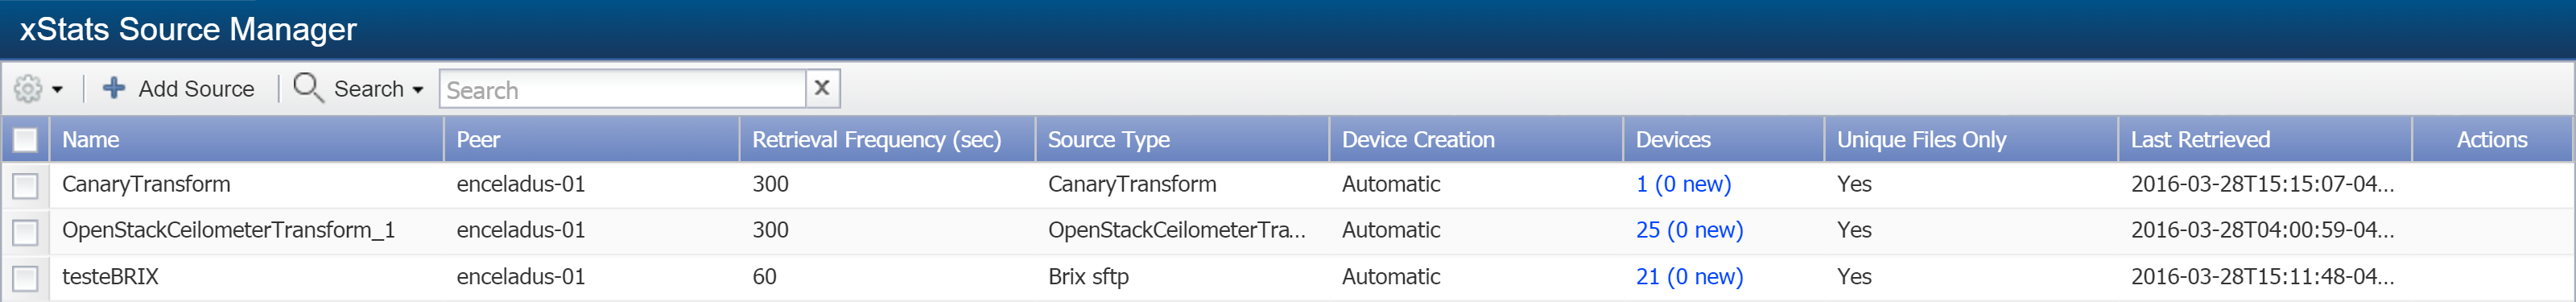
From the navigation bar, click Administration and select Monitoring Configuration, then xStats Source Manager.
-
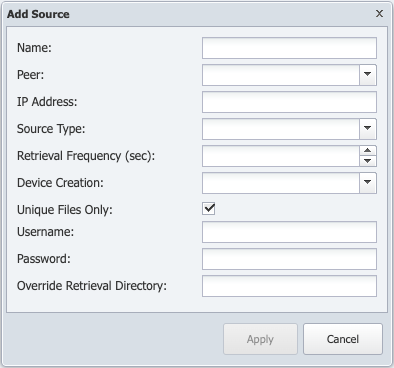
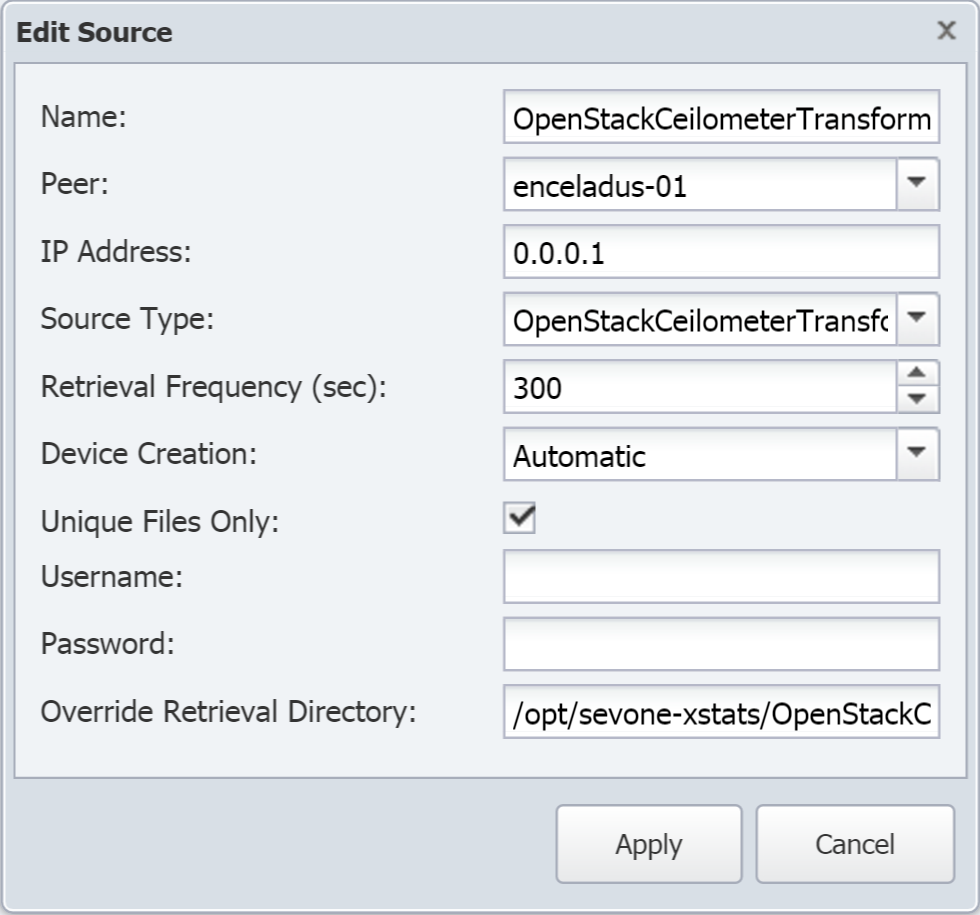
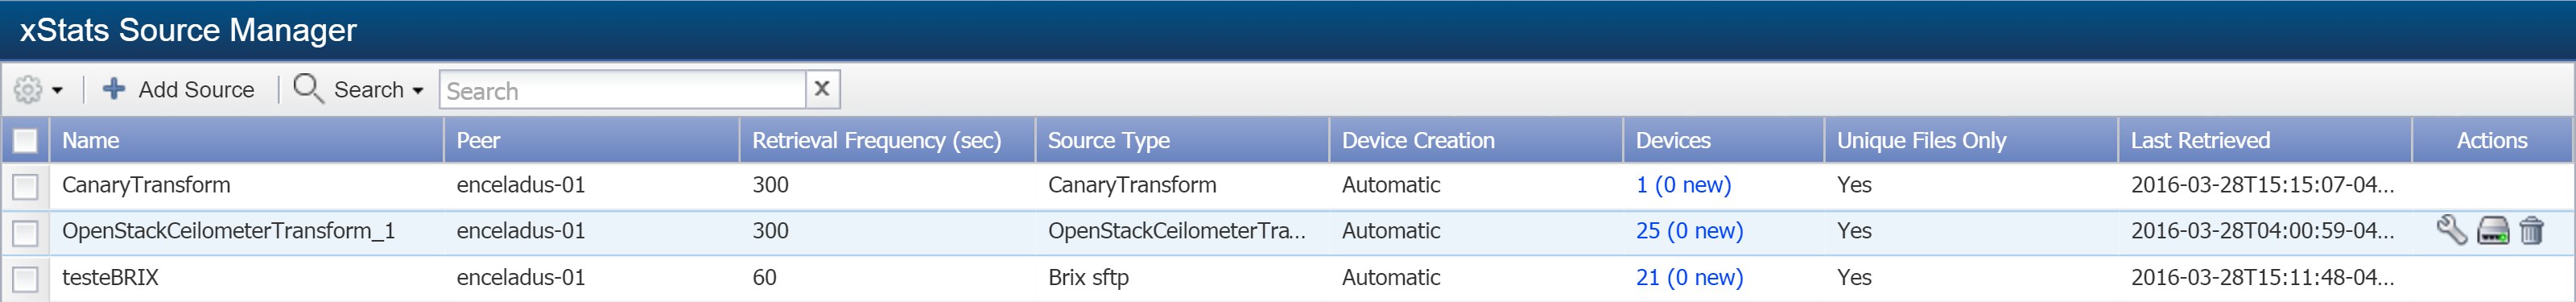
Click Add Source to add the xStats collection source or click
 on the row of the existing source you want to edit / modify.
-
In the Name field, enter the xStats Collection Source name. This is how the name will appear within the SevOne NMS xStats Source Manager and has no bearing on other settings.
-
Click the Peer drop-down and select the peer to monitor data from the xStats Collection Source.
Each xStats Collection Source has a different load impact on the appliance. If you are working with a larger cluster and you have multiple xStats Collection Sources, it may be beneficial to distribute them among different peers in SevOne NMS.
-
In the IP Address field, enter the IP address of the device that the xStats Collection Source will monitor data from. If you are using the local system, you can enter either of two standard options: 0.0.0.1 or 127.0.0.1. If you are using SFTP, enter the IP address where the files that need to be monitored, reside.
-
Click the Source Type drop-down. You will see the name of your xStats adapter listed twice. One occurrence will be followed by localfilesystem, and the other is followed by sftp. Select the collection method for the xStats Collection Source to use.
-
In the Retrieval Frequency (sec) field, enter the number of seconds indicating how often the xStats Collection Source will attempt to receive new data. The retrieval duration for each xStats Collection Source can be set to any value, but it is most commonly set to 300 seconds (5 minutes).
This setting applies to the sftp source type. While it does not apply to the localfilesystem source type, the field cannot be left empty. Please make sure to enter a number here regardless of which source type you choose in the previous step.
-
Click the Device Creation drop-down and select one of the following options.
-
Manual - allows you to manually add devices to SevOne NMS after the devices have been discovered by the xStats Collection Source. You can also link devices discovered by the xStats Collection Source to devices that already exist in SevOne NMS.
-
Automatic - automatically adds devices discovered by the xStats Collection Source. These devices have the xStats plugin enabled by default.
-
-
Select the Unique Files Only check box to have the xStats Collection Source collect only files that have not been collected previously. Leave it clear to collect all available files from the devices, including previously collected files, and to re-process all previous data from those files.
-
In the Username field, enter the user name SevOne NMS needs to authenticate onto the device that the source data is monitored from. This is required when using SFTP.
-
In the Password field, enter the password SevOne NMS needs to authenticate onto the device. This is required when using SFTP.
-
In the Override Retrieval Directory field, enter the full path to the directory on the SevOne NMS appliance where you prefer to store data. If you leave this field blank, a default directory based on the current SevOne NMS appliance will be assigned.
-
Click Apply to save changes.
Manage xStats Devices created from an xStats Collection Source
The xStats data that comes from an xStats Collection Source creates devices. The xStats Source Manager includes a Devices column, which shows how many devices have been created from the xStats Collection Source. It also shows the number of new devices found by the latest poll. For example, in the screenshot below, the Devices column displays 25 (0 new) for the xStats Collection Source OpenStackCeilometerTransform_1. The first number (25, in this example), refers to the number of devices created from the xStats Collection Source. The number within the parentheses displays the number of new devices from the latest poll.
-
On the xStats Source Manager page, select an xStats Collection Source.
-
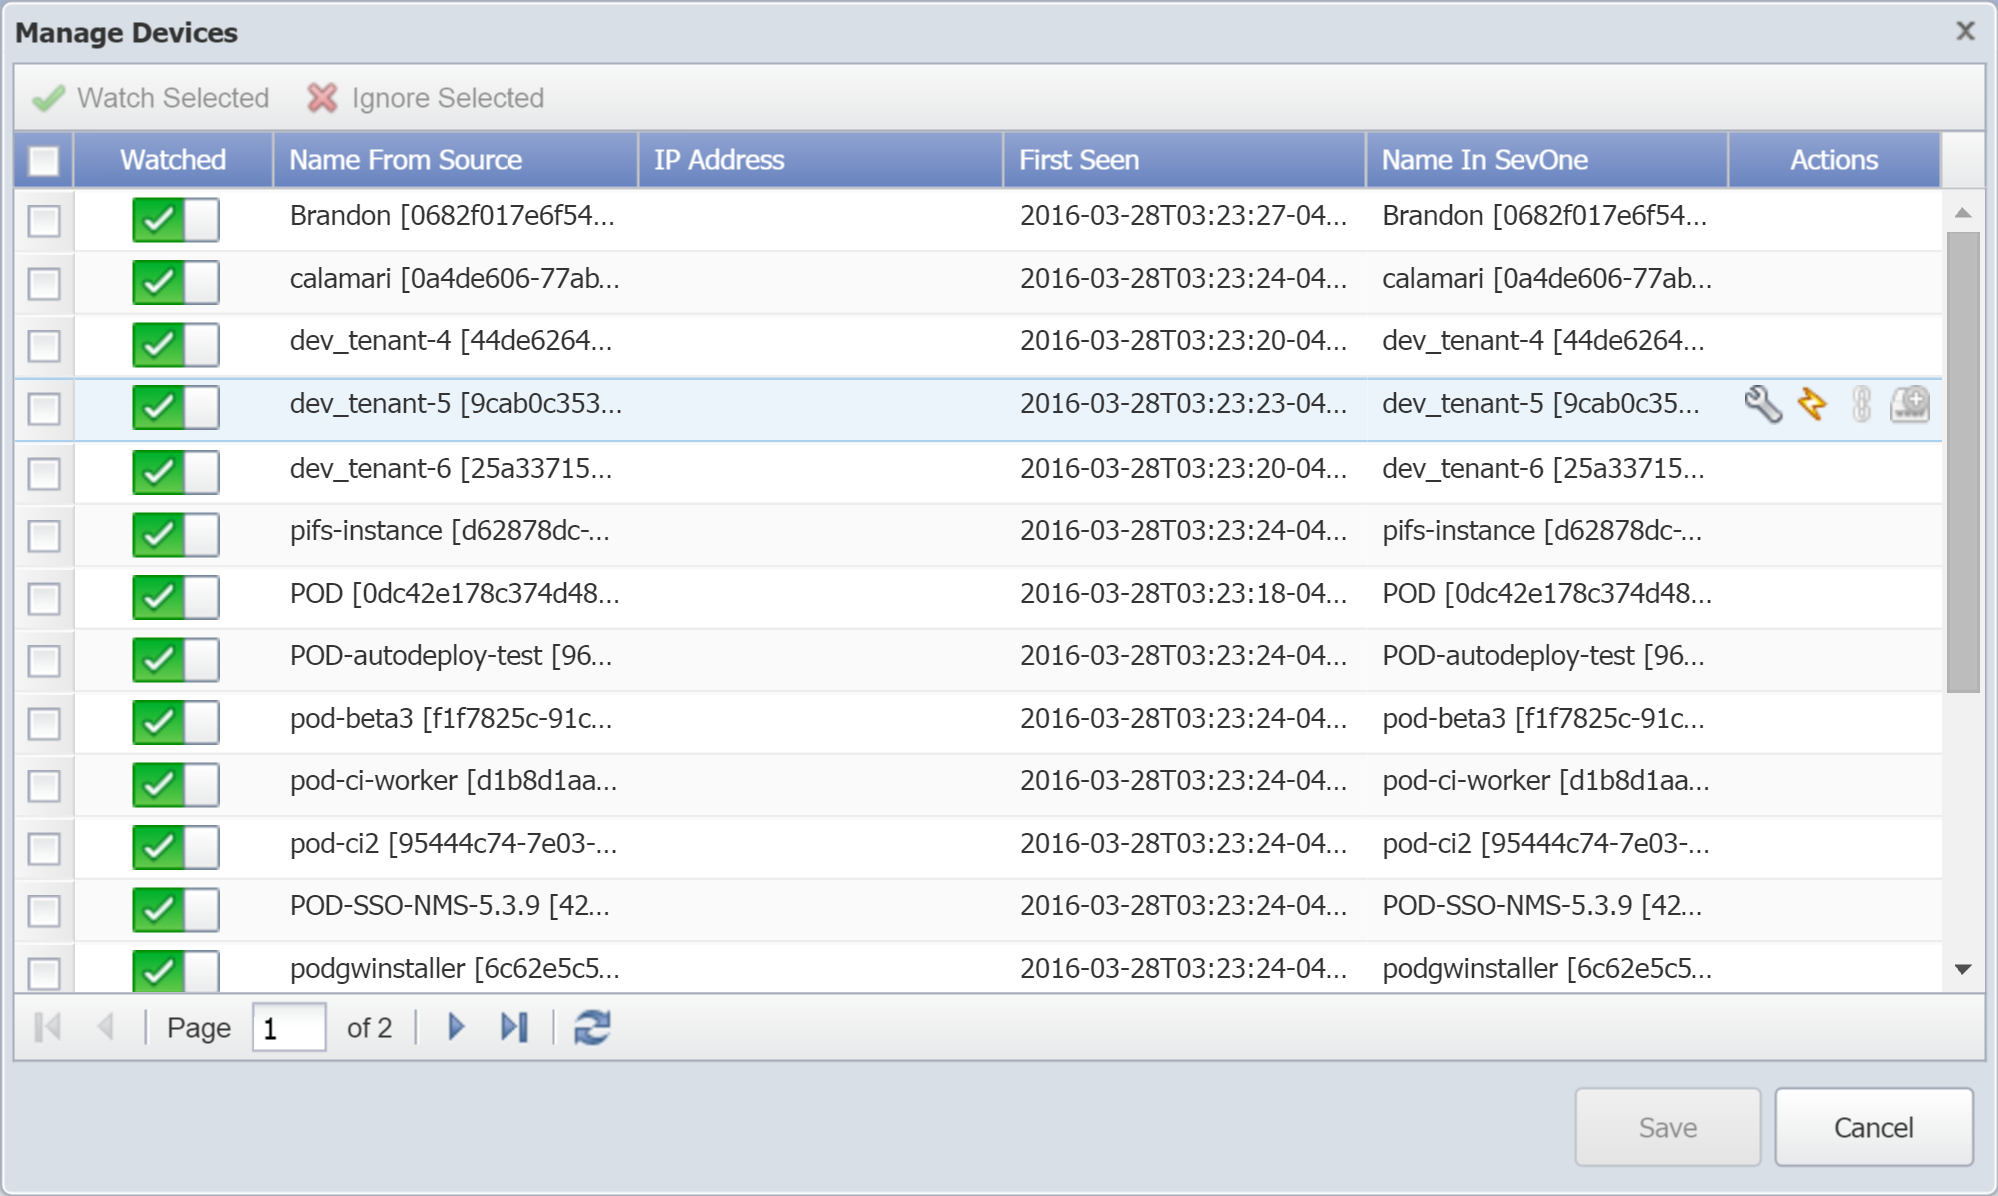
Click the link under Devices to display the Manage Devices pop-up.
-
The following information appears for devices in the list.
-
Watched -
 indicates that a device is being watched by the xStats plugin.
  indicates that a device is being ignored by the xStats plugin.
-
Name From Source - displays the name of the device as discovered by the xStats Collection Source.
-
IP Address - displays the IP address of the device.
-
First Seen - displays the date and time the device first appeared from the xStats Collection Source.
-
Name in SevOne - displays the name of the device as it appears in Device Manager.
-
-
Select a device to perform one or more of the following actions under Actions.
-
 - click to display the Edit Device page, where applicable.
-
 - click to display a link to the Device Summary and links to the report templates that are applicable for the device.
-
 - click to link the new device to a device that is already in SevOne NMS. This option is available when you configure an xStats Collection Source to require manual device creation. It is useful when multiple xStats Collection Sources find the same xStats device.
-
 - click to add the device as a new device. This option is available when you configure an xStats Collection Source to require manual device creation.
-
-
At the top of Manage Devices pop-up, the following options are available.
-
Watch Selected - click to have the xStats plugin watch the device.
-
Ignore Selected - click to have the xStats plugin ignore the device.
-
-
Click Save to apply changes.
Remove an xStats Collection Source
When you remove an xStats Collection Source, the devices, objects, and indicators that were created from it are not affected. Perform the following steps to delete the xStats Collection Source.
In order to completely remove the xStats Collection Source for an adapter, you must SSH into the PAS as root and execute the following commands. Please contact SevOne Support for assistance, if required.
-
Using ssh, log in to the PAS as root.
$sshroot@<PAS IP address orhostname>
-
Delete the cron file for your adapter.
$rm/etc/cron.d/<adaptercronfile>Example$rm/etc/cron.d/xstats-OpenStackCeilometerTransform
For most adapters, there will be only one cron file to delete, as shown in the example above. In case of this particular adapter (OpenStack Ceilometer), you must delete the custom cron file by using the following command.
$rm/etc/cron.d/xstats-OpenStackCeilometerTransformCustom -
In SevOne NMS, delete the xStats Collection Source. From the navigation bar, go to Administration > Monitoring Configuration > xStats Source Manager. Select the xStats Collection Source and click
 under Actions to delete it.
You also need to delete the devices for this xStats Collection Source. To view the devices before deleting the xStats Collection Source, locate the xStats Collection Source in the xStats Source Manager and click the link under Devices. This will display a list of the devices that will need to be deleted.

-
Return to your SSH client and enter the following command to delete log files.
$rm-r/var/log/xstats/<adapter package name>/Example$rm-r/var/log/xstats/OpenStackCeilometerTransform/ -
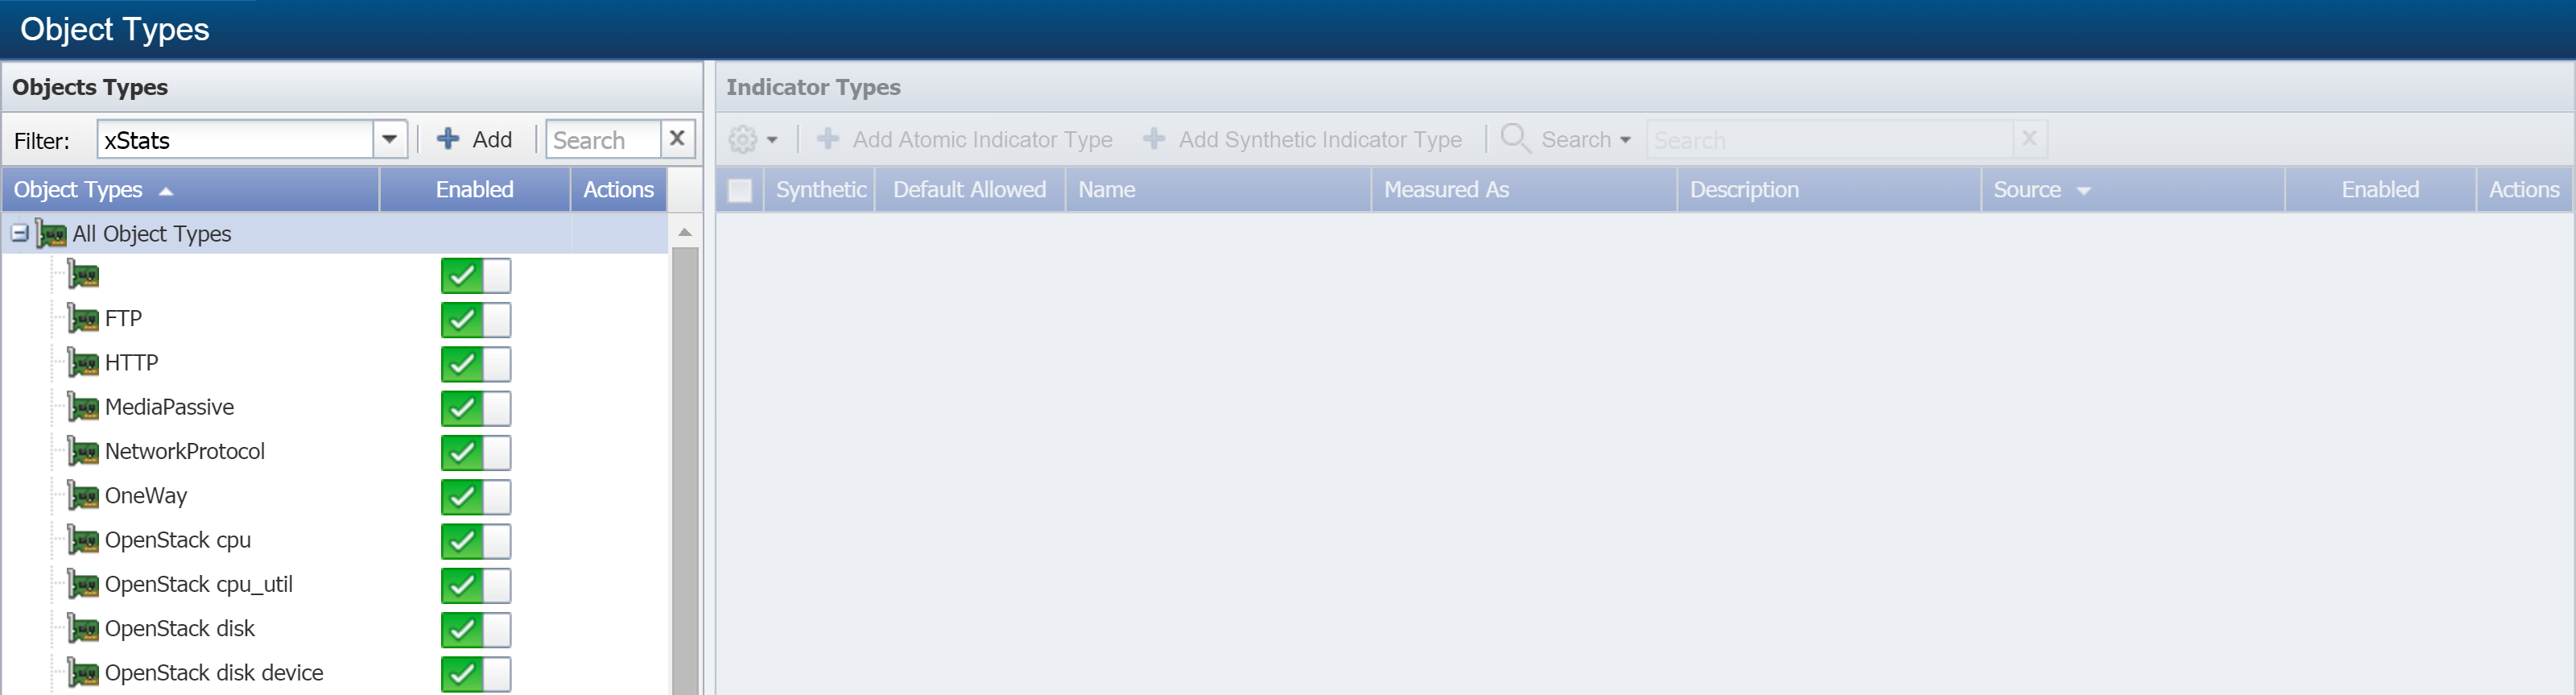
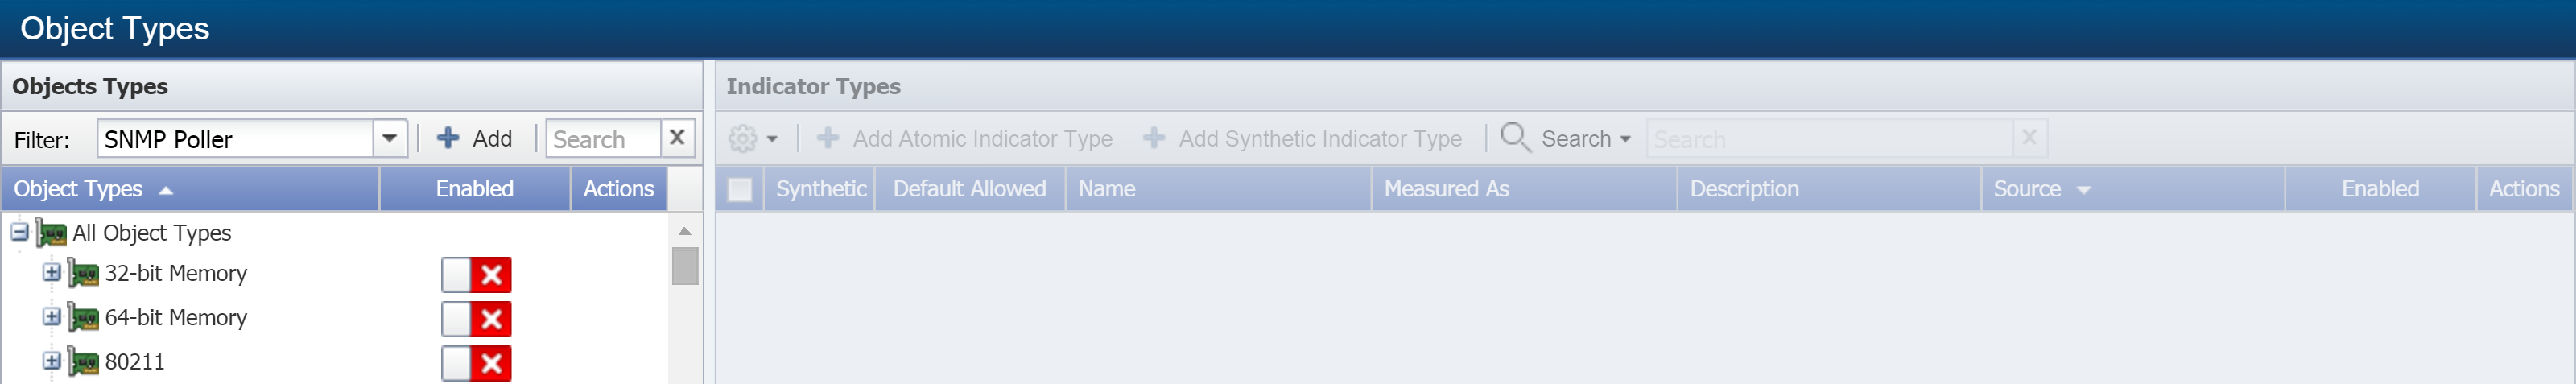
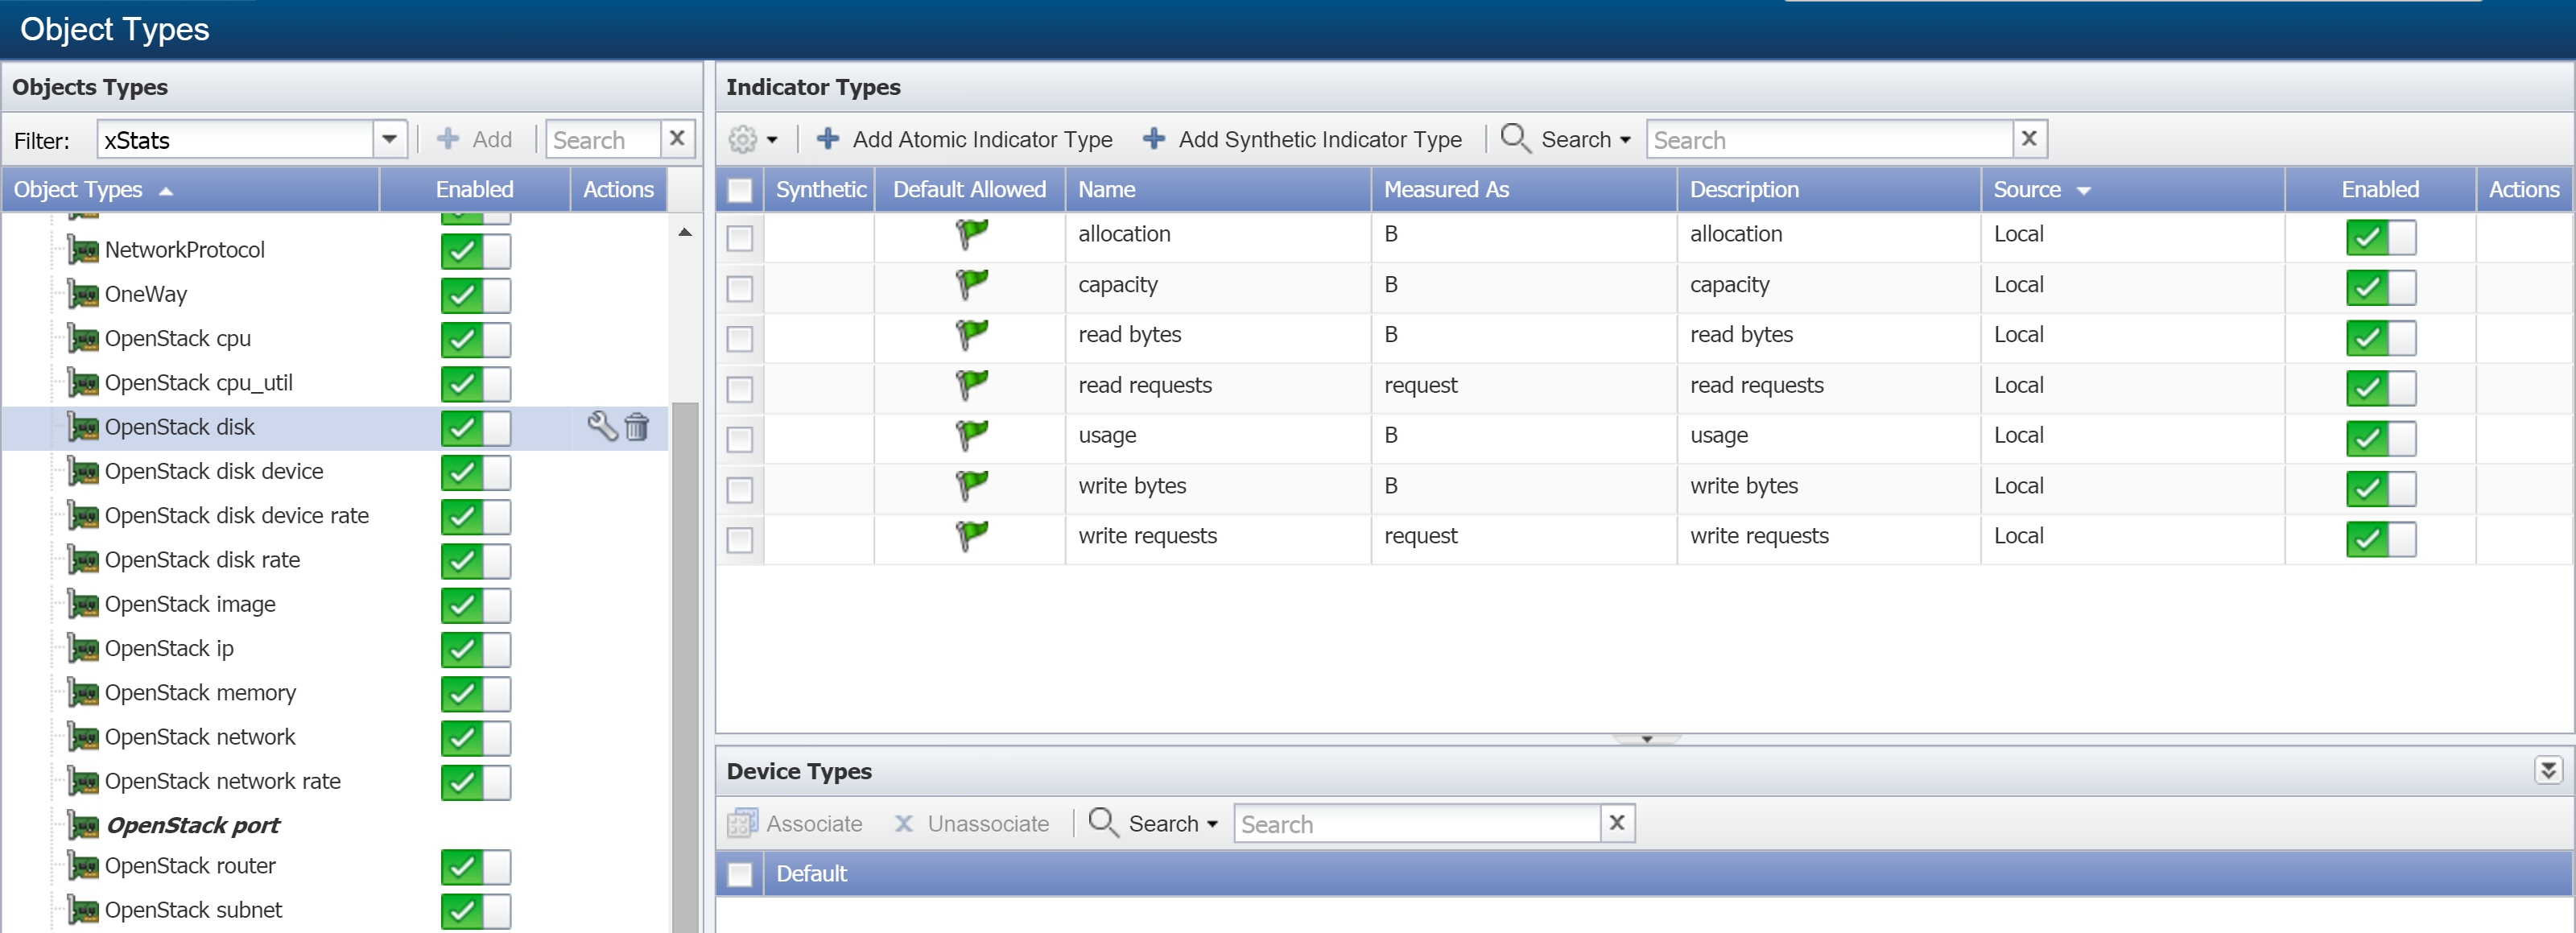
In SevOne NMS, perform the following actions to delete the object types.
-
From the navigation bar, go to Administration > Monitoring Configuration > Object Types.
-
In the left navigation bar, under Object Types, click the Filter drop-down and select xStats.
-
Select each Object Type for the xStats Collection Source and click
under Actions to delete it.
Before deleting an Object Type, verify that it does not affect other xStats sources. Otherwise, data loss can occur once that Object Type is removed.
-
-
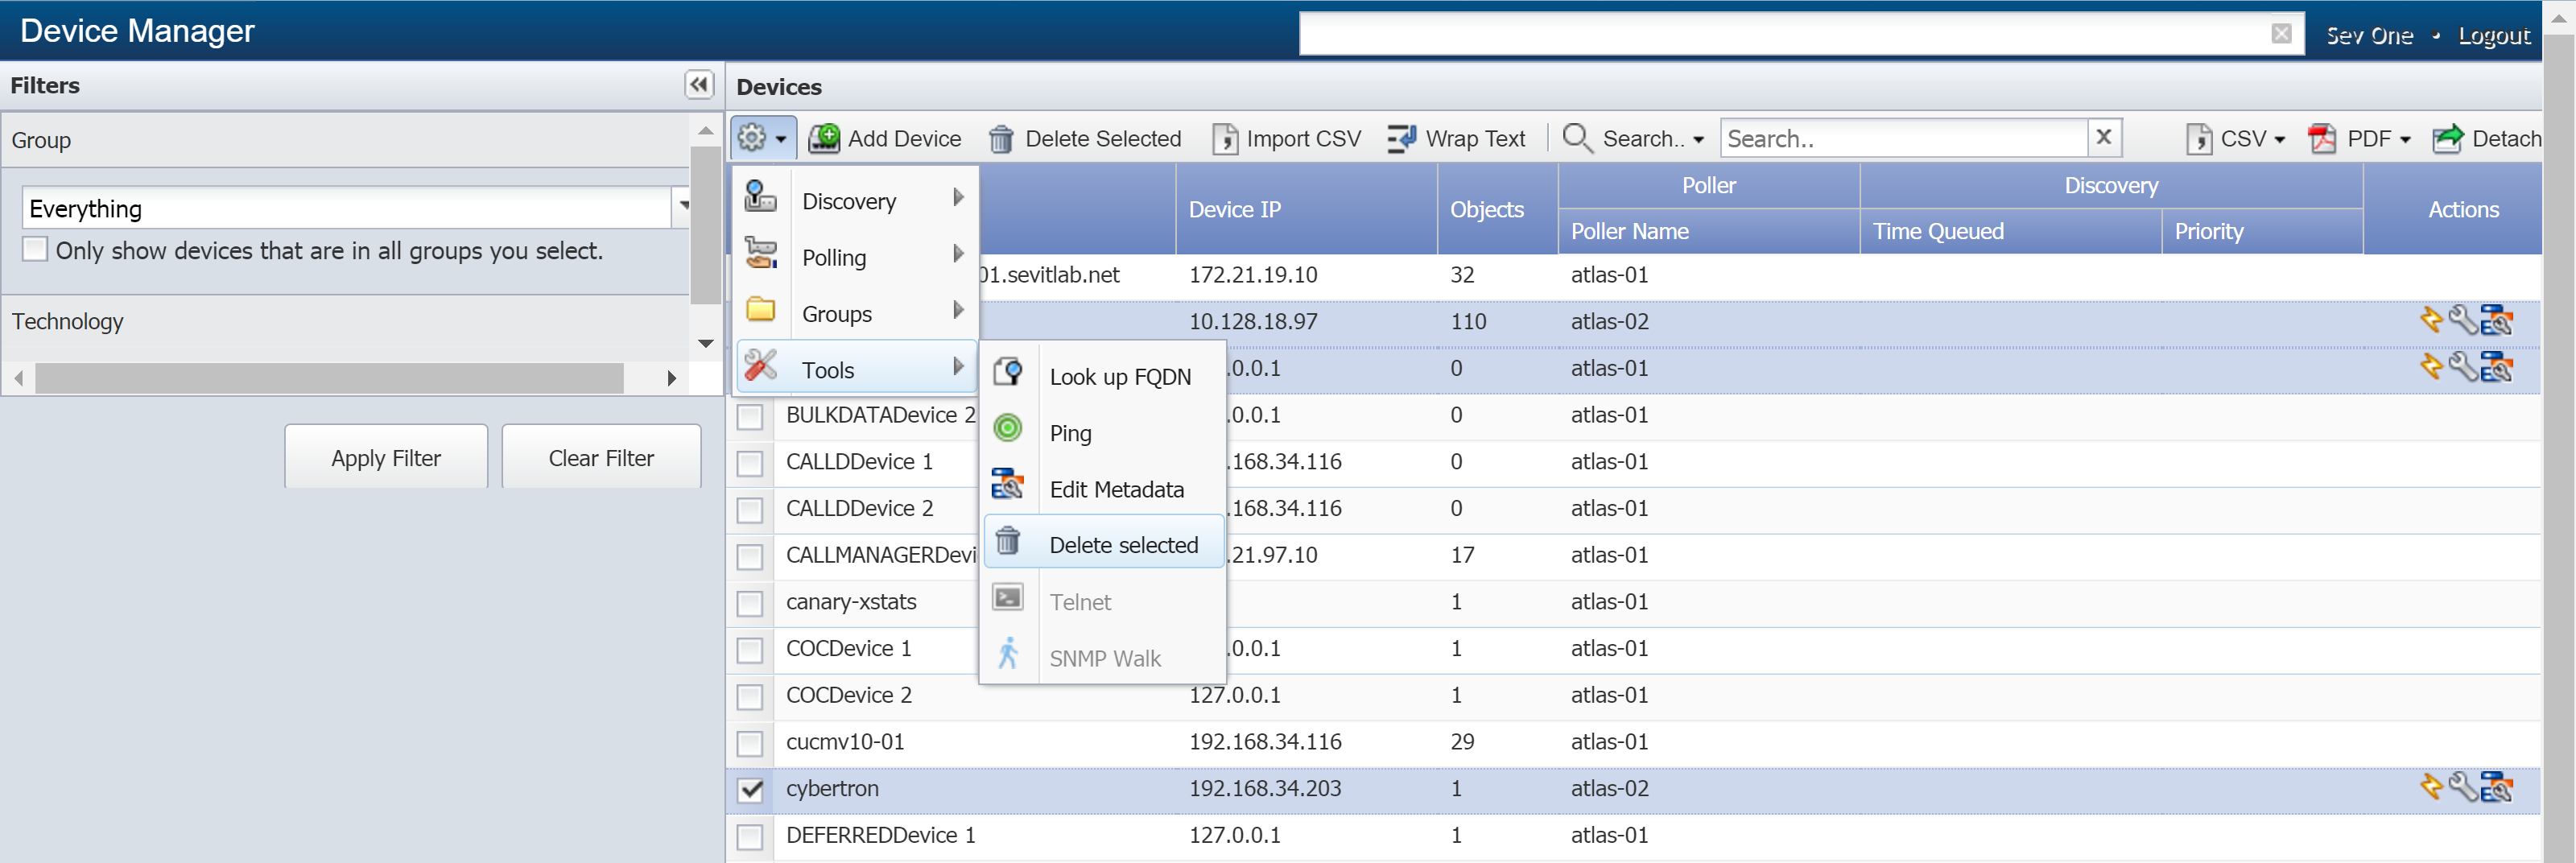
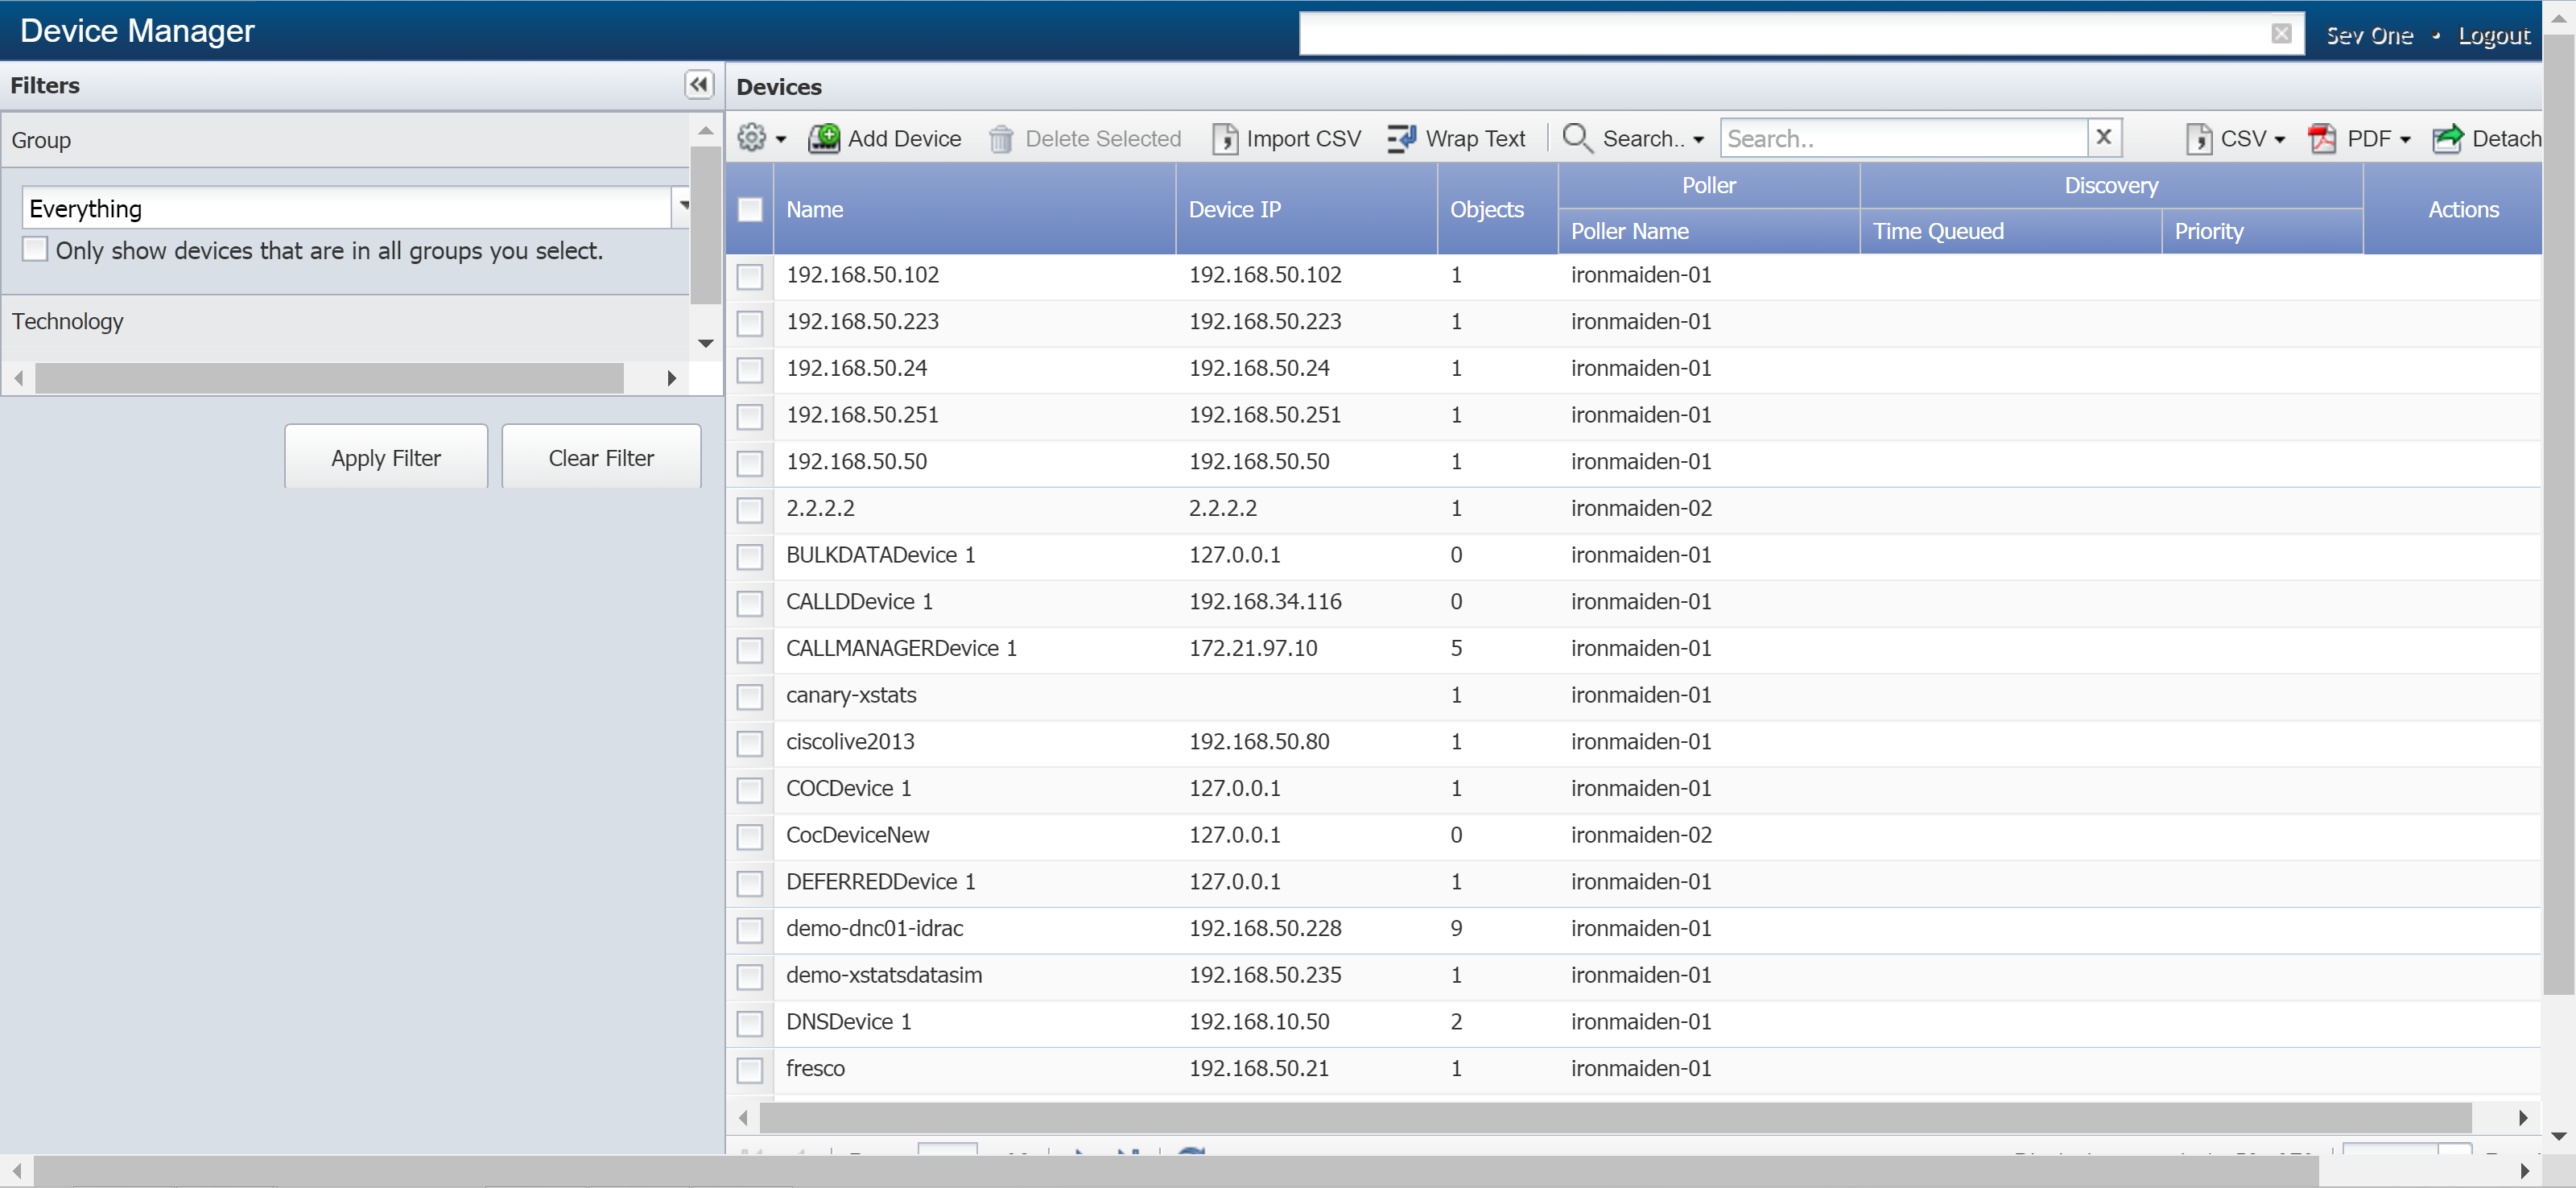
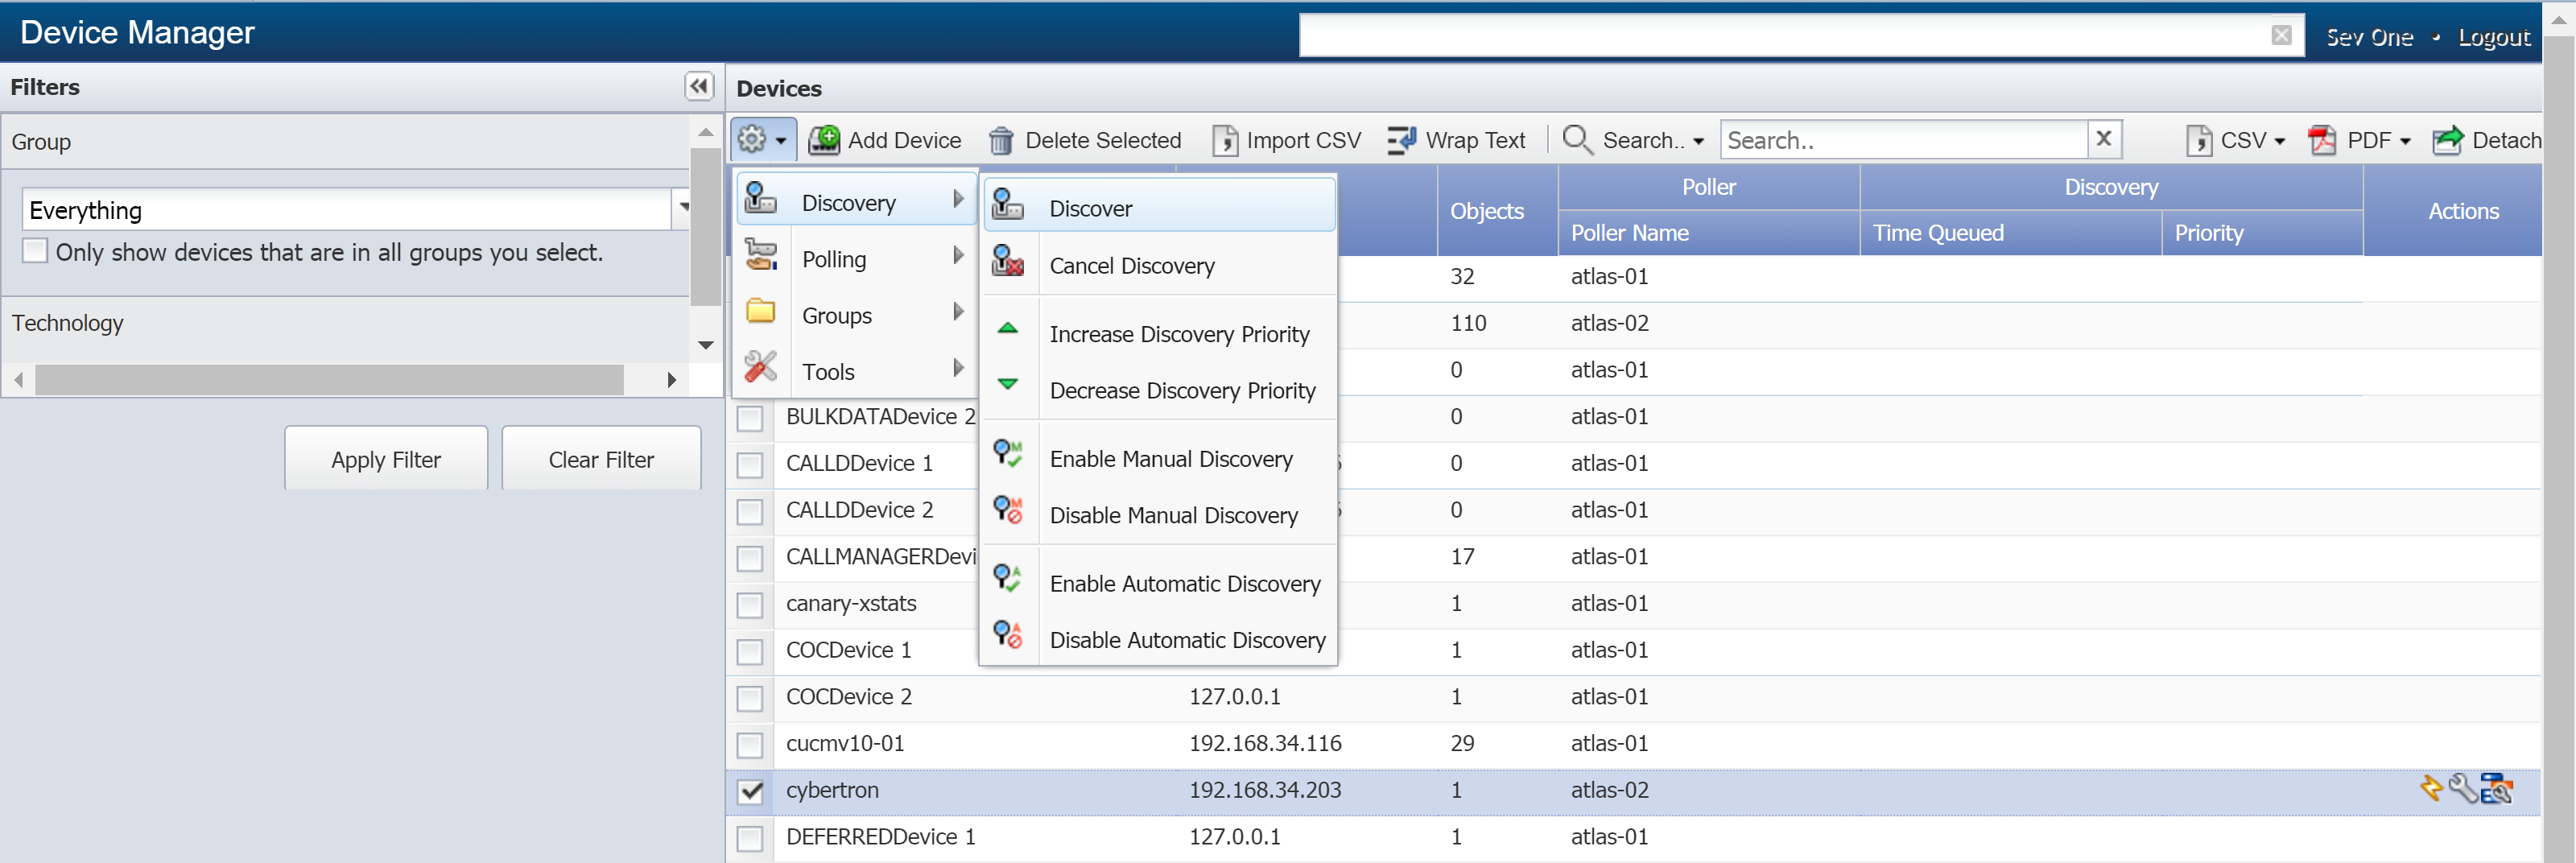
Perform the following actions to delete the devices in SevOne NMS.
-
From the navigation bar, go to Devices > Device Manager.
-
Select the check box for each device that you want to delete for the xStats Collection Source.
-
Click
 and select Tools, then Delete selected to delete the devices.
-
-
Return to your SSH client. Enter the following command to delete the xStats adapter directory.
This step is a destructive process that removes the adapter from your NMS. Once it has been executed it cannot be undone. Please proceed with caution!
$rm-r/opt/sevone-xstats/<adapter package name>/Example$rm-r/opt/sevone-xstats/OpenStackCeilometerTransform/
Enable xStats Plugin
The xStats plugin is automatically enabled for the devices created from xStats Collection Sources. This means that SevOne NMS can discover and monitor xStats indicators for object types as long as long as the object types are enabled. You can use the Edit Device page to disable / enable the xStats plugin for each device.
Perform the following steps to enable (or disable) the xStats plugin for a device.
-
From the navigation bar, click Devices and select Device Manager.
-
Select a device and click
to display the Edit Device page. The plugin section appears in the lower half of the page. By default, it is set to SNMP.
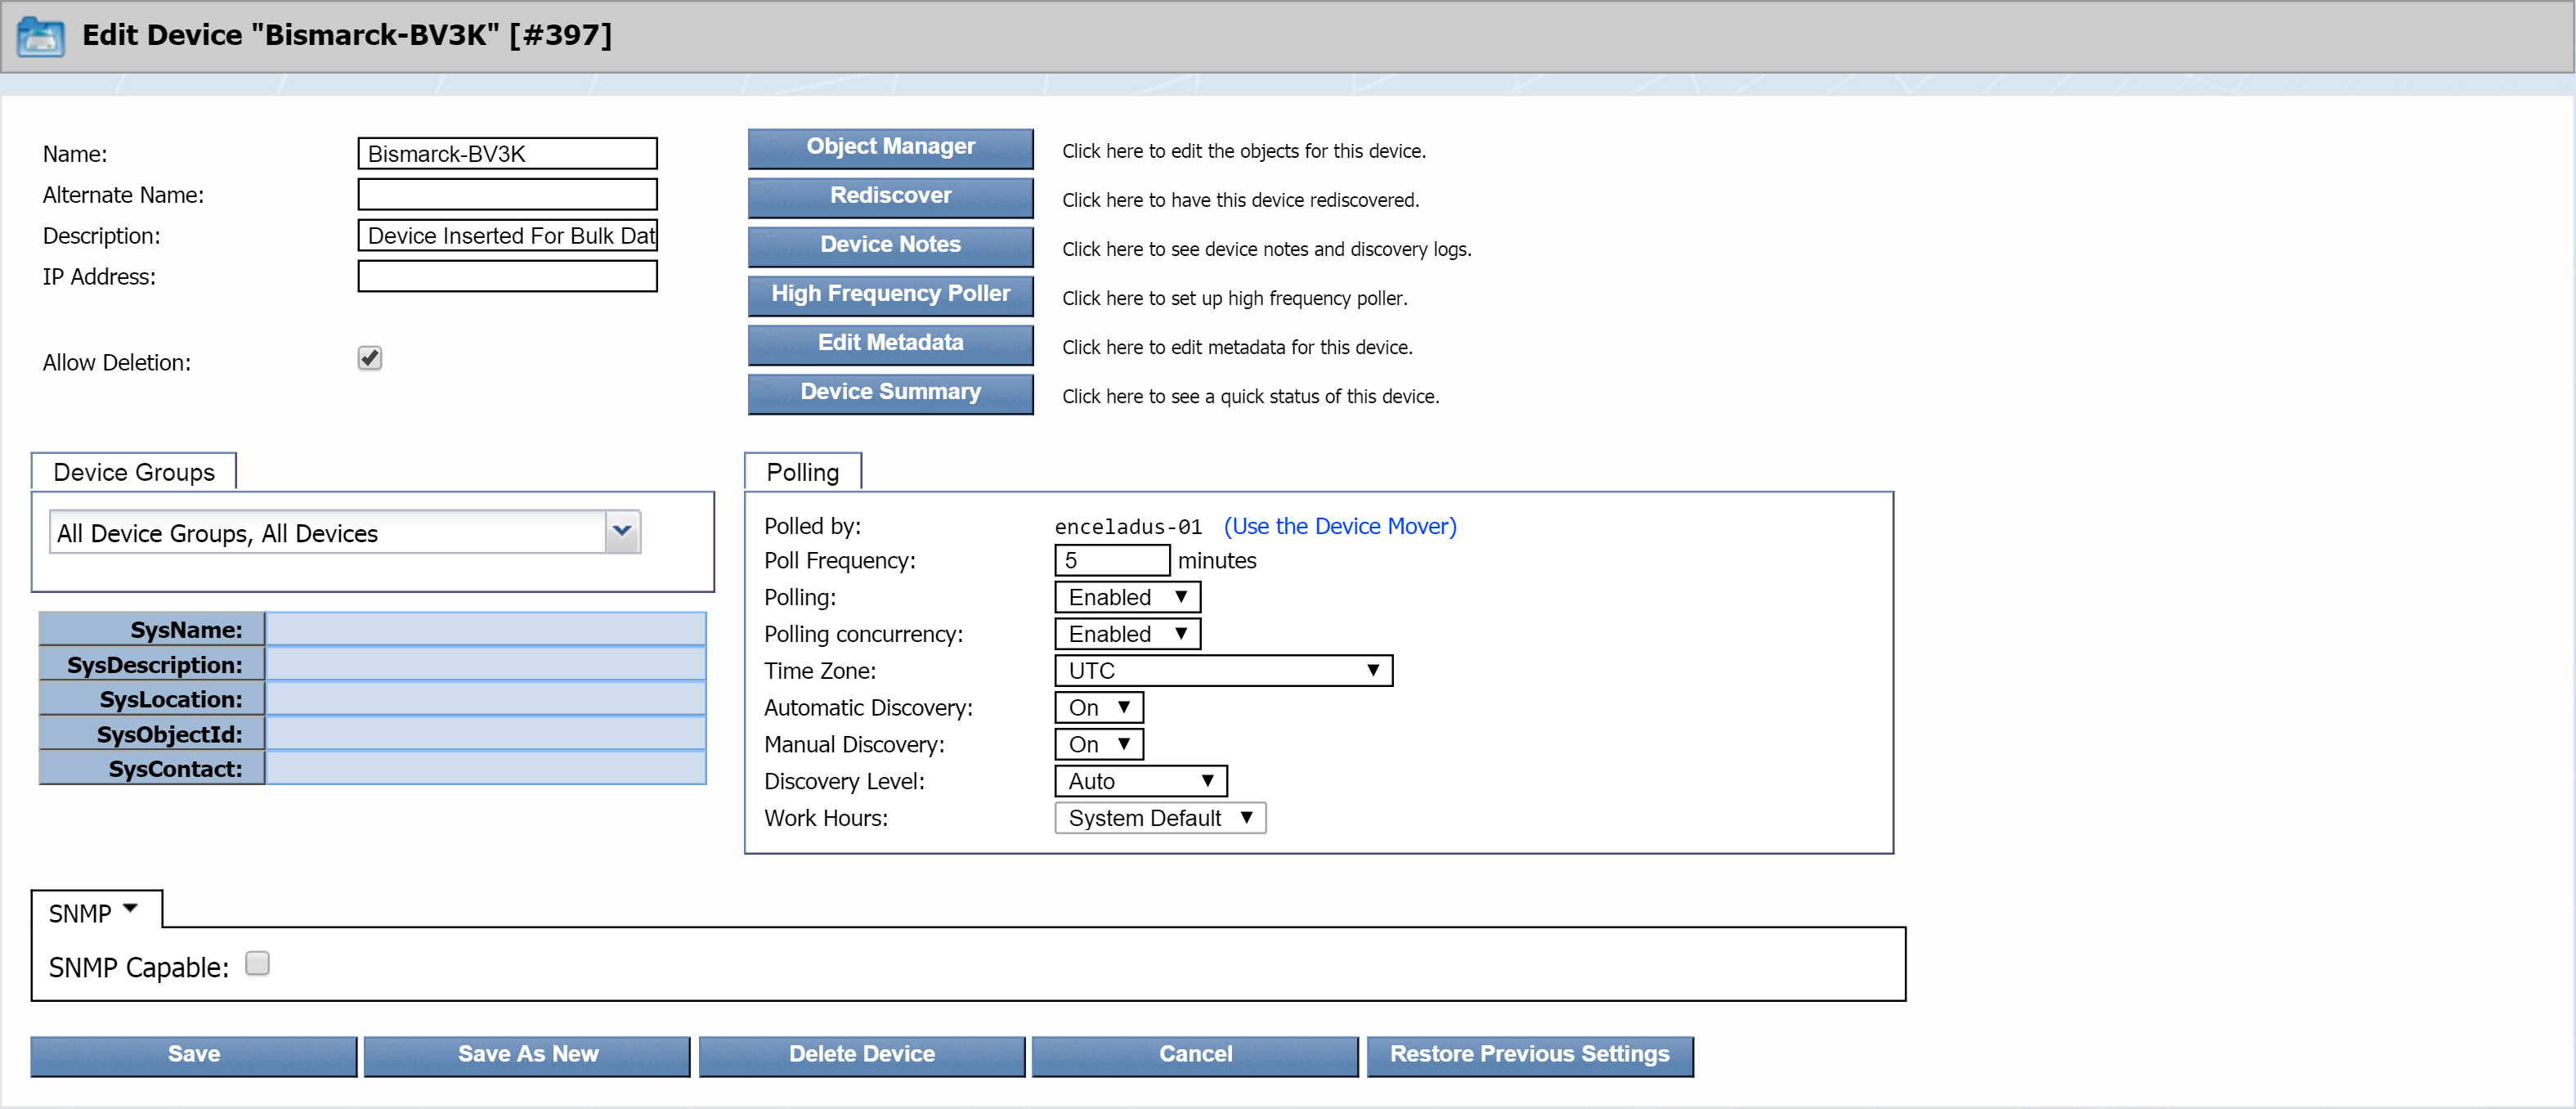
-
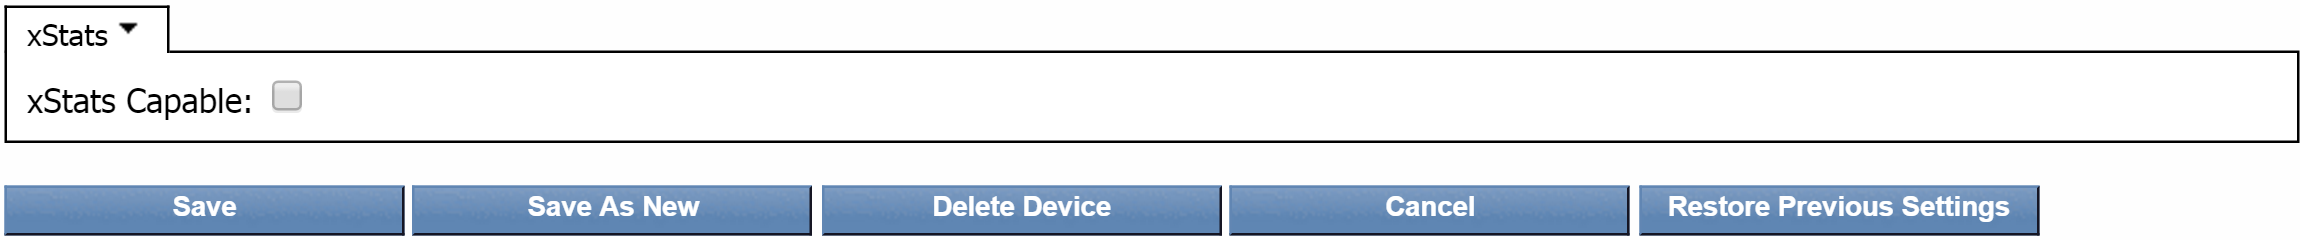
Next to SNMP, click the drop-down and select xStats.
-
Select the xStats Capable check box to enable the processing of xStats data for the device.
-
Click Save.
Manage xStats Object Types
To manage xStats object types, go to Object Types page. Object types enable the xStats plugin to discover related objects on a device. The xStats plugin discovers the xStats object types on xStats devices. By default, xStats object types and indicator types are enabled.
Please do not modify the xStats object types unless it is absolutely necessary; it can possibly affect the adapter's behavior.
Perform the following steps to add / edit xStats object types.
-
From the navigation bar, click Administration and select Monitoring Configuration, then Object Types.
-
Click the Filter drop-down and select xStats. In the Object Types hierarchy on the left, you will see the xStats object types.

-
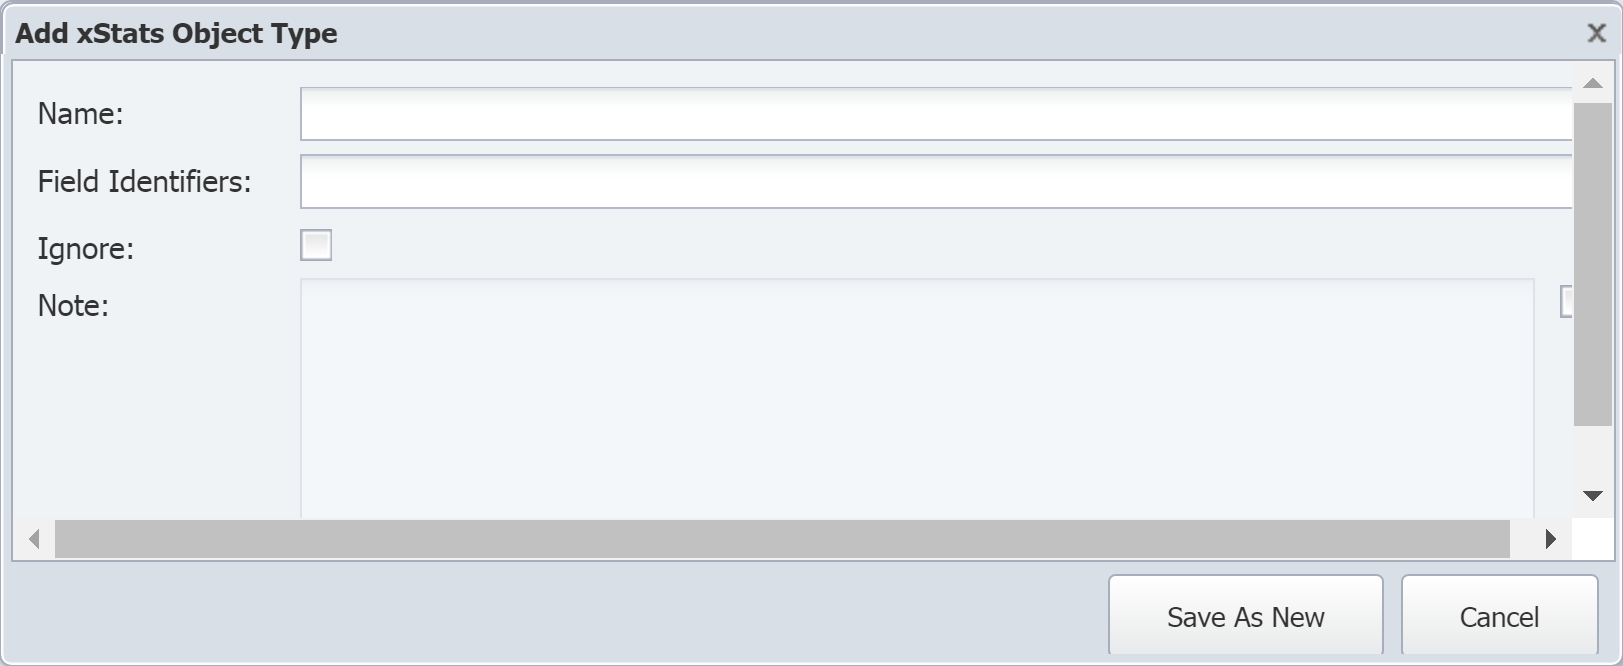
Click
 to display the Add xStats Object Type pop-up. To edit an existing object type, select the object type from the list in the left navigation bar and click
  under Actions.
-
In the Name field, enter the object type name.
-
In the Field Identifiers field, enter the object type field identifiers that the xStats Collection Source provides.
-
Select the Ignore check box if you do not want the xStats plugin to monitor the object type. Otherwise, leave it clear.
-
Select the check box for the Note field to enable it for editing. Enter any additional information you would like to include.
-
Click Save As New.
Manage xStats Indicator Types
Indicator types define the kind of metrics an object can have. The following section shows you how indicator types can be added / modified. Every indicator of an object needs an indicator type. SevOne NMS plugins such as, SNMP, xStats, etc., use indicator types to collect data from indicators on the objects that you monitor. There are two categories of indicator types: atomic and synthetic.
-
Atomic indicator types are measured directly by plugins.
-
Synthetic indicator types calculate values based on the values resulting from other indicator types.
Please do not modify the xStats indicator types unless it is absolutely necessary; it can possibly affect the adapter's behavior.
xStats Atomic Indicator Types
Perform the following steps on the Object Types page to add or edit xStats atomic indicator types.
-
In the Object Types hierarchy on the left, select the object type that you would like to create an indicator type for.
-
On the right side of the page, under Indicator Types, click Add Atomic Indicator Type to display the Add xStats Indicator Type pop-up. To edit an existing indicator type, select the indicator type and click
under Actions.
-
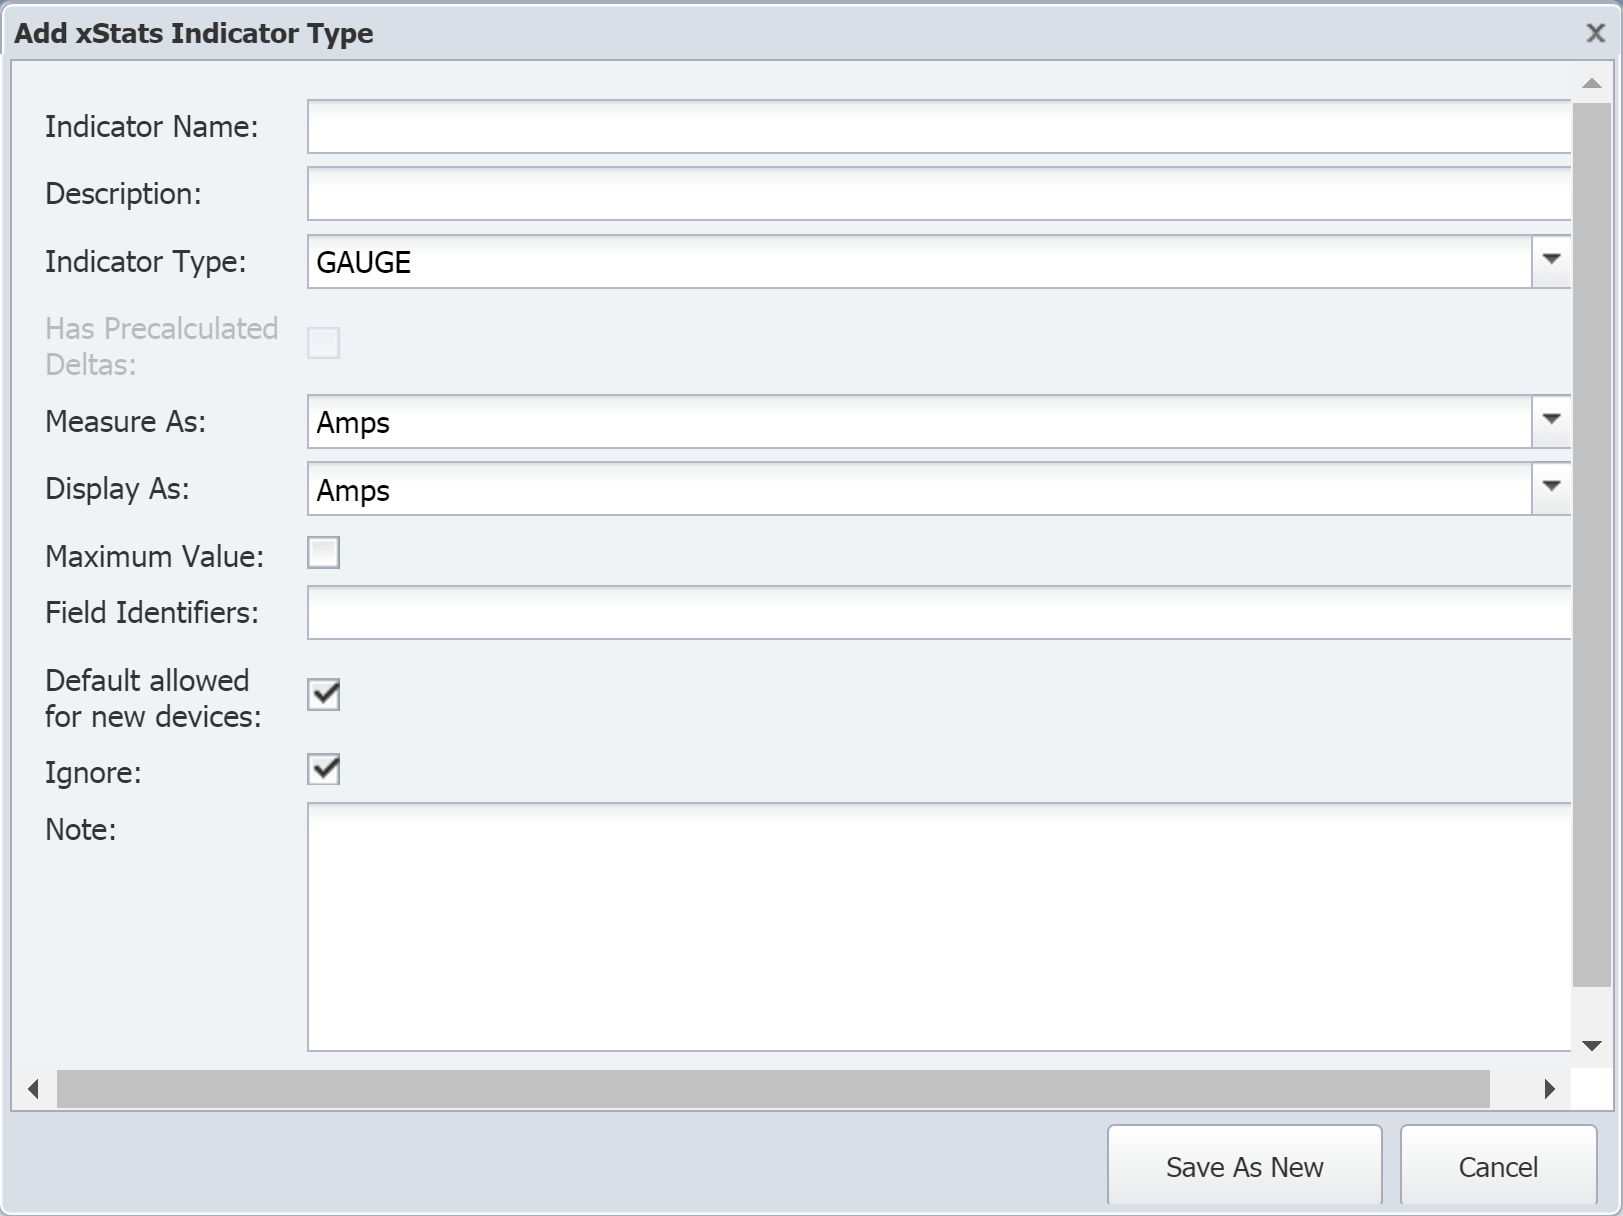
In the Indicator Name field, enter the name of the indicator type.
-
In the Description field, enter the description to display.
-
Click the Indicator Type drop-down and select one of the following options.
-
GAUGE - for indicators that have specific values when polled.
-
COUNTER32 - for 32-bit indicators that continue to increment. If you select this option, you can select the Has Precalculated Deltas check box to total the delta / differences between polls. This provides the ability to graph details like the number of errors in a day, for example.
-
COUNTER64 - for 64-bit indicators that continue to increment. If you select this option, you can select the Has Precalculated Deltas check box.
-
-
Click the Measure As drop-down and select a data unit.
-
Click the Display As drop-down and select a display unit.
-
Select the Maximum Value check box to indicate that the indicator type has a maximum value.
-
In the Field Identifiers field, enter the indicator type field identifiers.
-
Select the Default allowed for new devices check box to have the plugin poll this indicator type by default when the object type is enabled and when the plugin for a device is enabled.
-
Select the Ignore check box if you want to prevent the xStats plugin from processing data for the indicator type.
-
In the Note field, enter any additional information you would like to include.
-
Click Save As New.
xStats Synthetic Indicator Types
Using synthetic indicator types, you can create your own key performance indicators (KPIs) even when those KPIs such as, Percent Usage, Percent Loss, Percent Error, and Percent Idle do not exist on a device. For example, let's say that you want to monitor voice gateways to find out which primary rate interface (PRI) is getting the most usage. Typical poll metrics can tell you the busy status of individual bearer channels, or B channels, but they cannot tell you the sum of the statuses for all the B channels. This makes it difficult to find out the total usage of a particular PRI.
In SevOne NMS, you can create a single indicator type that tells you what percentage of a PRI is being used.
You will need the following.
-
An existing indicator type that tells you how many busy B channels there are for a given PRI. Let's call this BChannelsBusy.
-
The total number of B channels for our PRI. That number is 23.
Using this information, synthetic indicator type can be created with an expression to perform the following calculation.
(BChannelsBusy*23)/100
Now you have a new indicator type, a synthetic indicator type, that tells you what percentage of the PRI is being used. There is no need to look up the number of busy B channels and perform calculations manually.
Since synthetic indicator types are based on existing indicator types, either atomic or synthetic, there must already be at least one existing indicator type in order for you to create a new synthetic indicator type. Also, synthetic indicator types may not work with data having a timestamp older than 2 - 4 hours.
Perform the following steps on the Object Types page to add or edit xStats synthetic indicator types.
-
In the Object Types hierarchy on the left, click on an object type to display its indicator types on the right. If the object type does not have any indicator types, the Add Synthetic Indicator Type button does not appear.
-
Click Add Synthetic Indicator Type to display the Add Synthetic Indicator Type pop-up. To edit an existing synthetic indicator type, select the indicator type and click
under Actions.
-
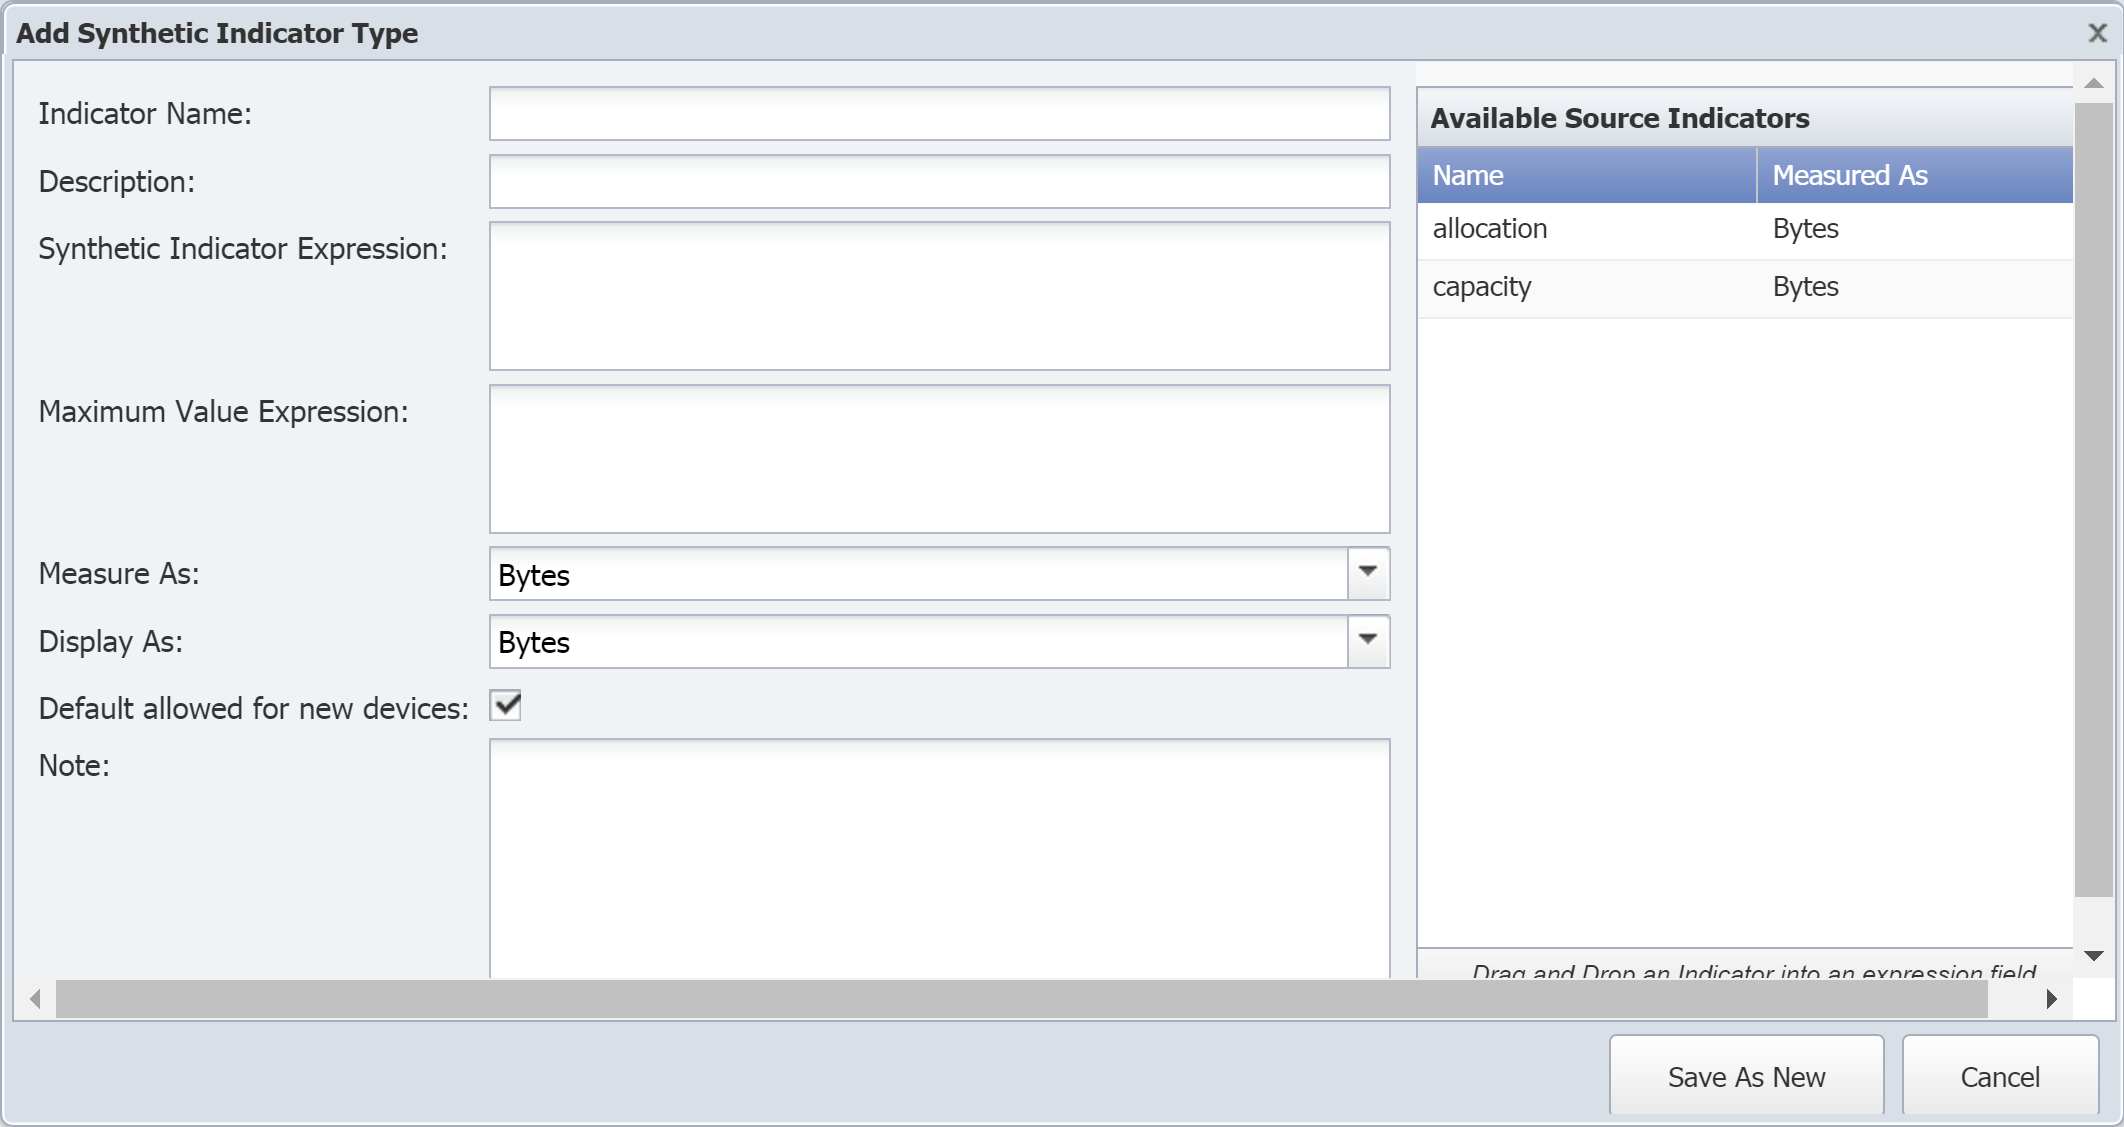
In the Indicator Name field, enter the name of the synthetic indicator type.
-
In the Description field, enter the description to display.
You will see the indicator description displayed in reports and elsewhere in the user interface. When creating the indicator type description, please keep this in mind. For example, when you look at an object's indicators, you will notice that they are listed based on the first word of their description. If you have the two indicators Queued Bytes and Transmitted Bytes, they may not appear together. However, if you use the descriptions Bytes Queued and Bytes Transmitted, the indicators will appear in close proximity to each other.
-
The Synthetic Indicator Expression field is where you define the calculation. Perform the following actions to create the expression for this field.
A red border around the Synthetic Indicator Expression field indicates that your calculation is invalid. This also means that your graph results will be incorrect.
-
In the Available Source Indicators field on the right, select an indicator type to use in the expression. Drag and drop it into the Synthetic Indicator Expression field.
The Available Source Indicators field contains the indicator types for the selected object type.
-
Enter the applicable operators to formulate your calculation in the Synthetic Indicator Expression field. For a list of available operators, see Acceptable Operators below.
-
Drag any additional indicator types from the Available Source Indicators field and enter additional mathematical symbols to complete the expression in the Synthetic Indicator Expression field.
-
-
The Maximum Value Expression field lets you define a maximum value calculation for the indicator type. Perform the following actions to create the expression for this field.
-
In the Available Source Indicators field on the right, select an indicator type to use in the expression. Drag and drop it into the Maximum Value Expression field.
-
Enter the applicable operators to formulate your calculation in the Maximum Value Expression field. For a list of available operators, see Acceptable Operators below.
-
Drag any additional indicator types from the Available Source Indicators field and enter additional mathematical symbols to complete the expression in the Maximum Value Expression field.
-
-
Click the Measure As drop-down and select a data unit.
-
Click the Display As drop-down and select a display unit.
-
Select the Default allowed for new devices check box to have the plugin poll this indicator type by default when the object type is enabled and when the plugin for a device is enabled.
-
In the Note field, enter any additional information you would like to include.
-
Click Save As New.
Acceptable Operators
Your expression formula can include the following characters.
|
Operator |
Description |
|
+ |
add |
|
- |
subtract |
|
* |
multiply |
|
/ |
divide |
|
&& |
logical AND |
|
|| |
logical OR |
|
<= |
less than or equal to |
|
>= |
greater than or equal to |
|
!= |
not equal to |
|
== |
equal to |
|
> |
greater than |
|
< |
less than |
|
^ |
raise x to the power of y |
|
% |
modulus |
|
?: |
if-then-else |
|
isnan |
is Not a Number. |
|
isValid |
is valid. |
|
useIfValid |
use if valid. |
If your calculation results in either of the following invalid values, there will be a gap in your graph.
-
Not a Number (NAN)
-
Infinity (+/-INF).
The following describes how SevOne NMS attempts to prevent invalid values. These are listed in the order that they are processed.
-
Zero divided by zero results in NAN.
-
Any positive value divided by zero results in +INF.
-
Any negative value divided by zero results in -INF.
-
Zero multiplied by +/-INF results in NAN.
-
Any value added to, subtracted from, multiplied by, divided by, or divided from NAN results in NAN.
-
Any value compared to NAN (<, <=, ==, >=, >) results in 0. NAN != NAN.
-
Any value compared to +INF is less than +INF, except that +INF == +INF
-
Any value compared to -INF is greater than -INF, except that -INF == -INF
-
Any value added to or subtracted from +INF results in +INF
-
Any positive value multiplied by +/-INF results in +/-INF
-
Any value divided by +/-INF results in 0
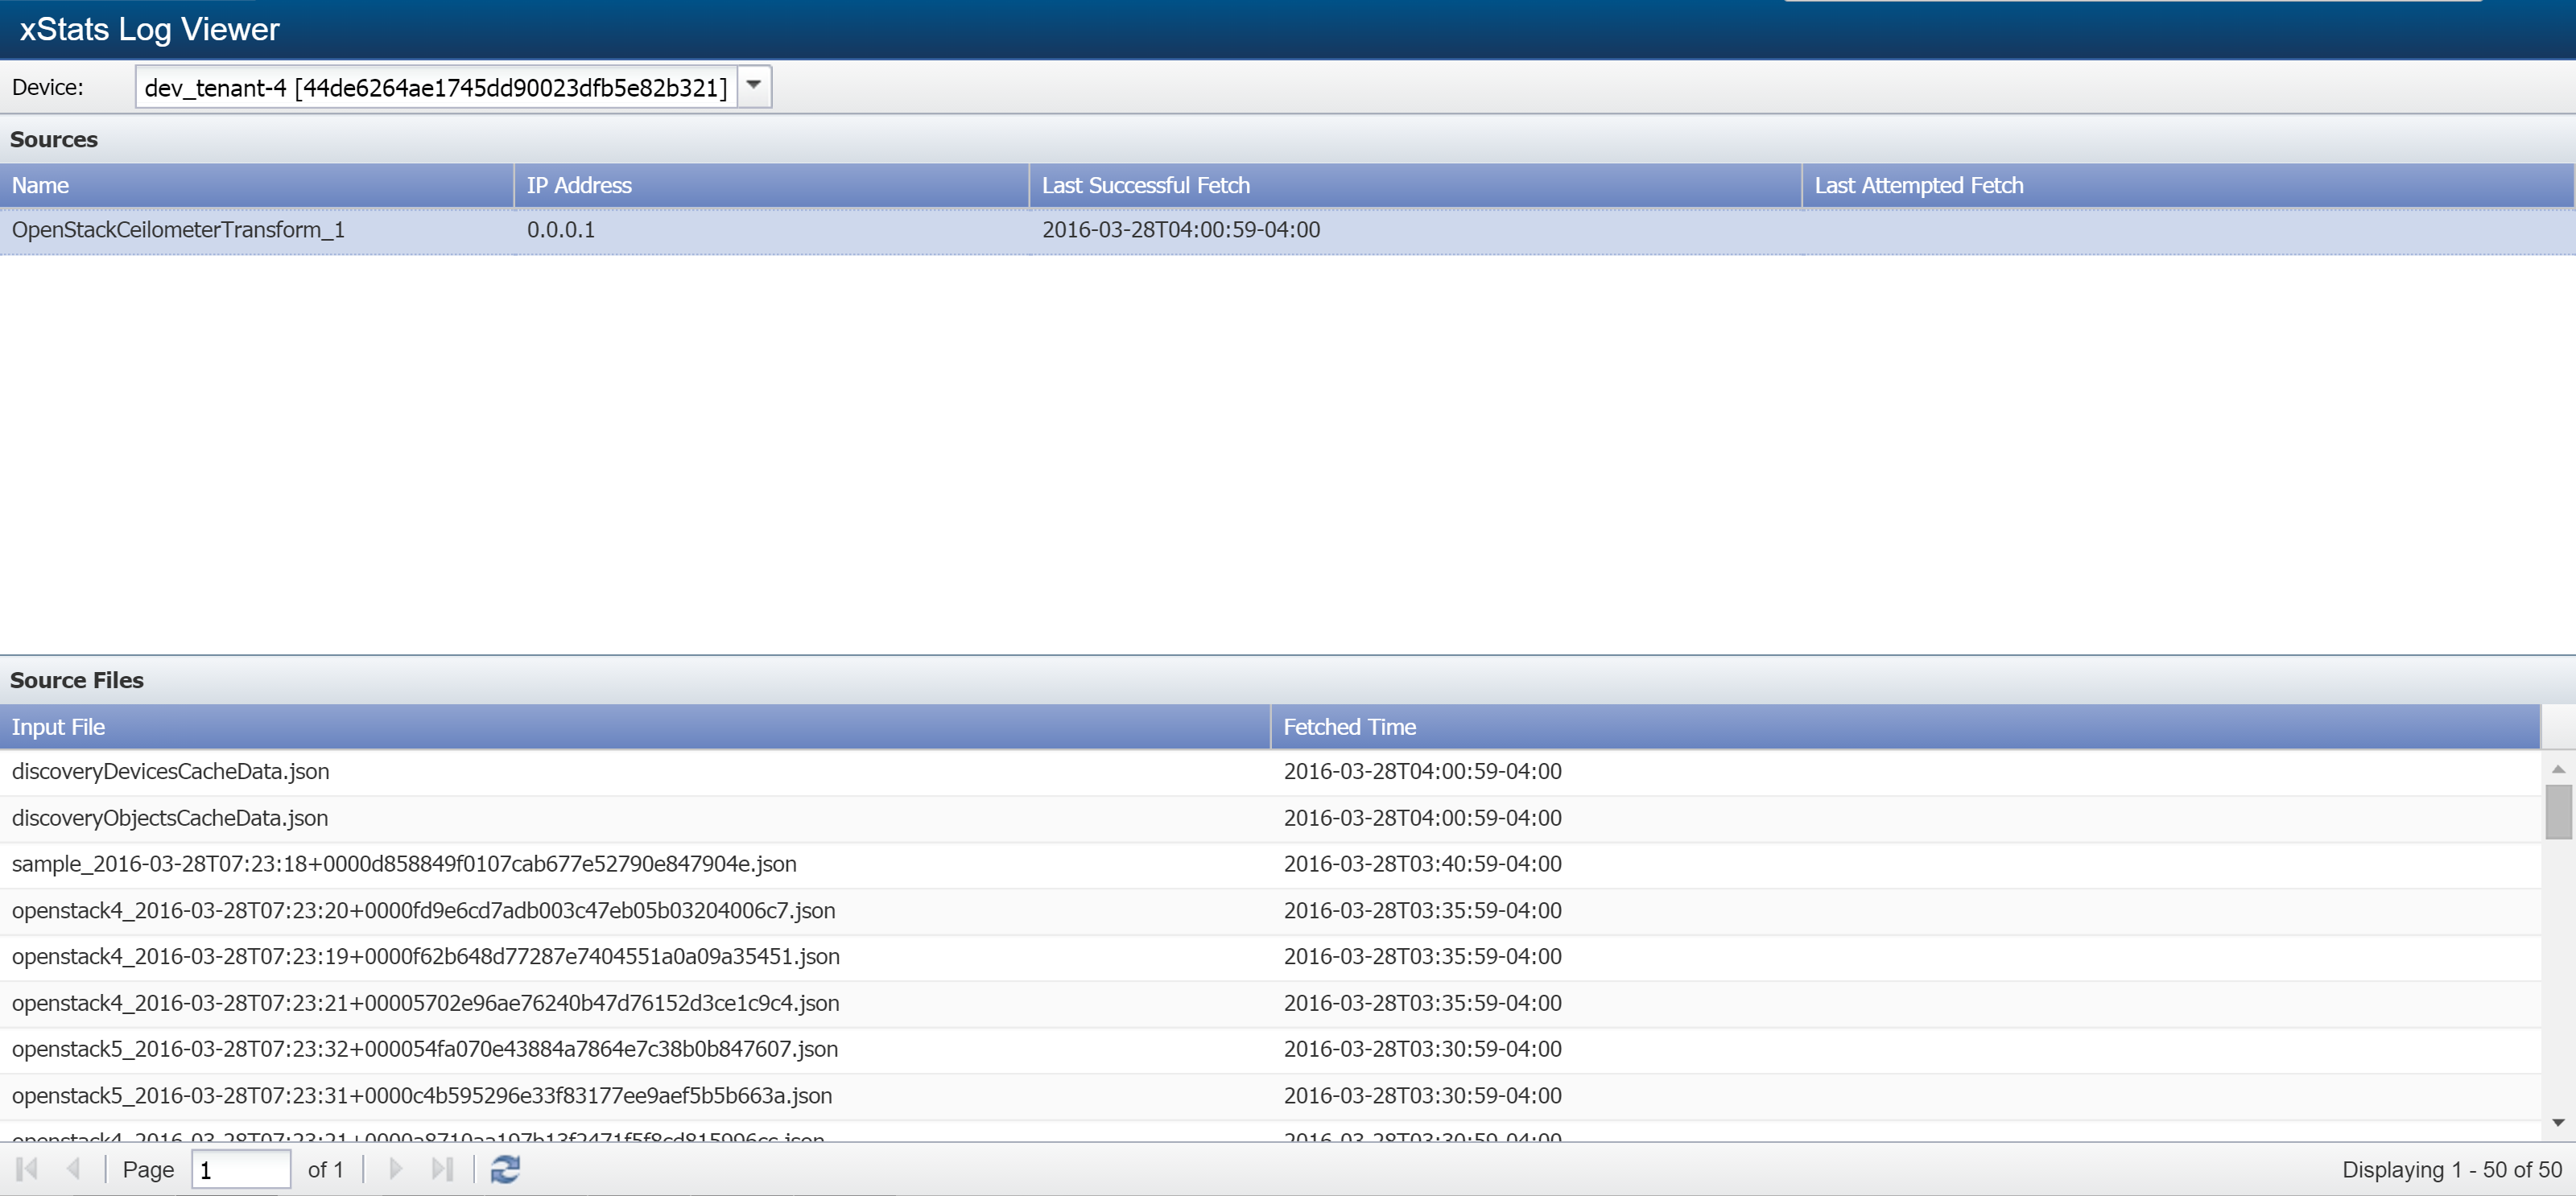
xStats Log Viewer
The xStats Log Viewer lets you look at additional details from the xStats Collection Sources that you define on the xStats Source Manager. Please refer to section xStats Collection Sources for details. xStats Collection Sources create the xStats devices, objects, and indicators for the xStats plugin to poll.
Perform the following steps to explore the xStats Log Viewer.
-
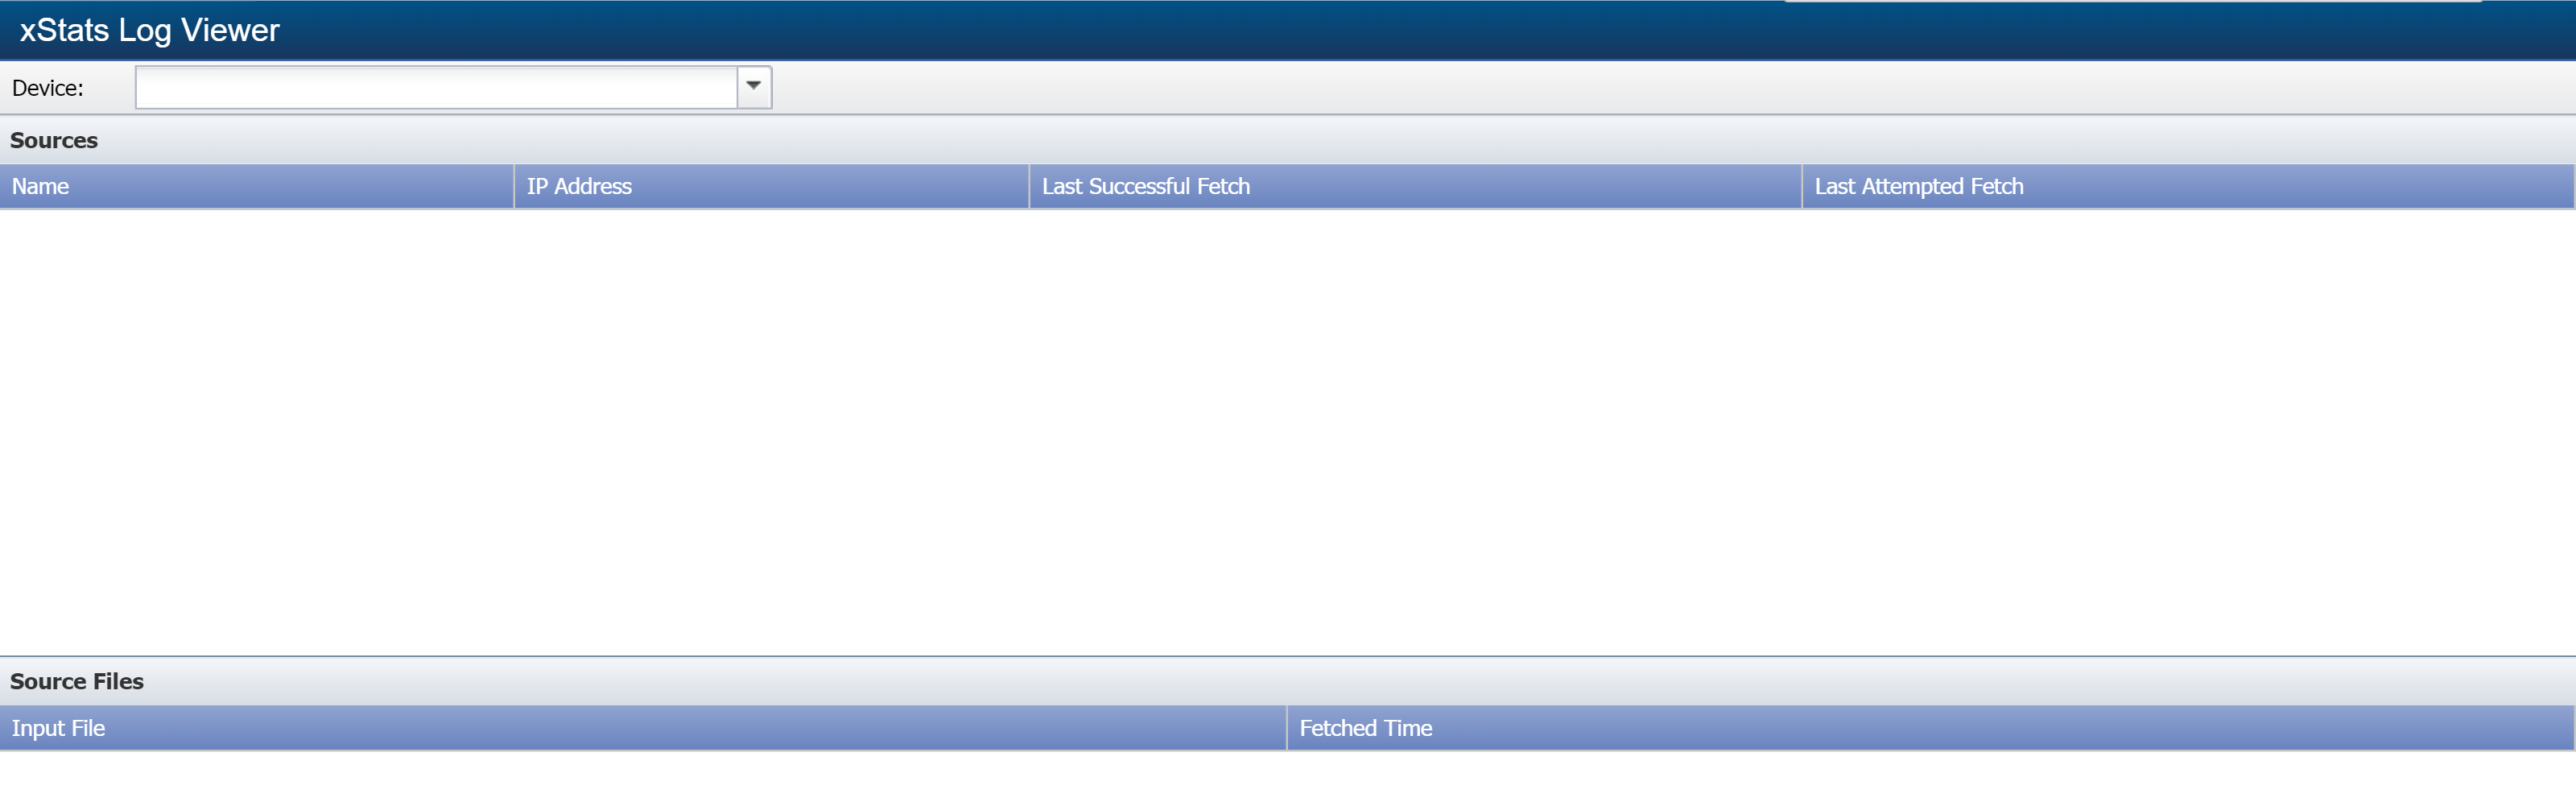
From the navigation bar, click Administration and select Monitoring Configuration, then xStats Log Viewer.
-
At the top of the page, click the Device drop-down and select a device.
-
The Sources section provides the following information for xStats Collection Sources.
-
Name - displays the xStats Collection Source name.
-
IP Address - displays the IP address of the device that the xStats Collection Source retrieves / receives xStats data from.
-
Last Successful Fetch - displays the date and time that the xStats Collection Source most recently performed a successful collection of xStats data.
-
Last Attempted Fetch - displays the date and time that the xStats Collection Source most recently attempted to fetch xStats data.
-
-
Now select the xStats Collection Source that you would like to view file information for.
-
The Source Files section provides the following information about the files for the xStats Collection Source that you selected.
-
Input File - displays the name of the file fetched / received by the xStats collection source.
-
Fetched Time - displays the time that the xStats Collection Source fetched the file.
-
Troubleshooting
Command 'SevOne-act xstats create-missing-types'
When ingestion pipeline receives a new device from an xStats message, it puts the object types, objects, indicator types, and indicators into their temporary tables, bulkdata_object_types_found, bulkdata_objects_found, bulkdata_indicator_types_found, and bulkdata_indicators_found.
The new device does not have objects and indicators before discovery is run on it.
When discovery is run on the device, it uses object types and indicator types to create objects and indicators. If there is any object or indicator without type, discovery is not able to create them.This is one of the common reasons for an xStats device with no object or indicator even after discovery is executed. When this happens, execute the following command to create the object types and indicator types.
SevOne-act xstats create-missing-types must be run on the peer where the device is located.
$ SevOne-act xstats create-missing-types$ SevOne-act xstats create-missing-typesArray( [success] => 1 [message] => Type information created successfully [IndicatorTypesCreated] => 20 [IndicatorTypesLinked] => 20 [ObjectTypesCreated] => 10 [ObjectTypesLinked] => 10)success: indicate the types are created successfully or not.success: The status of the type creation.IndicatorTypesCreated: The indicator types created in plugin_indicator_typeIndicatorTypesLinked: The indicator types linked between bulkdata_indicator_types_found and plugin_indicator_typeObjectTypesCreated: The object types created in plugin_object_typeObjectTypesLinked: The object types linked between bulkdata_object_types_found and plugin_object_typeThis command loops through bulkdata_object_types_found and bulkdata_indicator_types_found tables, and checks if there are any types not presented in plugin_object_type and plugin_indicator_type tables. Once the types are created, discovery can create new objects and indicators for the device.
Devices show up, but no objects appear for them
When objects fail to show up, it is often related to the discovery process. The following steps will walk you through the discovery process in SevOne NMS.
-
From the navigation bar, go to Devices > Device Manager.
-
Select the device(s) in question.
-
Click
and select Discovery > Discover.
-
Give Discovery a chance to run its course, then click
 to refresh the page. Objects should start showing up.
If you still do not see any objects, please contact SevOne Support for further help.
Objects and indicators show up for a device, but no data appears in the graphs
Sometimes when you run an xStats adapter for the first time, it can take a little bit of time for data to start showing up. Please follow these steps to determine why your data has not yet appeared.
-
Often this happens when there is a large number of data files, in which case it may take up to an hour before you start seeing data. If this is your first time to use your xStats adapter, try waiting a bit.
-
You can also use SevOne reporting to look over the past week in case any data has been inserted. It is possible that older data may have been picked up.
-
If your data still does not appear after waiting, you can check the collector logs to verify the status of the objects and indicators.
To debug the xStats adaptor, logs can be checked in the following location.
$/var/log/xstatsExample: For GenCSV, collector logs can be found in the following location$/var/log/xstats/GenericCSVTransform/$AdaptorNameTo debug the xStats pipeline, check the xStats daemon logs in the following location.
$/var/log/ingestion/ -
If you still cannot see your data, you can check the Retrieval Directory to verify that your files are being received. You can find the path for the Retrieval Directory in the Edit Source window.
-
If you are still not seeing any data, please contact SevOne Support for further help.
xStats adapter does not appear as a source type in the xStats Source Manager pop-up
If you do not see your xStats adapter in the Source Type field of the Edit Source or Add Source window (on the xStats Source Manager page), try clicking the SevOne refresh icon ![]() in the upper right corner of the page. Then open the Edit Source or Add Source window again and check to see whether your adapter appears in the in the Source Type field. If this does not make your adapter appear, verify that your adapter is installed and configured correctly. If you still do not see your adapter, please contact SevOne Support for further help.
in the upper right corner of the page. Then open the Edit Source or Add Source window again and check to see whether your adapter appears in the in the Source Type field. If this does not make your adapter appear, verify that your adapter is installed and configured correctly. If you still do not see your adapter, please contact SevOne Support for further help.
xStats Collection Source appears in the xStats Source Manager, but no devices are showing up
The xStats Collector is custom-made to pick up files periodically and bring them over to your SevOne NMS appliance. How often it collects files depends on your specifications. If you are not seeing any devices, please try the following steps.
-
If your collector is set up to run every thirty minutes, you may need to wait a little longer for devices to start showing up. If you still do not see any devices after that, click
to refresh the page.
-
If you have waited a while and nothing shows up, check that the information for your xStats Collection Source is correct. Please refer to section Add / Modify xStats Collection Source. If you make any changes, click
and wait a little longer to see if devices show up.
-
If you are using SFTP (rather than the local file system) as your source type, check that the device you specified (in the IP Address field of the xStats Collection Source) is powered on and working correctly. Again, if you make any changes, click
and wait.
-
If you still do not see any devices, verify that files are being received correctly by your Retrieval Directory. You can find the path for the Retrieval Directory in the Edit Source window.
-
If devices still fail to show up, take a moment to verify that your configuration is correct.
-
If you have tried all of these suggestions and you are still not seeing the devices, please contact SevOne Support for further help.
xStats data is not getting into the system
Below are some steps that will be helpful in narrowing down the location of the problem and solving it. First, it is good to understand the xStats pipeline so you can better evaluate where and when communication occurs.
SevOne-fcad
This is typically the first stage of the pipeline and will often be your first stop when checking logs during a troubleshooting session. This tool collects files from sources configured from the xStats Source Manager and spins up PHP processes to parse these files.
SevOne-dispatchd
As the second stage of the pipeline, dispatchd accepts the protocol buffer that defines a device, its objects, its indicators, and the timestamps at which those indicators have values. This tool then determines the device ID and peer of the given device. From there, it then dispatches the message to the appropriate peer for that device. If the device does not currently exist in SevOne NMS, a new device will be created by SevOne-dispatchd on the local peer, and the message will be forwarded.
SevOne-ingestion-resolved
This is the third stage of the xStats pipeline. This tool runs a query or fetches the cache from the ingest topic to retrieve object and indicator information of the received device. It then will search the backfill topic for information about the received device. Ingestion-resolved uses this information to locate object and indicator IDs. If an ID cannot be located, a new object or indicator will be created. Once finished, ingestion-resolved will populate this information to longterm tables.
SevOne-ocd
The ocd daemon communicates to Universal Collector only and does not use external information.
Is fcad retrieving files?
On the xStats Source Manager page, check that the Last Retrieval Time field is updating whenever new files are created in the retrieval directory.
Check the Logs
The first troubleshooting step is to check the logs for the various xStats daemons.
|
daemon |
Log Location |
|
SevOne-fcad |
|
|
SevOne-fcad parser |
|
|
SevOne-dispatchd |
|
|
SevOne-ingestion-resolved |
|
|
SevOne-ocd |
|
Common errors and their solutions
xStats-parsers: event_cb(): Kafka Event LOG-3-FAIL: ssl://localhost:9092/bootstrap: Receive failed: No errorThis is normal behavior. Messages like this can be safely ignored.
Jun 13 12:33:30 SevOne SevOne-ingestion-resolved: event_cb(): Kafka Event LOG--181-FAIL: ssl://127.0.0.1:9092/bootstrap: SSL handshake failed: s3_both.c:477: error:1408E0F4:SSL routines:SSL3_GET_MESSAGE:unexpected message: : client authentication might be required (see broker log)This error message means that the Kafka SSL certificate is corrupt. To resolve this issue, you must regenerate the Kafka SSL certificate. Please execute the following command to generate the certificate.
$ SevOne-act kafka gen-certsThis regenerates the keys and certificates in /etc/kafka. If you have your own keys, make sure to save them somewhere before running this command. There are various command line arguments to provide to this tool as well, such as validity time for the new keys / certificates, password, and CACertAlias. Run SevOne-act kafka gen-certs –help to see all of these options.
Is Kafka Running?
Kafka is the message bus introduced in SevOne NMS 5.6.0. It is used to pass messages through the pipeline without using the filesystem. Kafka also requires a daemon, Zookeeper, to run in order to work properly. If both of these are not running, then you will not receive messages. To test if Kafka is running, execute one of the following commands.
$ ps aux | grep kafkaServer-gc.log$ supervisorctl status kafkaYou can find the kafka server logs in /var/log/kafka-server/kafkaServer.out.
In the event that Kafka is not running, then execute the following command.
$ supervisorctl restart kafka
Execute one of the following commands to verify if Zookeeper is running.
$ ps aux | grep zookeeper-gc.log$ supervisorctl status zookeeperThe Zookeeper process logs to /var/log/kafka-server/zookeeper.out.
In the event that Zookeeper is not running, then execute the following command.
$ supervisorctl restart zookeeperWhen successfully running, /etc/init.d/kafka start and /etc/init.d/zookeeper start show processes running Java with a significant number of options and commands.
Are the Kafka SSL keys / certificates correct?
Execute the following command to verify if the SSL certificates are consistent across the cluster.
$ SevOne-act check kafka-ssl-certsIf there is a problem, you can rerun SevOne-act kafka gen-certs. This overwrites your existing certificates with new ones and deploys them across the cluster. Alternatively, you can deploy the keys manually by copying the contents of /etc/kafka/ from the leader to any troublesome peers.
Check the database
The logs are not always clear about what sort of problem you are seeing. In this case, you can instead use the database to narrow down how far along the pipeline you have gotten. xStats includes a number of tables which provide information about how far along in the xStats pipeline, a particular file has gotten.
-
local.bulkdata_fetched_files contains all files that SevOne-fcad has downloaded into its own directories. The filename is stored in the name column.
-
The source type and file processor must be linked correctly between the bulkdata_sources, bulkdata_source_types, and bulkdata_source_type_file_processor table.
Check the Kafka topics
Execute the following command to check how many topics are running on the box.
$ SevOne-act kafka lsThis will list all the topics and the number of partitions. This script communicates with Zookeeper so if it returns any error, Zookeeper may be in a trouble state.
If you receive the following message, then there is an issue with the hostname indicating that it is not using valid naming conventions.
Failed to parse SSL://HOSTNAME:PORT as endpoint
Kafka stores its messages on a variety of topics. It sends messages to and receives messages from these different topics. The distribution is as follows.
-
SevOne-fcad sends messages to the dispatch topic.
-
SevOne-dispatch receives messages from the dispatch topic, and sends messages to the ingest topic.
-
SevOne-ingestion-resolved receives messages from the ingest topic and optionally sends messages directly to SevOne-datad over ZMQ if it is shortterm data, or otherwise sends messages to the backfill topic.
You can check if data is going to a topic by tailing in /var/kafka/<topic name>-0 log file. For example, the dispatch topic log is in /var/kafka/dispatch-0/ and the ingestion-resolved topic log is in /var/kafka/ingest-0/. If these directories are not present, that means that data has never been sent to these topics. Directories are created as needed. There may be several *.log files in this directory because the last GB of data in each topic gets stored. ls -l helps you locate the most recently edited log file. With a tail -f on that file, you should see more data populated when messages are sent to that topic. The output will be in binary form just by tailing this log, but there are tools to help with this. SevOne NMS 5.7 or higher (and a later 5.6 service pack) uses the SevOne-kafka-inspector tool and all versions use the old SevOne-act kafka read script (which SevOne-kafka-inspector replaces).
Execute the following command to see the help for the Kafka inspector. This includes details on how to select topics, partitions, offsets, the format to use to decode the data, the ability to tail a topic and partition (automatically printing out any new messages), and more.
$ SevOne-kafka-inspector --helpAlternatively, you can execute a SevOne-act read script to read from a topic.
$ SevOne-act kafka readFor a full list of options, run SevOne-act kafka read --help. This available options are as follows.
|
Option |
Description |
|
-i, --ip |
(Optional) The kafka server we are trying to communicate with. Default: localhost |
|
-t, --topic |
(Required) The topic from which to read messages. |
|
-p, --partition |
(Optional) The partition of the topic from which to read messages. Default: 0 |
|
-o, --offset |
(Required) The offset from which to start reading messages. 0 is the beginning of the log, and the end can be anything up to infinity. To get the most recent offset written, you can cat the appropriate file in /var/SevOne/bulkd/<daemon>/<daemon>_partition_<partition>_offset.txt. Therefore, if you are using only one partition, you would use use partition 0 for this file. The contents of this file will just be one number, and that is the most recent offset from which the corresponding daemon read from this topic, successfully processed it, and sent it to the appropriate next stage in the data ingestion pipeline. Additionally, you can enter -2 if you want to read the first valid offset. |
|
-f, --format |
(Optional) The format of the message you wish to read. It can be human readable string or pure binary if you want to forward the message to other topics. Options: string, binary Default: string |
|
-d, --offset-file-dir |
(Optional) Keep the offset file of the next message under this path. The name of the file will be topicname_partition_x_thread_0_offset.txt. |
|
-t, --timeout |
(Optional) The timeout setting for receiving message. This duration is set in ms. Default: 5000 |
|
-m, --message-type |
(Optional) The type of message you want to read. If you want to output human readable strings, you must specify what type of message you are receiving. Options: datad, device_event, object_rule_event, xstats, metric. This is optional when you use a binary format. |
Check the messages
Sometimes you may need to verify the current status of the the xStats daemons. In this case, you can check the following topics for information about the following daemons.
|
Daemon |
Kafka Topic |
|
SevOne-dispatchd |
dispatchd_metrics |
|
SevOne-ingestion-resolved |
ingestion_resolved_metrics |
You can also read from these topics by entering the following command.
$ SevOne-act kafka read -t <topic> -m metric -o <offset> The metrics displayed are logged by default every 5 minutes, and they indicate the time since the previously displayed metrics.
These messages also display when running the daemons verbosely. There are a number of different messages as well as a count, sum, minimum, maximum, standard deviation and mean value for all of them.
Dispatchd Statistics
|
Message Name |
Description |
|
device_peer_cache_invalidate_nanos |
The time in nanoseconds spent invalidating the device-id-to-peer-id cache. |
|
peer_id_resolution_nanos |
The time in nanoseconds spent resolving the peer id via MySQL query. |
|
peer_id_cache_nanos |
The time in nanoseconds spent resolving the peer id via cache. |
|
cached_device_id_nanos |
The time in nanoseconds spent resolving the device id via cache for an xStats device (device with a Source ID). |
|
nosource_device_id_resolution_nanos |
The time in nanoseconds spent resolving the device id via cache for a non-xStats device (device without a Source ID). |
|
pipeline_delay_micros |
The time in microseconds between when the message was originally created, and when SevOne-dispatchd began processing it. |
|
mysql_device_foc_nanos |
The time in nanoseconds spent finding or creating a device via MySQL query. |
|
nosource_device_cache_invalidate_nanos |
The time in nanoseconds spent invalidating the cache of non-xStats devices (devices without a Source ID). |
|
dispatched_message_bytes |
The size in bytes of the message being sent. |
|
protobuf_parse_nanos |
The time in nanoseconds spent parsing the protobuf that was received. |
|
sourced_device_cache_invalidate_nanos |
The time in nanoseconds spent invalidating the cache of xStats device (devices with a Source ID). |
Ingestion Resolved instead uses a set of SNMP OIDs. Similar to metric topics, these can be used to internally monitor your process while being easier to access.
Ingestion Resolved SNMP OIDs
|
Name |
OID |
Meaning |
|
ingestThreadCount |
.1.3.6.1.4.1.27207.3.1.2.8.1.1 |
The number of threads available for processing ingest tasks. |
|
ingestThreadsActive |
.1.3.6.1.4.1.27207.3.1.2.8.1.2 |
The number of ingest threads currently in use. |
|
ingestThreadsIdle |
.1.3.6.1.4.1.27207.3.1.2.8.1.3 |
The number of ingest threads ready for processing. |
|
ingestTasksPending |
.1.3.6.1.4.1.27207.3.1.2.8.1.4 |
The number of ingest messages parsed but not yet finished processing. |
|
backfillThreadCount |
.1.3.6.1.4.1.27207.3.1.2.8.1.5 |
The number of backfill threads available for processing backfill tasks. |
|
backfillThreadsActive |
.1.3.6.1.4.1.27207.3.1.2.8.1.6 |
The number of backfill threads currently in use. |
|
backfillThreadsIdle |
.1.3.6.1.4.1.27207.3.1.2.8.1.7 |
The number of backfill threads ready for processing. |
|
backfillTasksPending |
.1.3.6.1.4.1.27207.3.1.2.8.1.8 |
The number of backfill messages parsed but not yet finished processing. |
|
backfillRowsQueued |
.1.3.6.1.4.1.27207.3.1.2.8.1.9 |
The number of object data points parsed but not yet finished processing. |
|
backfillQueriesQueued |
.1.3.6.1.4.1.27207.3.1.2.8.1.10 |
The number of MySQL longterm queries that are queued to be executed. |
Additional strategies for debugging Kafka topics
SevOne-verify-data
This is an intense check to see if data is actually presented in the database. This checks the database for the provided list of poll points and report those points as found or missing. For how to setup and run SevOne-verify-data, please check the related page at SevOne-verify-data. This tool hits the database in a high frequency manner, so it may affect overall system performance.
The result of SevOne-verify-data can be categorized into the following.
-
LONGTERM_HIT means the data point is found in the longterm database.
-
SHORTTERM_HIT means the data point is found in the shortterm database.
-
RESOLVE_ERROR means that SevOne-verify-data cannot resolve the object id or indicator id from the data points provided. This may happen when the link between the object or indicator_found table and the device_object or indicator is broken, making it unable to resolve the ids. This can also happen if the object or the indicator is a new object or indicator but discovery has not run yet. When this happens, the object or indicator is not yet inserted into database, so they cannot be resolved.
-
MISSING means the data point cannot be found in database. However, missing data points do not necessarily mean something is broken. There are still some cases where data points are expected to be missing.
-
The object is disabled or deleted. If an object is disabled, the data may still reach shortterm database, but the updater will ignore it so nothing can reach longterm. If an object is deleted, the historical data will also get deleted as well. An object can get disabled or deleted when it has not received anything for a while. The setting can be found in Cluster Manager > Cluster Settings > Discovery. To check if an object has been disabled before, check the device.d[device_id]_log table. This table contains historical discovery information for the specific device.
-
If an object or indicator is new and has not processed by discovery yet, the object or indicator will not receive any data. Discovery runs everyday at around 3 in the morning, so if xStats receives a new object before the end of a day, it is certain that the object will miss one day of data.
-
The timestamp presented in the source file is not correct. There are rare cases where the data provided may contain future timestamps. SevOne NMS cannot process future data, so in this case, missing future data may be considered an expected behavior.
If none of the above cases apply and there are still some missing data points, grab those data points and find them from the source files. Then, check the files and see if there are any errors in the xStats pipeline.
backfill_commit_interval
This hidden database setting determines the interval at which backfill messages will be flushed to the longterm database. Until flushed, they will exist in the memory of SevOne-ingestion-resolved and will not be available for reporting. As such, increasing this value has a disadvantage of delaying backfill messages by extra time. However, a larger interval implies that more data is batched together rather than being inserted row by row, dramatically increasing performance. The default value for this is 1800 seconds.
Longterm messages have the capability to be inserted in batches and the commit interval is customizable. Insert queries on disk tables are much more efficient when batched together, although there may be some extra delay. For example, in the presence of a large backlog of backfill messages, the process will wait for the duration set by backfill_commit_interval, holding data points in memory, and then run one query per object. This differs from the old process of inserting data as soon as it is seen, row-by-row. This can dramatically reduce the amount of required queries.
backfill_failsafe_commit
This hidden database setting, if enabled, protects against message loss in case of a crash or failure at the expense of a small amount of performance. Specifically, this setting causes the daemon to wait until messages are finished processing before updating the Kafka offset files. This means that in the event of a crash, messages in transit will be re-read from the Kafka topic the next time the daemon runs. When set to 0, the offset will be updated as soon as the message is fetched from Kafka. The default value for this is enabled (1).
Verify Source Files / Parser
To verify the validity of the source files or the parser or the configuration, execute the following command to see the options available. This command is useful for troubleshooting as it can show you what was emitted, the device and object it should belong to, timestamp, etc. On failure it can also provide the last entries in the parser log for the source.
$ php /opt/sevone-xstats/<xStats adapter>/bin/console.php --help$ php /opt/sevone-xstats/GenericCSVTransform/bin/console.php show-parsing-errors --sourceId 1 --verbose --file /opt/sevone-xstats/GenericCSVTransform/sources/source_1/data/Sep_12-07\:05.csv.1763.csvwhere sourceId is the id of the source, options verbose and file are optional. If the file is not specified, it will try to parse all the files in the source directory.
The result of a successful parse looks as follows.
Parsing file </opt/sevone-xstats/GenericCSVTransform/sources/source_1/data/Sep_12-07:05.csv.1763.csv>Start Parsing... ************************************************Parsing file </opt/sevone-xstats/GenericCSVTransform/sources/source_1/data/Sep_12-07:05.csv.1763.csv>: emitDevice(SpeedTest, SpeedTest) useDevice(SpeedTest) emitObject(Houston, TX-Comcast:1763, SpeedT, SpeedT-Class) useObject(Houston, TX-Comcast:1763) useTimestamp(1568272200) emit(dist, 2100.8851811969) emit(ping, 53.723) emit(down, 93636877.377548) emit(up, 40021040.756436) emit(serv, 1763).--------------------------------------------------------------------------------Total of 1 data files were parsed.Total execution: 0 seconds--------------------------------------------------------------------------------Total objects emitted: 1Objects per second: 1Total emits: 5--------------------------------------------------------------------------------DoneTerms
|
Collector |
In the context of xStats, a script that collects third-party, time-stamped data from a remote device (or EMS). |
|
Parser |
In the context of xStats, a script that reads third-party, time-stamped data input files, then transforms the data for use in SevOne NMS. |
|
xStats Adapter |
A component responsible for retrieving third-party, time-stamped data from a remote device, then reading and transforming the data. The xStats adapter includes a collector and a parser. |
|
xStats Plugin |
A mechanism in SevOne NMS that uses some retrieval method, such as FTP, SFTP, etc., to collect files containing statistical data. The xStats plugin brings third-party, time-stamped data into SevOne NMS after the data has been collected and processed by the xStats adapter. |