Table of Contents (Start)
- Topics
- Introducing SevOne
- Login
- Startup Wizard
- Dashboard
- Global Search - Advanced Search
- Report Manager
- Report Attachment Wizard
- Report Properties
- Report Interactions
- Instant Graphs
- TopN Reports
- Alerts
- Alert Archives
- Alert Summary
- Instant Status
- Status Map Manager
- Edit Maps
- View Maps
- FlowFalcon Reports
- NBAR Reports
- Logged Traps
- Unknown Traps
- Trap Event Editor
- Trap Destinations
- Trap Destination Associations
- Policy Browser
- Create and Edit Policies
- Webhook Definition Manager
- Threshold Browser
- Create and Edit Thresholds
- Probe Manager
- Discovery Manager
- Device Manager
- New Device
- Edit Device
- Object Manager
- High Frequency Poller
- Device Summary
- Device Mover
- Device Groups
- Object Groups
- Object Summary
- Object Rules
- VMware Browser
- AWS Plugin
- Azure Plugin (Public Preview)
- Calculation Plugin
- Database Manager
- Deferred Data Plugin
- DNS Plugin
- HTTP Plugin
- ICMP Plugin
- IP SLA Plugin
- JMX Plugin
- NAM
- NBAR Plugin
- Portshaker Plugin
- Process Plugin
- Proxy Ping Plugin
- SDWAN Plugin
- SNMP Plugin
- VMware Plugin
- Web Status Plugin
- WMI Plugin
- xStats Plugin
- Indicator Type Maps
- Device Types
- Object Types
- Object Subtype Manager
- Calculation Editor
- xStats Source Manager
- User Role Manager
- User Manager
- Session Manager
- Authentication Settings
- Preferences
- Cluster Manager
- Maintenance Windows
- Processes and Logs
- Metadata Schema
- Baseline Manager
- FlowFalcon View Editor
- Map Flow Objects
- FlowFalcon Views
- Flow Rules
- Flow Interface Manager
- MPLS Flow Mapping
- Network Segment Manager
- Flow Protocols and Services
- xStats Log Viewer
- SNMP Walk
- SNMP OID Browser
- MIB Manager
- Work Hours
- Administrative Messages
- Enable Flow Technologies
- Enable JMX
- Enable NBAR
- Enable SNMP
- Enable Web Status
- Enable WMI
- IP SLA
- SNMP
- SevOne Data Publisher
- Quality of Service
- Perl Regular Expressions
- Trap Revisions
- Integrate SevOne NMS With Other Applications
- Email Tips and Tricks
- SevOne NMS PHP Statistics
- SevOne NMS Usage Statistics
- Glossary and Concepts
- Map Flow Devices
- Trap v3 Receiver
- Guides
- Quick Start Guides
- AWS Quick Start Guide
- Azure Quick Start Guide (Public Preview)
- Data Miner Quick Start Guide
- Flow Quick Start Guide
- Group Aggregated Indicators Quick Start Guide
- IP SLA Quick Start Guide
- JMX Quick Start Guide
- Metadata Quick Start Guide
- RESTful API Quick Start Guide
- Self-monitoring Quick Start Guide
- SevOne NMS Admin Notifications Quick Start Guide
- SNMP Quick Start Guide
- Synthetic Indicator Types Quick Start Guide
- Topology Quick Start Guide
- VMware Quick Start Guide
- Web Status Quick Start Guide
- WMI Quick Start Guide
- xStats Quick Start Guide
- xStats Adapter - Accedian Vision EMS (TM) Quick Start Guide
- Deployment Guides
- Automated Build / Rebuild (Customer) Instructions
- Generate a Self-Signed Certificate or a Certificate Signing Request
- SevOne Best Practices Guide - Cluster, Peer, and HSA
- SevOne Data Platform Security Guide
- SevOne NMS Implementation Guide
- SevOne NMS Installation Guide - Virtual Appliance
- SevOne NMS Advanced Network Configuration Guide
- SevOne NMS Installation Guide
- SevOne NMS Port Number Requirements Guide
- SevOne NMS Upgrade Process Guide
- SevOne Physical Appliance Pre-Build BIOS and RAID Configuration Guide
- SevOne SAML Single Sign-On Setup Guide
- Cloud Platforms
- Other Guides
- Quick Start Guides
FlowFalcon Reports
FlowFalcon reports enable you to monitor and report on flow technologies. SevOne NMS handles virtually all flow technologies. Flow technologies monitor data in layers 2 through 4 to provide visual details of over or under utilization of a network resource, application traffic, and port conversation activity. FlowFalcon reports display flow data from any router, switch, firewall, etc. that you enable to export flow data.
To access the FlowFalcon Reports page from the navigation bar, click the Applications menu and select FlowFalcon Reports.
For details, please refer to section Enable Flow Technologies in SevOne NMS System Administration Guide on how to enable routers to send flow data to SevOne NMS.
Suggested Prerequisites
The default FlowFalcon Reports page settings enable you to create a FlowFalcon report in two clicks. See the FlowFalcon Report Interactions section later in this chapter for direction to run FlowFalcon reports and how to manipulate reports after you get results.
To monitor your network's specific flow parameters, there are several prerequisites that you should consider.
-
The New Device page and the Edit Device page enable you to configure the SNMP plugin for devices that send flow data. SNMP is not required but if you omit this step, the FlowFalcon report provides less descriptive information because the name of the device and its interfaces are not resolved. To enable a Cisco NAM device to send response time data to the FlowFalcon Reports page, select the Monitor NAM Data check box on the Edit Device page and configure NAM settings.
-
The Cluster Manager enables you to define FlowFalcon settings including the port number where SevOne NMS listens for flow data.
-
The FlowFalcon View Editor enables you to manage the flow template fields devices send to SevOne NMS and to include the flow template field data in the FlowFalcon views you use to create FlowFalcon reports.
-
The Object Mapping page enables you to map poll data from an abject polled by any plugin to a flow interface and to define the FlowFalcon report to generate from the NetFlow button that appears on the Instant Graphs page for the objects you map to flow data.
-
The Flow Protocols and Services page enables you to edit or define new protocols or services from which to collect flow data.
-
The Flow Interface Manager enables you to manage which flows to process.
-
The Flow Rules page enables you to define rules to process flow data based on device and interface.
-
The MPLS Flow Mapping page enables you to upload your network's mapping files to map MPLS attributes to flow data. This enables the presentation of MPLS data in FlowFalcon reports.
-
The Network Segment Manager enables you to group flows from a network segment to identify traffic that comes from different areas in your network.
FlowFalcon Report Settings
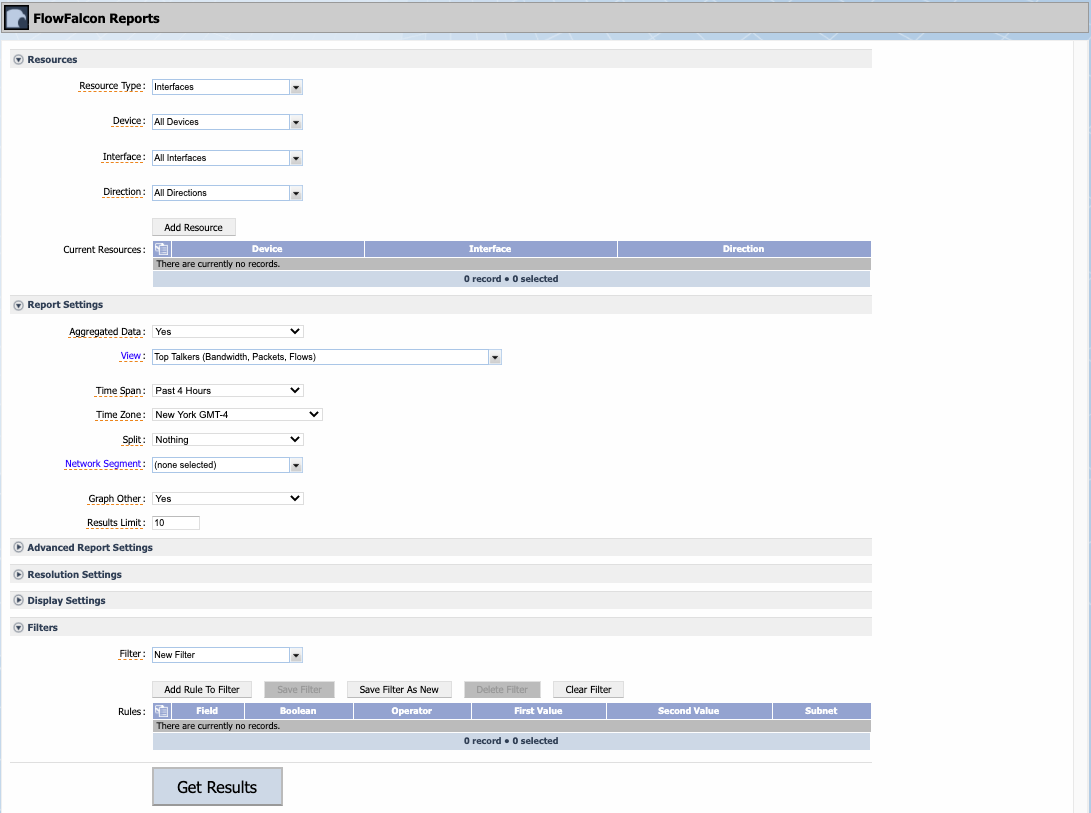
The FlowFalcon Reports page provides several sections of settings that enable you to define the data to appear in the FlowFalcon report. Each FlowFalcon report displays a stacked line graph, a pie chart, and a table of flow data. Some flow sources only provide incoming data. SevOne NMS uses flow data collected from other interfaces to determine the outgoing data. The more interfaces that export flow data on a device, the more accurate the determination.
Resources
The Resources section enables you to select the interfaces, device groups/device types, or object groups from which to present a FlowFalcon report. You cannot select a redundant resource.
-
Click the Resource Type drop-down.
-
Select Interfaces to create a report for flow data from the interfaces you allow on the Flow Interface Manager.
-
Click the Device drop-down and select a device. Select All Devices to define the report to contain all devices.
-
Click the Interface drop-down and select an interface. Select All Interfaces to define the report to contain all interfaces on the device you select.
-
Click the Direction drop-down and select whether to define the report to display the Incoming, Outgoing, or All Directions traffic.
-
-
Select Device Groups, then click the Device Group drop-down and select a device group/device type. Select All Device Groups to define the report to contain all device groups/device types.
-
Select Object Groups, then click the Object Group drop-down and select an object group.
-
-
Click Add Resource to add the device, interface, and direction to the Current Resources list.
-
Repeat to add additional resources.
Report Settings
The Report Settings section enables you to select the view and to define the report settings for the report. FlowFalcon views enable you to define the flow template fields to display in the report. SevOne NMS provides starter set FlowFalcon views to enable you to create common FlowFalcon reports
-
Click the Aggregated Data drop-down.
-
Select Yes to populate the View drop-down list with views that use aggregated flow data which stores the most relevant flow data for faster report creation.
When you create a TopN flow report (e.g., Top Talkers) based on aggregated data, the report will not be entirely precise. You can increase the value for the Aggregation TopN setting from Cluster Manager > Cluster Settings tab > FlowFalcon subtab for greater precision. However, any value greater than 100 will increase the system load, which may eventually lead to data loss.
-
Select No to populate the View drop-down list with views that use raw flow data to allow for more specificity in the result set at the trade off of longer report execution times and less historical data availability.
-
-
Click the View drop-down and select a view. The list of views is dependent on the selection you make from the Aggregated Data drop-down. Please refer to topic FlowFalcon Views to view the list of FlowFalcon views. If you do not see an applicable view, the View field caption provides access to the FlowFalcon View Editor where you can create custom views.
-
Click the Time Span drop-down.
-
Select Today to display data from 12:00am today until now.
-
Select Past <X> Hours, Days, Weeks to display data from <X> hours, days, or weeks ago until now.
-
Select Yesterday to display data from 12:00am yesterday until 12:00am today.
-
Select This Week, Month, Quarter to display data from 12:00am on the first day of the week, month, or quarter until now.
-
Select Last Week, Month, Quarter to display data from 12:00am on the first day of the last completed week, month, or quarter to 11:59pm on the last day of the last completed week, month, or quarter.
-
Select Custom to display the Choose a Time Range pop-up that enables you to define a custom time span.
-
-
Click the Time Zone drop-down and select a time zone.
-
Click the Split drop-down.
-
Select Nothing to combine all results from the same direction across the same interface to allow for greater detail in the result set.
-
Select Interfaces to separate flow data into individual interfaces.
-
Select Groups to separate flow data by device group/device type or object group depending on the resource you select. This option appears when you select Device Groups or Object Groups in the Resource section.
-
-
Click the Network Segment drop-down and select a network segment. This enables you to resolve IP addresses into segments and to roll up results from the same segment into a single result. The Network Segment field caption link provides access to the Network Segment Manager where you manage network segments.
-
Click the Graph Other drop-down.
-
Select Yes to display flow data for the top <n> results individually in the pie chart and the stacked line graph plus a Remaining Traffic graph item that groups the flow for the remaining flow sources that meet your filter criteria. You define <n> results in the next step.
-
Select No to display only the top <n> results in the pie chart and the stacked line graph. Remaining Traffic continues to display in the table.
-
-
In the Results Limit field, enter the number of individual results to display in the table. The display includes the first 200 results to optimize browser performance. Export the report to a .csv format or to a .pdf format to view the full result set of more than 200 results. Filters enable you to narrow the scope of the request (see the Filters section below). You can also modify the Current Resources list to limit the number of resources in the report (see the Resources section above).
Advanced Report Settings
FlowFalcon reports display a table of flow data that can include a variety of information that describe the flows. The Advanced Report Settings section enables you to select the data columns to include in the FlowFalcon report table.
-
Click
 Advanced Report Settings to display the advanced report settings controls.
 -
In the Data Columns field, select the check box for each data column to include in the report table. You must select the check box for at least one data column. All columns are described at the end of this chapter.
-
Click the Sort Column drop-down and select the data column on which to sort the table in the FlowFalcon report. This drop-down list displays the data columns you select in the previous step. The data column you select in this step determines the data to display in the pie chart and the stacked line graph in the FlowFalcon report.
-
Click the Sort Order drop-down and select to sort data in either Ascending or Descending order.
Resolution Settings
The Resolution Settings section enables you to define domain name resolution settings.
-
Click
Resolution Settings to display the resolution settings controls. -
Click the Application ID drop-down.
-
Select Display Octet Array to display the application id as a hexadecimal number.
-
Select Display Name to display the application name.
-
Select Display Both to display both the application id and application name.
-
-
Click the AS drop-down.
-
Select Display Number to display AS port numbers.
-
Select Display Name to display AS port names.
-
Select Display Both to display both numbers and resolved names.
-
-
Click the Country drop-down.
-
Select Display Code to display the country code.
-
Select Display Name to display the country name.
-
Select Display Both to display both, the country code and country name .
If the country cannot be determined from the flow, the report will return ?? in the appropriate country columns.
-
-
Click the DNS drop-down.
-
Select Display IP to display raw IP addresses.
-
Select Display DNS to display resolved domain names when possible.
-
Select Display Both to display both IP addresses and resolved domain names.
-
-
Click the DSCP drop-down.
-
Select Display Number to display DSCP port numbers.
-
Select Display Name to display DSCP port names.
-
Select Display Both to display both numbers and resolved names.
-
-
Click the Port drop-down.
-
Select Display Number to display raw port numbers.
-
Select Display Name to display resolved port names.
-
Select Display Both to display both numbers and resolved names.
-
-
Click the Protocol drop-down.
-
Select Display Number to display raw protocol numbers.
-
Select Display Name to display resolved protocol names.
-
Select Display Both to display both numbers and resolved names.
-
-
Click the Service Profile drop-down.
-
Select Display Number to display service profile ids.
-
Select Display Name to display service profile names.
-
Select Display Both to display both ids and resolved names.
FlowFalcon Resolution can also be set from Reports > Create Report > select source, FlowFalcon > in the left-navigation bar, select Settings > FlowFalcon Resolution tab > field Display Service Profile.
-
-
Click the Service Category drop-down.
-
Select Display Number to display service category ids.
-
Select Display Name to display service category names.
-
Select Display Both to display both ids and resolved names.
FlowFalcon Resolution can also be set from Reports > Create Report > select source, FlowFalcon > in the left-navigation bar, select Settings > FlowFalcon Resolution tab > field Display Service Category.
-
-
Each Service Profile only belongs to one Service Category. It can be assigned to category OOTB (which includes other) or it can be assigned to a custom category.
-
If a flow is unidentifiable as a service, Service Profile is set to no service and Service Category is set to no category.
-
Both Service Profile and Service Category fields are added during collection of the data. If the user modifies Service Profile / Service Category definitions, the historical data does not change.
Display Settings
The Display Settings section enables you to define display settings.
-
Click
Display Settings to display the display settings controls. -
Click the Granularity drop-down and select the interval between data points in the results. SevOne NMS is optimized to receive flows every one minute. If you configure the router to send flows at a different interval, this setting enables you to view the report at the granularity that matches the router flow timeout setting. A router flow cache setting other than one minute is not recommended.
-
Select Auto to use the highest applicable granularity for the best display and fastest load time based on the time span you select.
-
Select a predefined interval.
-
Select Custom to enter a custom granularity. There is no limit to this value, but if the granularity is too small for the time span, SevOne NMS adjusts the granularity.
-
-
Click the Preferred Units drop-down and select Bits for network oriented data or select Bytes for server oriented data.
-
Click the Display as drop-down and select Total to display the results as total volume or select Average Rate to display the results as rate or select Both to display the results as total volume and rate.
Filters
The Filters section enables you to limit the results that appear in the report. Each filter contains one or more rules to specifically address what is to be included in the report. Each filter rule applies to a specific flow field. Filter rules for a field that is not in the view are ignored. This enables you to define filters independently from views.
When you apply a filter to a FlowFalcon report that uses aggregated data, the Other Traffic and Total Traffic numbers may appear inaccurate due to how the data is aggregated and stored in pre-calculated buckets. If you do not receive the expected number of results after you apply a filter to an aggregated view, increase the number of aggregated results to store for each write interval on the Cluster Manager > Cluster Settings tab > FlowFalcon subtab > field Aggregation TopN.
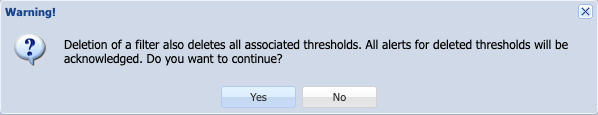
To delete a filter, click the Filter drop-down and select the filter to delete. The rules list displays the rules for the filter you select. Click Delete Filter to delete the filter. You will get the following warning message. Click Yes to continue with the deletion; it will delete all thresholds associated with this filter and all alerts for deleted thresholds will be acknowledged. Click No to cancel.
The filter Boolean expression works such that for each unique field, SevOne NMS creates a Boolean expression that consists of the negative rules and the positive rules. The negative rules are AND'd to form a sub-expression and the positive rules are OR'd to form a sub-expression. These sub-expressions are then AND'd to form the final expression for each unique field. Then, each unique field's composite expression is AND'd to other field expressions.
New Filter
Perform the following steps to add a new filter.
-
Click the Filter drop-down and select a filter to copy or select New Filter.
-
Above the Rules list, click Add Rule to Filter to display the Add New Rule to the Filter pop-up.
-
On the pop-up, click the Field drop-down and select the field on which to define the rule. Fields that are in the view you select appear first in the drop-down list followed by all known fields from the flow data.
-
Click the Boolean drop-down and select Is to define the rule with the IS logic or select Is Not to define the rule with the IS NOT logic. For each filter, a data row displays in the report if allowed by all IS NOT rules and any IS rule (if existent).
-
Click the Operator drop-down and select a comparison operator.
-
Mask - Flow data must match in the manner of IP address subnet mask.
-
Subnet - Flow data must be from the network segment you select from the Network Segment drop-down. You define network segments on the Network Segment Manager.
-
-
In the Value field, enter the filter value.
-
Complete the AND field and the Subnet field when applicable.
-
Click Save to save the rule.
-
Repeat these steps to add multiple rules to the filter.
-
After you add all rules to the new filter, click Save Filter as New above the rules list to display the Specify a Name for This Filter pop-up.
-
In the Filter Name field, enter the name of the new filter.
-
Click Save to save the new filter. The new filter now appears in the Filter drop-down list.
Edit Filter
If you modify a filter when you edit a FlowFalcon report and you save the report before you save the filter, you create a new filter for that specific report with the current list of rules. This enables you to modify a filter for a specific report without altering the original filter.
However, if you modify a filter and you save the filter before you save the report, you update the filter and you update any other existing uses of that filter.
In other words:
-
If you edit a FlowFalcon report and click Save Filter, you save the changes to the original filter.
-
If you do not click Save Filter, you copy the changes to a new filter that is specific to the report.
Perform the following steps to edit a filter.
-
Click the Filter drop-down and select the filter to edit.
-
Click Add Filter Item to display the Add New Rule to the Filter pop-up.
-
Click the Field drop-down and select a field.
-
Click the Boolean drop-down and select Is or select Is Not.
-
Click the Operator drop-down and select a comparison operator.
-
Edit the Value, And, and Subnet fields as needed.
-
Click Save on the Add New Rule to Filter pop-up to save the rule.
-
Click
 to delete the rules you select from the list.
 -
After you edit the list of rules, click one of the following buttons above the rules list.
-
Click Save Filter as New to create a new filter without overwriting the filter you select from the Filter drop-down list. The Specify a Name for This Filter pop-up appears to enable you to enter the name for the new filter.
-
Click Save Filter to overwrite the filter you select from the Filter drop-down with the updates you make to the filter.
-
FlowFalcon Report Interactions
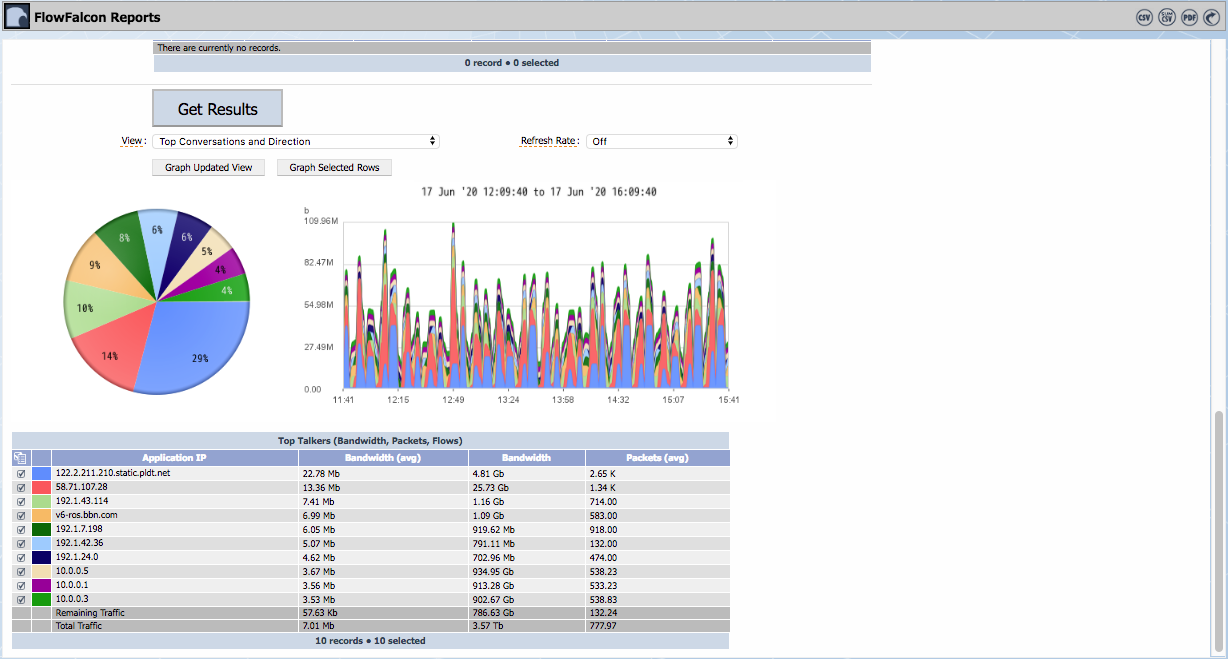
A FlowFalcon report displays a pie chart, a stacked line graph, and a table. The pie chart and the stacked line graph display up to 16 colors to represent the top 16 results for the data you select as the Sort Column in the Advanced Report Settings section. The table displays up to 200 results. Detach the report to a .csv format or .pdf format to display more than 200 results. The following sections provide instructions for how to get FlowFalcon report results and how to manipulate and navigate the report to display the exact data you need.
Get Report Results
You can get a FlowFalcon report using the default FlowFalcon Reports page settings in two clicks. To get specific FlowFalcon report results, you can either perform the steps in the Define FlowFalcon Reports section before you run the report or you can run the report and then adjust settings to get specific information.
-
At the top of the FlowFalcon Reports page, the Resources section displays All Devices, All Interfaces, and All Directions. Click Add Resource to add all devices, all interfaces, and all directions to the Current Resources list.
-
Below the Filters section on the FlowFalcon Reports page, click Get Results.
If you create or update device/object groups and then, run the FlowFalcon Report, it may take a few minutes for the report to be returned with the expected results. For the purposes of FlowFalcon reporting, device/object groups are refreshed once every 10 minutes, resulting in the delay.
Flow Direction Explanation
When the view you select provides flow direction,  and
and  indicate the traffic flow direction. The source port and the destination port are evaluated. The low port (non-zero) is considered the Application and the high port is considered the Client. The IP addresses follow the port numbers.
When you create a report that uses the source and destination, the traffic for both directions of a conversation pair displays the hosts in both columns so you need to add up the total bandwidth in your head.
|
Source IP |
Source Port |
Destination IP |
Destination Port |
Bandwidth |
|
1.1.1.1 |
334333 |
2.2.2.2 |
80 |
500 MB |
|
2.2.2.2 |
80 |
1.1.1.1 |
34333 |
70 MB |
When you create a report that uses the Application field and the Client field, the host appears in a single column, which enables better aggregations of conversations. 80 becomes the Application port because it is the lower port number and 34333 becomes the Client port. With the Application field and the Client field the same report appears as follows.
|
Application IP |
Application Port |
Client IP |
Client Port |
Bandwidth |
|
2.2.2.2 |
80 |
1.1.1.1 |
34333 |
570 MB |
You can also add the Application Direction field to display each direction of the conversation.
|
Application IP |
Application Port |
Application Direction |
Client IP |
Client Port |
Bandwidth |
|
2.2.2.2 |
80 |
|
1.1.1.1 |
34333 |
500 MB |
|
2.2.2.2 |
80 |
|
1.1.1.1 |
34333 |
70 MB |


Detach FlowFalcon Reports
The following icons appear in the title bar on FlowFalcon Reports page to enable you to export a FlowFalcon report.
 - Click to export all granular data points in the graph to a .csv format.
 - Click to export the data summary data from the table to a .csv format.
 - Click to export the report to a .pdf format.
 - Click to add the FlowFalcon report as an attachment in a report on a new browser tab. You can modify reports to add other attachments and you can save reports to the Report Manager. Report workflows enable you to designate reports to be your favorite reports and to define one report to appear as your custom dashboard.
Navigate FlowFalcon Reports
FlowFalcon reports enable you to adjust the settings for the current graph then Get Results again. You can select a related view to Graph Updated View to drill down or fan out to get related information without having to revise the report settings. You can select specific rows in the table and Graph Selected Rows.
When you click Add Interface then click Get Results, the default report uses the Top Talkers view and displays the top ten results. The following images and steps describe potential workflows that use the Top Talkers view as the example.
You can perform these steps in any sequence for any FlowFalcon report to display specific data.
-
Click the Refresh Rate drop-down and select a refresh rate to update the report data at the frequency you select. You should not set the refresh rate to less than the write interval. The default write interval writes flow data to the disk every 60 seconds. The Cluster Manager > Cluster Settings tab enables you to adjust the write interval.
-
Click the View drop-down below the Get Results button. The following views appear when applicable.
-
Drill Down: Views that contain the exact same fields in the same sequence as the view you used to create the report plus additional fields. This enables you to drill down to display additional information in the subsequent report.
-
Fan Out: Views that share at least one field with the view you used to create the report. This enables you to fan out to display related information in the subsequent report.
-
-
In the table in the report, click
to manage the selection of the items in the table. -
Click Get Results to create a new report after you change the settings in the areas above the Get Results button.
-
Make changes in the Interfaces, Report Settings, Advanced Report Settings, Resolution Settings, Display Settings, and Filters sections.
-
Click Get Results.
-
-
Click Graph Updated View to create a new FlowFalcon report with the drill down or fan out view and the same settings you define previously from the Interfaces, Advanced Report Settings, Resolution Settings, and Display Settings sections.
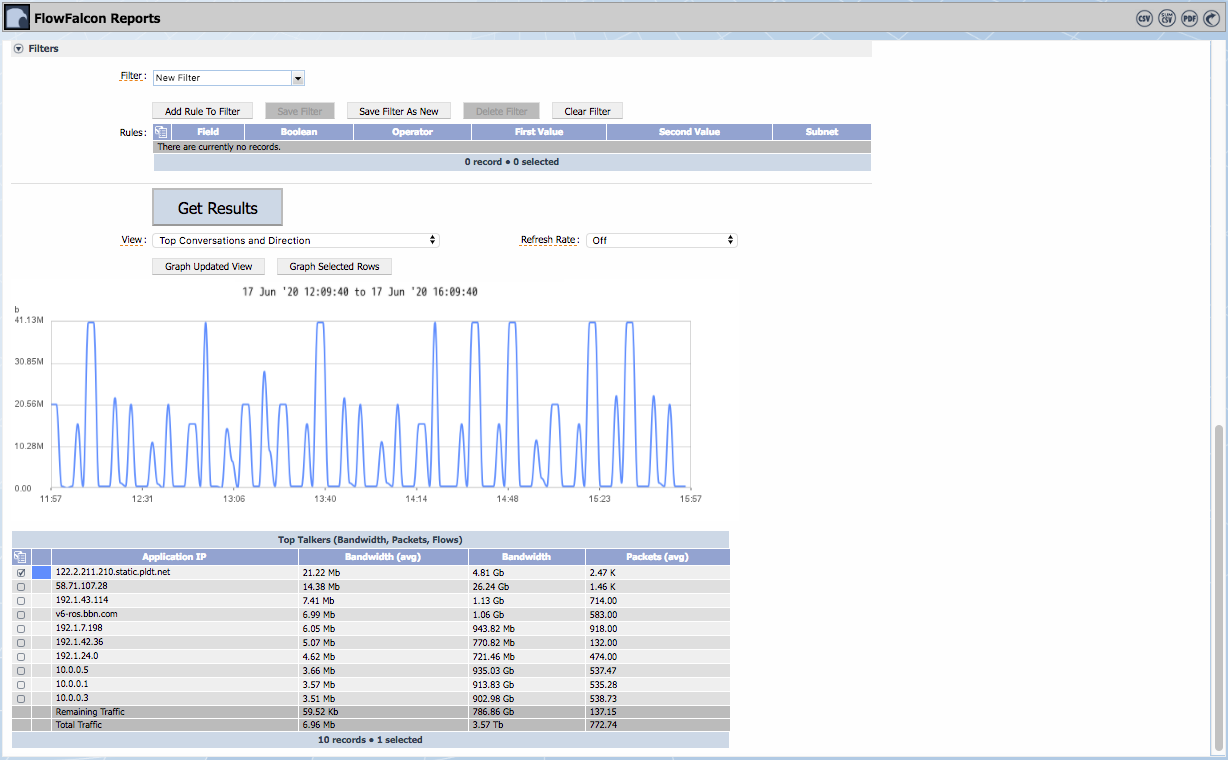
When you click Graph Updated View, the View field in the Report Settings section updates and the filters that appear in the Filters section update to reflect the filters associated with the new view. This enables you to view the filter criteria for the report and to modify the report to include or exclude additional filters. In the report table, click
and select Select None to clear the check boxes for all rows. Select the check box for only one row and click Graph Updated View. The report uses the settings you define above and now displays a report for the new view that contains the one item you select.
-
Click Graph Selected Rows to use all of the settings from above to create a new graph for the data in the rows you select in the report table.
-
In the FlowFalcon report table, click
and select Select None to clear the check boxes for all rows in the table. -
Select the check box for one row in the table.
-
Click Graph Selected Rows.
-
-
Click within the FlowFalcon report table to display a line graph for that specific data item.
-
Click on an item in the Bandwidth column.
-
A line graph of the bandwidth for the source appears.
-
Remaining Traffic, Total Traffic, and FlowFalcon Flow Calculation
The bottom rows of the FlowFalcon report table contain rows for Remaining Traffic and Total Traffic.
-
The Remaining Traffic row displays the total of all interfaces that are not part of the top <n> results (where <n> is the number you enter in the Results Limit field in the Report Settings section above). If there are fewer results than the number you enter in the Report Settings section, the Remaining Traffic row does not appear.
-
The Total Traffic row displays the total of all interfaces in the report, regardless of whether the source appear listed individually in the list or not.
The Graph Other setting in the Report Settings section enables you to include the remaining traffic and total traffic in the pie chart and stacked line graph. Click the Graph Other drop-down and select Yes to display a gray slice in the pie graph and a gray line in the stacked line chart that represents the remaining traffic.
Run a FlowFalcon report that contains 100 results. In the Report Settings, Graph Other is set to No and Results Limit is set to 100. The report displays the first ten results in the pie chart and the stacked line graph and the first 100 results in the table. The table contains a row for Remaining Traffic after the 100th result. Change the Graph Other setting to Yes and click Get Results. The graph updates to display the same data as before plus a new dark gray pie slice and a stack graph row to represent the 90 unselected rows and the Remaining Traffic.
FlowFalcon reports depict the total rate of flows for each device/interface/direction after duplicating flows that lack directional information. NetFlow v5 only exports information about the incoming interface so SevOne NMS duplicates the flow statistics for v5 NetFlow to enable you to run reports for outgoing flows on devices that use v5 NetFlow. If your network only uses v5 NetFlow, the FlowFalcon report flow rate should be double the actual rate of flows that arrive at the collector. Cluster Manager > Cluster Settings enable you to simulate missing egress and missing ingress flows for other flow technologies. The flow rate in FlowFalcon reports is different from the flow rate that displays on the Flow Interface Manager that uses a different calculation for flow data.
Table Columns
Some column definitions change when you select Split Nothing in the Split field.
All possible aggregations are Sum, Average, Average Non-zero, and Max.
|
Data Columns |
||
|
Column Name (please see NOTE above for Aggregation) |
Split Interfaces/Split Groups |
Split Nothing |
|
BANDWIDTH |
||
|
Average Link Utilization |
Bandwidth divided by the total bandwidth available for that record (same as "% of Available"). |
Bandwidth used divided by the number of records rolled up into that record. |
|
Bandwidth |
Total amount of traffic. |
Total amount of traffic. |
|
Bandwidth (% of Available) |
Bandwidth divided by the total bandwidth available for that record. |
Bandwidth divided by the total bandwidth available for all records rolled up into that record. |
|
Bandwidth (% of Total Available) |
Bandwidth divided by the total bandwidth available for all records with the same unique field set. |
Bandwidth divided by the total bandwidth available for all records rolled up into that record. (When rolled up, this statistic is the same as "% of Available" rolled up.) |
|
Bandwidth (% of Total Used) |
Bandwidth divided by the total bandwidth used for all records with the same unique field set. |
Bandwidth divided by the total bandwidth used in the entire report. |
|
Flows |
Total number of flows. |
Total number of flows. |
|
Flows (% of Total) |
Flows divided by the total number of flows in the report. |
Flows divided by the total number of flows in the entire report. |
|
Multicast Average Link Utilization |
Bandwidth divided by the total bandwidth available for that record (Same as "% of Available"). |
Bandwidth used divided by the number of records rolled up into that record. |
|
Multicast Bandwidth |
Total amount of traffic. |
Total amount of traffic. |
|
Multicast Bandwidth (% of Available) |
Bandwidth divided by the total bandwidth available for that record. |
Bandwidth divided by the total bandwidth available for all records rolled up into that record. |
|
Multicast Bandwidth (% of Total Available) |
Bandwidth divided by the total bandwidth available for all records with the same unique field set. |
Bandwidth divided by the total bandwidth available for all records rolled up. (When rolled up, same as "% of Available" rolled up.) |
|
Multicast Bandwidth (% of Total Used) |
Bandwidth divided by the total bandwidth used for all records with the same unique field set. |
Bandwidth divided by the total bandwidth used in the entire report. |
|
Multicast Packets |
Total number of packets. |
Total number of packets. |
|
Multicast Packets (% of Total) |
Packets divided by the total number of packets in the entire report. |
Packets divided by the total number of packets in the entire report. |
|
Packets |
Total number of packets. |
Total number of packets. |
|
Packets (% of Total) |
Packets divided by the total number of packets in the entire report. |
Packets divided by the total number of packets in the entire report. |
|
Packets |
Total number of packets. |
Total number of packets. |
|
Packets (% of Total) |
Packets divided by the total number of packets in the report. |
Packets divided by the total number of packets in the entire report. |