Table of Contents (Start)
- Topics
- Introducing SevOne
- Login
- Startup Wizard
- Dashboard
- Global Search - Advanced Search
- Report Manager
- Report Attachment Wizard
- Report Properties
- Report Interactions
- Instant Graphs
- TopN Reports
- Alerts
- Alert Archives
- Alert Summary
- Instant Status
- Status Map Manager
- Edit Maps
- View Maps
- FlowFalcon Reports
- NBAR Reports
- Logged Traps
- Unknown Traps
- Trap Event Editor
- Trap Destinations
- Trap Destination Associations
- Policy Browser
- Create and Edit Policies
- Webhook Definition Manager
- Threshold Browser
- Create and Edit Thresholds
- Probe Manager
- Discovery Manager
- Device Manager
- New Device
- Edit Device
- Object Manager
- High Frequency Poller
- Device Summary
- Device Mover
- Device Groups
- Object Groups
- Object Summary
- Object Rules
- VMware Browser
- AWS Plugin
- Azure Plugin (Public Preview)
- Calculation Plugin
- Database Manager
- Deferred Data Plugin
- DNS Plugin
- HTTP Plugin
- ICMP Plugin
- IP SLA Plugin
- JMX Plugin
- NAM
- NBAR Plugin
- Portshaker Plugin
- Process Plugin
- Proxy Ping Plugin
- SDWAN Plugin
- SNMP Plugin
- VMware Plugin
- Web Status Plugin
- WMI Plugin
- xStats Plugin
- Indicator Type Maps
- Device Types
- Object Types
- Object Subtype Manager
- Calculation Editor
- xStats Source Manager
- User Role Manager
- User Manager
- Session Manager
- Authentication Settings
- Preferences
- Cluster Manager
- Maintenance Windows
- Processes and Logs
- Metadata Schema
- Baseline Manager
- FlowFalcon View Editor
- Map Flow Objects
- FlowFalcon Views
- Flow Rules
- Flow Interface Manager
- MPLS Flow Mapping
- Network Segment Manager
- Flow Protocols and Services
- xStats Log Viewer
- SNMP Walk
- SNMP OID Browser
- MIB Manager
- Work Hours
- Administrative Messages
- Enable Flow Technologies
- Enable JMX
- Enable NBAR
- Enable SNMP
- Enable Web Status
- Enable WMI
- IP SLA
- SNMP
- SevOne Data Publisher
- Quality of Service
- Perl Regular Expressions
- Trap Revisions
- Integrate SevOne NMS With Other Applications
- Email Tips and Tricks
- SevOne NMS PHP Statistics
- SevOne NMS Usage Statistics
- Glossary and Concepts
- Map Flow Devices
- Trap v3 Receiver
- Guides
- Quick Start Guides
- AWS Quick Start Guide
- Azure Quick Start Guide (Public Preview)
- Data Miner Quick Start Guide
- Flow Quick Start Guide
- Group Aggregated Indicators Quick Start Guide
- IP SLA Quick Start Guide
- JMX Quick Start Guide
- Metadata Quick Start Guide
- RESTful API Quick Start Guide
- Self-monitoring Quick Start Guide
- SevOne NMS Admin Notifications Quick Start Guide
- SNMP Quick Start Guide
- Synthetic Indicator Types Quick Start Guide
- Topology Quick Start Guide
- VMware Quick Start Guide
- Web Status Quick Start Guide
- WMI Quick Start Guide
- xStats Quick Start Guide
- xStats Adapter - Accedian Vision EMS (TM) Quick Start Guide
- Deployment Guides
- Automated Build / Rebuild (Customer) Instructions
- Generate a Self-Signed Certificate or a Certificate Signing Request
- SevOne Best Practices Guide - Cluster, Peer, and HSA
- SevOne Data Platform Security Guide
- SevOne NMS Implementation Guide
- SevOne NMS Installation Guide - Virtual Appliance
- SevOne NMS Advanced Network Configuration Guide
- SevOne NMS Installation Guide
- SevOne NMS Port Number Requirements Guide
- SevOne NMS Upgrade Process Guide
- SevOne Physical Appliance Pre-Build BIOS and RAID Configuration Guide
- SevOne SAML Single Sign-On Setup Guide
- Cloud Platforms
- Other Guides
- Quick Start Guides
Cluster Manager
The Cluster Manager displays statistics and enables you to define settings at the cluster level, the peer level, and the appliance level. With a few exceptions, the default Cluster Manager settings enable you to run SevOne NMS right out of the box. The Cluster Manager also enables you to integrate additional SevOne NMS appliances into your cluster.
To access the Cluster Manager from the navigation bar, click the Administration menu and select Cluster Manager.
The following Cluster Settings are specific to your network.
-
Devices - Device name masks
-
*Devices - Time zone
-
*Email - Your network's email server specifications
-
SFTP - Your network's SFTP specifications
-
*SNMP - Community strings
*You probably defined these settings from the Startup Wizard upon initial implementation.
The left side enables you to navigate your SevOne NMS cluster hierarchy to view statistics and define settings at the cluster level, the per level, and the appliance level. 0When the Cluster Manager appears, the default display is the cluster level with the Cluster Overview tab selected.
-
 Cluster Level - The cluster level enables you to view cluster-wide statistics, to view statistics for all peers in the cluster, and to define cluster-wide settings.
-
 Peer Level - The peer level enables you to view peer specific information and to define peer specific settings. In the cluster hierarchy, the cluster leader peer name displays first in bold font and the other peers display in alphabetical order.
-
 Appliance Level - Each Hot Standby Appliance peer pair displays the two appliances that act as one peer in the cluster. The appliance level enables you to view database replication details, to configure settings to meet Common Criteria security standards, to manage application processes, to view system logs, to add a new peer to your cluster, etc.
Cluster Level Options
Cluster - When you select the cluster level in the hierarchy on the left, the following tabs appear on the right to enable you to view cluster level information and to define cluster level settings.
-
Cluster Overview - Enables you to view cluster-wide information.
-
Peers - Enables you to view the list of peers in the cluster with peer statistics.
-
Cluster Settings - Enables you to define cluster-wide settings across all peers in the cluster.
-
Cluster Upgrade - Enables you to upgrade the artifact via the SFTP server, run the installer to use the newly downloaded Upgrade Artifact, and view the URL. Also, it shows the cluster upgrade history. This tab appears on the active Cluster Leader only.
-
SevOne Data Publisher Configuration - Enables you to configure SevOne Data Publisher using the Graphical User Interface.
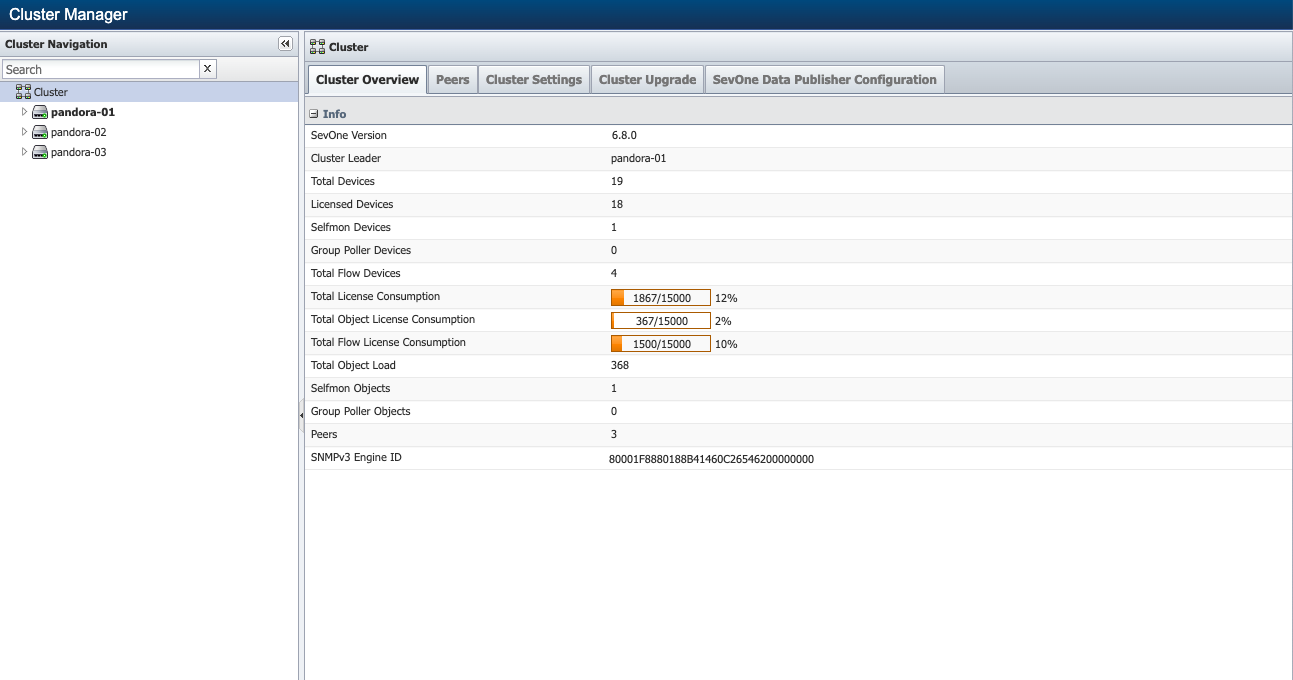
Cluster Overview
Click
Cluster in the cluster hierarchy on the left and select the Cluster Overview tab on the right to display cluster-wide information that includes the total objects and flow load statistics that enable you to see how much of your license object capacity your cluster uses.
-
SevOne Version - Displays the SevOne NMS software version.
-
Cluster Leader - Displays the name of the cluster leader peer. The configuration settings such as cluster settings, security settings, device lists, etc. you define from any peer are stored in the config database on the cluster leader peer. All active peers in the cluster pull config database changes from the cluster leader peer.
-
Total Devices - Displays the total number of Licensed, Selfmon, and Group Poller devices in the cluster.
-
Licensed Devices - Displays the number of devices in your network that SevOne NMS has discovered from which objects are capable of being polled. The Device Manager enables you to manage devices. The Licensed Devices count is equal to (Total Devices - (Selfmon Devices + Group Poller Devices)) in the cluster. For details, please refer to section Device Manager in SevOne NMS User Guide.
-
Selfmon Devices - Displays the number of Selfmon devices in the cluster.
-
Group Poller Devices - Displays the number of Group Poller devices in the cluster.
-
Total Flow Devices - Displays the total number of flow devices in the cluster.
-
Total License Consumption - Displays the sum usage of objects and flow. This displays the number of flows and objects the cluster is licensed to use and the percentage of the license capacity your cluster uses.
-
Total Object License Consumption - Displays total usage of objects. This displays the number of objects the cluster is licensed to use and the percentage of the license capacity your cluster uses.
-
Total Flow License Consumption - Displays the sum usage of flows. This displays the number of flows the cluster is licensed to use and the percentage of the license capacity your cluster uses.
-
Total Object Load - Displays the total number of objects polled from all peers in the cluster along with Selfmon and Group Poller Objects. The Object Types page, Object Rules page, and Object Manager (please refer to SevOne NMS User Guide for details) enable you to manage the number of polled objects.
-
Selfmon Objects - Displays the number of Selfmon objects in the cluster.
-
Group Poller Objects - Displays the number of Group Poller objects in the cluster.
-
Peers - Displays the number of peers in the cluster.
-
SNMPv3 Engine ID - Display the Engine ID of the SevOne NMS cluster.
Peers
Click
Cluster in the cluster hierarchy on the left and select the Peers tab on the right.
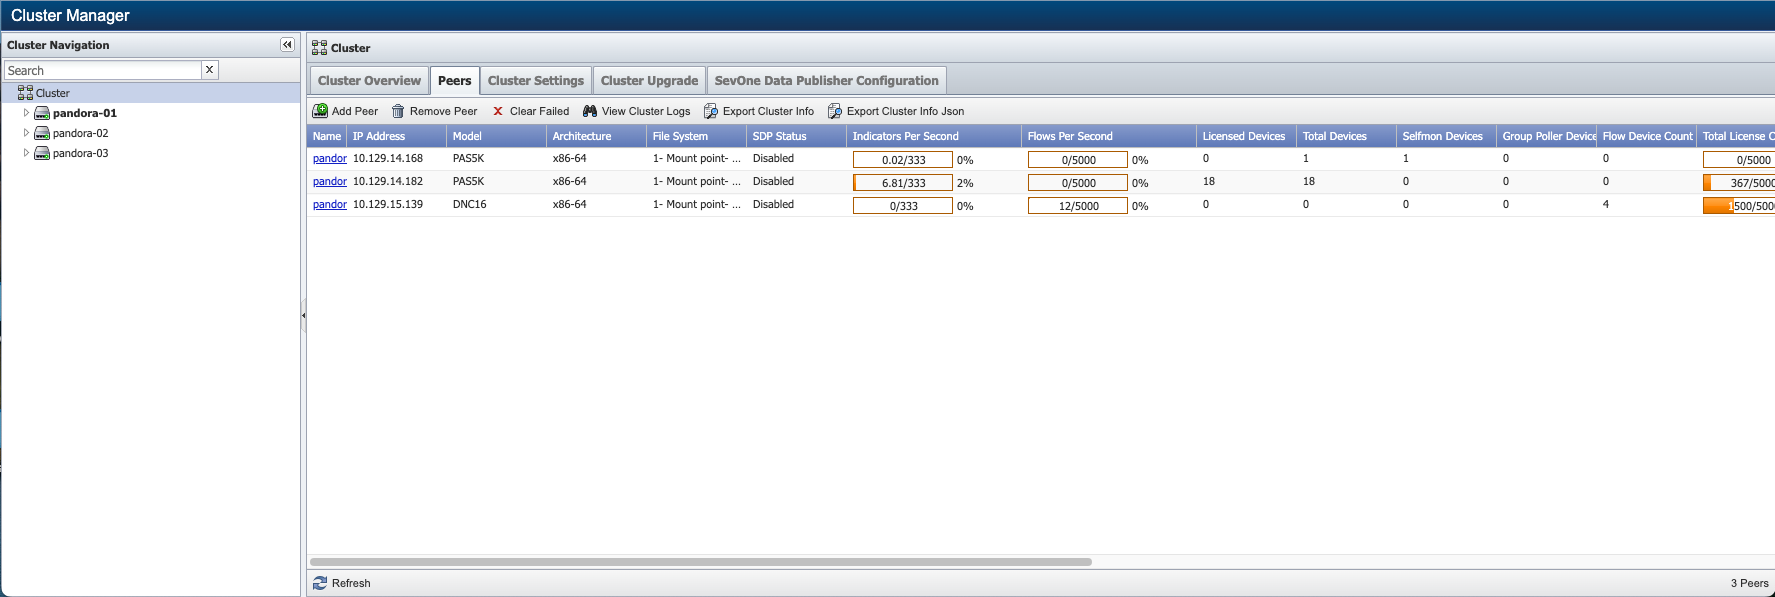
Add Peer
Allows you to queue the new peer for integration, then click Add Peer to add the new peer to the cluster. This works in conjunction with the Integration tab found at the appliance level on the Cluster Manager. When you want to add a new appliance to your cluster as a new peer, you start the integration process on the new appliance and finish the integration process on an appliance that is already in the cluster.
Please refer to the Integration section below for instructions on how to add a new peer to your cluster.
Remove Peer
Caution should be used when considering the use of this feature.
When a peer is removed, /etc/hosts file is recreated. This results in user losing all the host entries in the hosts file. Please proceed with caution!
You must contact SevOne Support to re-add the peer to the cluster.
Remember: The Add Peer button removes all existing data on the appliance.
This feature should only be considered when the peer is acting in a way that is adverse to the overall cluster functionality or performance. In a Hot Standby Appliance peer pair, if you click this button you remove both appliances in the peer.
The following statements assume that the peer is still functional enough to continue to appropriately run the SevOne NMS software.
-
All devices polled by the peer are not removed from the peer and are not distributed to other peers. These devices are inaccessible from the peers that remain in the cluster.
-
Data is not removed from the peer you remove from the cluster.
-
After you agree to the confirmation prompts, there is no way to cancel the peer remove process.
-
The removed peer no longer appears in the hierarchy on the Cluster Manager.
-
The peer removal is bi-directional which means the removed peer is excised from the net.peers table and the removed peer attempts to change its cluster leader to itself. If the removed peer is partially or totally unresponsive, this function restricts MySQL access to remove the affected peer from the cluster leader.
Clear Failed
Allows you to remove peer add failure messages from the list.
View Cluster Logs
Allows you to view the logs of the integration messages.
Export Cluster Info
Allows you to export cluster info to a .csv file.
To export peer information for the selected peer only, from Actions column, click  to Export Peer Info. This will export the information for the selected peer only to a .csv file.
Export Cluster Info Json
Allows you to export cluster information in gzipped JSON format. For example, <clusterName>-<epochTimestamp>-ClusterInfo.gz.
Cluster Settings
Click
Cluster in the cluster hierarchy on the left and select the Cluster Settings tab. Subtabs appear along the left side of the Cluster Settings tab to enable you to define cluster level settings.
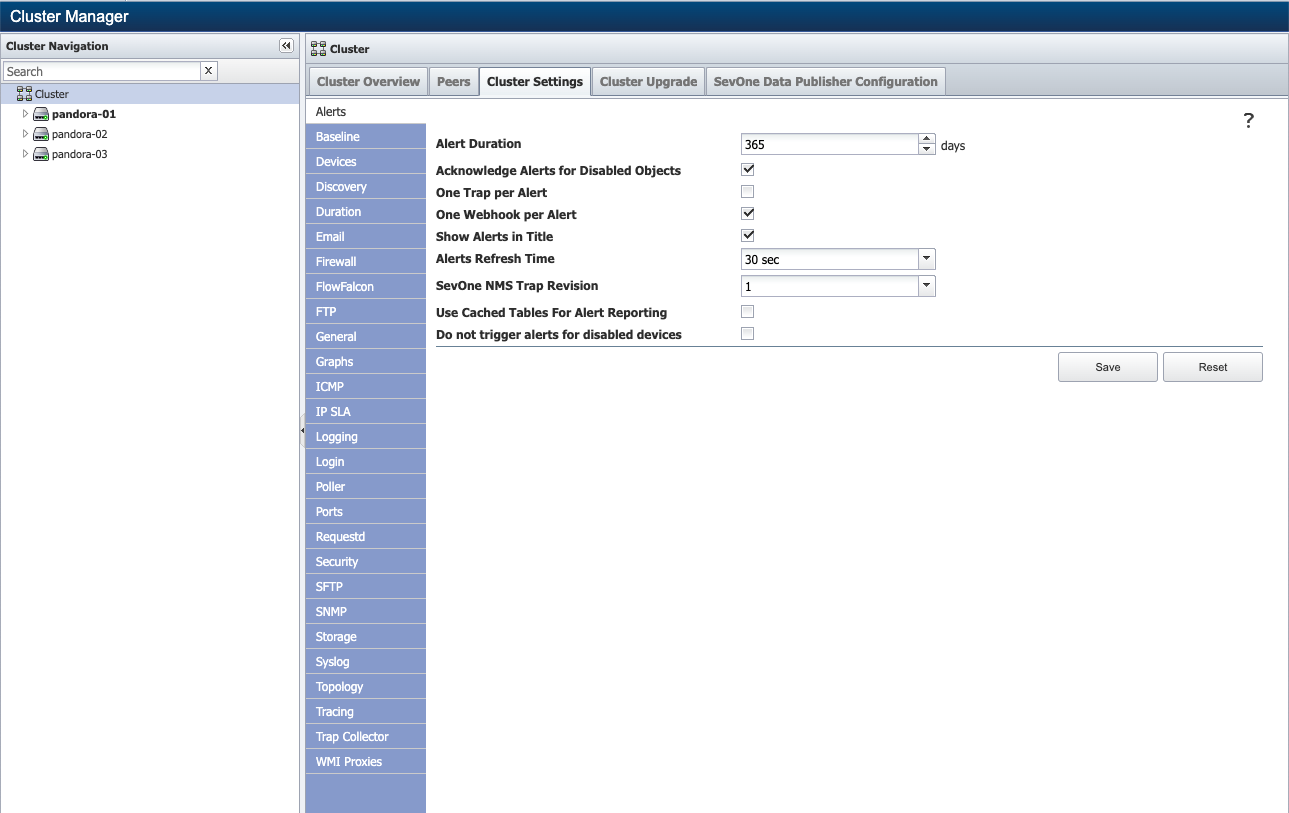
Alerts
The Alerts subtab enables you to define alert settings that affect Alerts page and related pages workflows. For details on Alerts, please refer to SevOne NMS User Guide.
-
In the Alert Duration field, enter the number of days' worth of alert information to store (between 0 and 365). The default is 365.
SevOne recommends the alert archives are less than 2 million alerts. To trim, modify the Alert Duration field or please contact SevOne Support for help.
-
Select the Acknowledge Alerts for Disabled Objects check box to clear alerts for objects that you disable.
-
Select the One Trap per Alert check box to send only one trap per alert. Leave clear to send a trap every time a threshold triggers, even if an alert already exists.
-
Select the One Webhook per Alert check box to send only one webhook per alert. Leave clear to send a webhook every time a threshold triggers (on every occurrence).
-
Select the Show Alerts in Title check box to display the number of alerting devices and the highest alert severity level in the web browser tab.
-
Click the Alerts Refresh Time drop-down and select the frequency at which to refresh the Alerts page display. For large clusters that trigger many alerts, you should consider setting this higher than the 30 second default setting. The Alert engine runs every three minutes to trigger alerts and you cannot configure the alerts engine via the UI.
-
Click the SevOne NMS Trap Revision drop-down and select 1 for revision one traps or select 3 for revision three traps or select 4 for revision four traps. This defines what trap data SevOne NMS sends to your fault management system. If you change this you will need to update how your fault management system receives traps from SevOne NMS. Please refer to section Trap Revisions for details.
-
Select the Use Cached Tables For Alert Reporting check box to use a cached version of the table to reduce read contention.
-
Select the Do not trigger alerts for disabled devices check box to prevent alerts from being generated for devices that polling has been disabled for (on the Device Manager page).
-
Click Save to save the Alerts settings.
Baseline
The Baseline subtab enables you to define how to create baselines. Baselines are used in report workflows and policy/threshold workflows. For details, please refer to sections Report Manager and Policy Browser in SevOne NMS User Guide.
Exponential Smoothing: SevOne NMS uses a rolling average formula known as Exponential Smoothing for baseline calculation. This uses the scalar value of the previous average and the newly collected value to compute the new average. There is no reliance on the actual data points collected during the previous <n> weeks.
-
Baseline Weight (weight of the existing baseline data) = 10
-
New Data Weight (weight of new baseline data) = 1
-
baseline = (existing baseline * 10 + new value * 1)/ (10 + 1)
baseline = new value if there is no existing baseline
The value of (old weight / (old weight + new weight)) is the smoothing factor. The smoothing factor affects the resistance to change that new data has on a baseline. This value ranges between 0 and 1 and a higher smoothing factor causes a greater resistance to change.
Back to the example:
The default smoothing factor is 10/11 ~= 0.909.
As the smoothing factor approaches 1, the impact of each new value on the existing baseline approaches zero. This approach calculates the average and the standard deviation. No trending (slopes) is considered in the calculation as each baseline data point is computed individually.
Changes to these settings can cause data loss. From a data perspective, altering Baseline settings is extremely dangerous. After you change the granularity and click Save, you destroy ALL current baseline data across all peers.
-
In the Granularity field, choose the granularity of a baseline in seconds from the drop-down. The default is 900 seconds (15 minutes) which takes all data during a 15 minute time span, averages the 15 minutes' worth of data, and stores that average data point for every 15 minutes of the week for a total of 672 data points in order to create baselines. The minimum value is 240 seconds (4 minutes) and maximum value is 3600 seconds (60 minutes or 1 hour).
-
In the Baseline Weight field, enter the weight to apply to existing baselines (between 1 and 52). The default is 10. A larger number here reduces the impact of new data on the baseline.
-
In the New Data Weight field, enter the weight to apply to new data (between 1 and 52). The default is 1. A larger weight here causes new data to change the baseline faster.
-
Click Save to save the Baseline settings.
Devices
The Devices subtab enables you to define device definition settings for the Device Manager and related workflows. For details, please refer to section Device Manager in SevOne NMS User Guide.
-
Select the Prevent Duplicate IP Addresses check box to prevent the addition of a device with an IP address that is already in SevOne NMS.
-
Select the Discover Trap Destinations check box to discover trap destinations on devices.
-
Click the Propagate child rules up to the parent drop-down and select one of the following options. The default is Prompt.
-
Don't allow - Do not allow child rules to propagate up to the parent.
-
Prompt - Will prompt you whether to allow child rules to propagate up to the parent.
-
Automatically - Automatically propagate child rules up to the parent.
-
-
In the Device Names section:
-
Select the Resolve Device Names check box to update the device IP address to the resolved address. If you do not enter the correct IP address when you add a device (or an IP address changes) and DNS can resolve the device's name, the device IP address in SevOne NMS updates upon discovery.
-
Select the Lookup Hostnames check box to rename devices whose names are IP addresses to their hostname. If you enter an IP address as a device name and DNS can resolve the IP address, the device name in SevOne NMS changes from the IP address to the device's hostname upon discovery.
-
Select the Lookup SysNames check box to rename devices whose names are IP addresses to their sysName. If you enter an IP address as a device name and DNS cannot resolve the device name or you do not select the Lookup Hostnames check box, the device name in SevOne NMS changes to the SNMP sysName upon discovery, if possible. The device name updates during discovery only if the current name is an IP Address. This check box does not cause the device name to change in SevOne NMS if you change the sysName on the device, in which case you must manually change the device name in SevOne NMS.
-
Select the Force Hostnames check box to use DNS to change all device names to their host names if DNS can resolve the device name.
-
-
In the Device Name Masks section, view the device name masks you define to mask (hide) device names.
-
Click Add to add a row to the list.
-
In the text field, enter a valid Perl regular expression.
-
Click Update.
-
Repeat to define the list of expressions.
-
Click the arrows to move the expression up or down in the list to arrange the sequence of expressions. The mask process stops when a match is found.
-
-
In the Device Deletion Queue Information section:
About Device Deletion QueueThe Device Deletion Queue is a tool to safeguard device data from accidental deletion. By hiding & disabling devices that are added to the queue, devices are effectively removed from service without their historical data being deleted. When devices are deleted accidentally or unexpectedly, the absence of these devices from reports and alerts is often enough for users who rely on them to contact an administrator to communicate that there is a problem. An administrator may remove devices from the deletion queue to return them into service. While historical data, alerts and Device & Object group references to these devices in reports are maintained, there will be a data gap between the time the device was put into the queue and the time it was removed. Administrators may expedite deletion of devices from the queue on a per-device basis or by reducing the number of days devices are maintained in the queue before their permanent deletion.
-
Click the Days to delay drop-down to select the timespan to delay the deletion of the devices in the queue by the number of days entered in this field. The default value is 0 days. The minimum value is 0 days and maximum value is 31 days.
If Days to delay field is set to 0 days, then the device(s) in the deletion queue are marked for immediate deletion. This is to preserve the pre-existing behavior and allow the feature to be turned off.
-
Select the Disable Devices check box to disable objects, polling, and alerting for the devices in the deletion queue.
This setting applies only for the new devices added to the device deletion queue.
-
Select the Hide Devices check box to hide devices queued for deletion from various reports such as, Device, Metadata, Topology, Performance Metrics, TopN, etc., in the user interface. These devices are not visible from Report Manager or Instant Graphs but their device summary is visible.
-
-
In the Time Information section:
-
Click the Default Date Format drop-down and select the date format to use by default. Each user can override this setting from the Preferences page. For details, please refer to section Preferences in SevOne NMS User Guide.
-
Click the Default Time Zone drop-down and select the time zone to appear by default in all device specific Time Zone fields.
-
In the Time Zone Filter field, select the check box next to each country for which you want time zones to appear available for selection from the Time Zone drop-down lists. You must select at least one country time zone.
-
-
In the Device Mover Settings section:
-
Select the Source & Destination Health Check check box to check the health of source and destination peers before the device is moved.
-
Select the Device Connectivity From Destination check box to check the connectivity of the moving device from the destination peer before the actual move is performed.
-
-
Click Save to save the Device settings.
Discovery
The Discovery subtab enables you to define the way device discovery works to find the objects to poll.
-
Click the Device Note Severity Level drop-down and select the severity level at which to create device notes during discovery. For details, please refer to section Discovery Manager in SevOne NMS User Guide.
-
Click the New Device Load Distribution drop-down and select from options Object or IPS (Indicators Per Second). The default option is Object.
-
The new devices created with auto peer are distributed based on the option selected from the drop-down list and automatically assigned to the peer with the least load (however, it will not be assigned to a DNC). From Cluster Manager, click
<peer name>, Peer Overview tab provides details for each peer available in the cluster.
When importing from CSV,From Devices > Device Manager > click Import CSV button > if field applianceName is empty, a peer is automatically chosen for the new device based on the option chosen from the drop-down list (Object or IPS).
-
To determine if the peer is full,
-
if New Device Load Distribution is set to Object, it checks if the object and flow counts of all devices exceeds the peer capacity.
-
if New Device Load Distribution is set to IPS, it checks if the indicators per second in the past 2 hours on all the devices exceeds the peer capacity.
If a new device is added and the peer load is equal to or greater than its maximum peer capacity, the Objects column under Devices > Device Manager displays Peer Full.
-
-
-
In the Thread Pool section:
-
In the Low Priority Size field, enter the number of low priority devices to simultaneously discover (between 1 and 100). Automatic discovery is low priority. The default is 3, which is usually ideal for most implementations. There is a maximum thread pool of 100 devices that can be simultaneously discovered. More threads use more CPU and RAM, so you should reduce this number and/or the High Priority Size number if you notice system slow down.
-
In the High Priority Size field, enter the number of high priority devices to simultaneously discover (between 1 and 100). The default is 3. User initiated discovery is high priority.
-
-
In the Missing Objects section:
When an indicator is discovered and you disable that Indicator Type from Administration > Monitoring Configuration > Object Types, the setting that determines when it will be removed from the report creation selection (for example, choosing indicators for an object in the Performance Metric Graph) is the Days Until Delete field.
Although the setting is for missing objects, the same applies for its indicators. If you add a new device and you have already disabled the Indicator Type from Administration > Monitoring Configuration > Object Types, the new device will not discover this indicator and it will not be available in the Instant Graph selection under your object.
-
In the Days Until Disable field, enter the number of days to wait before an object that is not found during a successful plugin-specific discovery is marked disabled (between 0 and 9999). The default is 2. Enter 0 (zero) to disable missing objects as soon as SevOne NMS determines an object is missing.
-
In the Days Until Delete field, enter the number of days to wait before an object that is not found during a successful plugin-specific discovery is deleted (between 0 and 9999). The default is 31. Enter 0 (zero) to delete missing objects (and all associated data) as soon as the object is determined to be missing. The value you enter in the Days Until Delete field must be greater than the value you enter in the Days Until Disable field.
Individual xStats indicators that have stopped transmitting data are subject to be disabled and deleted pending the Days Until Disable and Days Until Delete field settings. Previously, all indicators would remain regardless of their individual status as long as their object had any activity.
-
-
In the Administrative Status section:
-
In the Enable Up Objects field, enter the number of days to wait before an object that is administratively up is enabled (between 0 and 9999). The default is 0. Enter 0 (zero) to not use this feature.
-
In the Disable Down Objects field, enter the number of days to wait before an object that is administratively down is disabled (between 0 and 9999). The default is 0. Enter 0 (zero) to not use this feature.
-
-
In the Operational Status section:
-
In the Enable Up Objects field, enter the number of days to wait before an object that is operationally up is enabled (between 0 and 9999). The default is 0. Enter 0 (zero) to not use this feature.
-
In the Disable Down Objects field, enter the number of days to wait before an object that is operationally down is disabled (between 0 and 9999). The default is 3. Enter 0 (zero) to not use this feature.
-
Select the Preserve Max Values check box to prevent SevOne NMS from using the settings it discovers from objects that are operationally down.
-
-
In the Universal Collector section:
-
In the Days Without New Data Until Objects/Indicators Are Treated As Missing field, enter the number of days that need to pass after the last data for an Object/Indicator before SevOne NMS starts treating it as missing during the routine Discovery. The minimum value that SevOne NMS allows is 1.
-
-
Click Save to save the Discovery settings.
Duration
The Duration subtab enables you to define how long to store data. You should consult with a SevOne Support Engineer before you change these settings to discuss the potential consequences of these changes.
-
In the Device History Duration field, enter the number of days to store Debug severity level device history. Info severity level history is stored for twice as long, Notice severity level history twice that, and so forth. The minimum value is 1 day and maximum value is 99 days. The default value is 7 days.
ExampleEach log entry has an associated level (or severity) that follows the syslog standard. The higher the severity of the log, the longer it is kept. It follows the exponential model; low-level entries are trimmed.
Log Level
Duration
DEBUG
1 x <time> = 7 days
INFO
2 x <time> = 14 days
NOTICE
4 x <time> = 28 days
WARNING
8 x <time> = 56 days
ERROR
16 x <time> = 112 days
CRITICAL
32 x <time> = 224 days
ALERT
64 x <time> = 448 days
EMERGENCY
128 x <time> = 896 days
where, <time> is 7 days.
Optionally, device history duration can be set using the command line interface script.
Command Line Interface command$/usr/local/scripts/SevOne-acttrim device [ARGUMENTS]Arguments--wait-duration (Optional) This is how long to wait between cleaning up device logsDefault: 0--server-id(Optional) This is the peeridto run the script onDefault: 1--short-term-logs-duration(Optional) This is how long to hold on to the short term logs,insecondsDefault: 604800--emergency-purge (Optional) Emergency purge. Force removing of old data with base 1 dayfordebug logs.In case of emergency, you may run the script with argument --emergency-purge which automatically sets device history duration to 1 day. This results in 7x reduction for all device notes.
Command Line Interface command with --emergency-purge argument$/usr/local/scripts/SevOne-acttrim device --emergency-purgeLog Level
Duration
DEBUG
1 x <time> = 1 days
INFO
2 x <time> = 2 days
NOTICE
4 x <time> = 4 days
WARNING
8 x <time> = 8 days
ERROR
16 x <time> = 16 days
CRITICAL
32 x <time> = 32 days
ALERT
64 x <time> = 64 days
EMERGENCY
128 x <time> = 128 days
where <time> is 1 day.
In comparison to Plugin Longterm data, Device Notes data is with low priority. The cron job is scheduled to run every day at 00:05 (GMT), an hour before Plugin Longterm Trim process execution.
5 0 * * * root/usr/local/scripts/SevOne-acttrim device --log-timestamp --log-start-stop 2>&1 | logger -t SevOne-act-trim-deviceIf Plugin Longterm Trim is invoked manually with --emergency-purge argument, Device Notes Trim will first be called internally with the same arguments. In this case, more disk space will be reserved for the Plugin Longterm data. Only one instance of the process runs at a time.
-
In the Logged Trap Duration enter the number of days to store logged traps for display on the Logged Traps page. The minimum value is 1 day and maximum value is 365 days. The default value is 7 days.
If Logged Trap Duration value is set beyond the default value of 7 days, you may experience an issue with traps loading, as expected, from the graphical user interface.
-
In the Unknown Trap Duration field, enter the number of days to store unknown traps for display on the Unknown Traps page. The minimum value is 1 day and maximum value is 365 days. The default value is 1 day.
If Unknown Trap Duration value is set beyond the default value of 1 day, you may experience an issue with traps loading, as expected, from the graphical user interface.
-
Click Save to save the Duration settings.
The Email subtab enables you to define the email server that SevOne NMS uses to email reports and alerts. For details, please refer to sections Report Properties and Alerts in SevOne NMS User Guide.
The email server must be able to accept large attachments because a .pdf report can be over 20MB.
-
In the Email Server field, enter the host name or IP address of the SMTP email server for SevOne NMS to use to send emails.
-
In the Username field, enter the user name SevOne NMS needs to authenticate onto the email server.
-
In the Password field, enter the password SevOne NMS needs to authenticate onto the email server.
-
In the Email Sender field, enter the email address to appear as the sender of the emails. This must have a valid email address format.
-
In the Email Sender Name field, enter the name to appear as the sender of the emails.
-
In the Alerts Email Subject field, enter the text to appear in the Subject line of alert emails. When you leave the Multiple Alerts Per Email check box clear, this field supports the variables listed below.
-
In the Reports Email Subject field, enter the text to appear in the Subject line of report emails. Supports the following variables: $name - Report name, $id - Report ID
-
Select the Multiple Alerts Per Email check box to place multiple alerts in the same email. Leave clear to receive each alert in a separate email. If you select this check box, the Alerts Email Subject does not include variables.
-
Select the Email Cleared Alerts check box to send an email when an alert clears.
-
Click the Connection Security drop-down and select a connection security protocol.
-
In the Port field, enter the port number on the email server for SevOne NMS to use.
-
Select the Compress Emailed Reports check box to compress the size of email attachments. Perform the following steps if you select this check box.
-
In the Compress Reports Larger Than field, enter the minimum report size to compress. All smaller reports are not compressed. Enter 0 (zero) to compress all emailed reports.
-
In the Image Quality field, enter how much to compress images (between 1 and 10). 10 = no compression, and the best quality and 1 = more compression and less quality. The default is 10.
-
-
Click Send Test Email to send a test email to the email address you associate to your user profile from the email sender through the email server.
-
Click Save to save the Email settings.
Alerts Email Subject Supported Variables
-
$severity - Alert severity in text form
-
$severityNum - Alert severity in numeric form
-
$deviceId - ID of the alerting device
-
$deviceIp - IP of the alerting device
-
$deviceName - Name of the alerting device
-
$deviceAltName - Alternate name of the alerting device
-
$alertId - Alert identifier in numeric form
-
$occurrences - Number of alert occurrences in numeric form
-
$objectName - Name of the object that triggered the alert
-
$objectAltName - Alternate name of the object that triggered the alert
-
$thresholdId - Threshold identifier in numeric form
-
$alertType - Type of the alert
-
$threshold - Name of the threshold
-
$policyId - Policy identifier in numeric format
-
$policyName - Name of the policy
-
$groupName - Device/Object Group name of the policy
-
$message - Threshold trigger message
-
$firstSeen - Time of the first alert.
-
$lastSeen - Time of the last alert
-
$assignedTo - Name of the user to which the alert is assigned
-
$singleAlertMsg - Combination of severity and device name with format " - $severity: $deviceName"
Firewall
The Firewall subtab enables you to select the firewall service for the cluster. Click Enable Cluster Firewall check box to confirm and enable the firewall settings for the cluster. By default, it is disabled.
Click on Open Port to add a firewall port and click on Remove Port to remove user-added ports only.
FlowFalcon
The FlowFalcon subtab enables you to define how to collect and process raw flow data and aggregated flow data. An example at the end of this section sums up many of the following settings.
Changes to these settings can cause data loss. Please consult with your SevOne Support Engineer before you modify the FlowFalcon settings marked with an asterisk <*>.
-
* Select the Store Raw Flow check box to collect and store raw flow data. Most FlowFalcon views use raw data which provides more specificity in the result set at the tradeoff of longer report execution times and less historical data availability.
-
* Select the Store Aggregated Flow check box to collect and store the most relevant flow data in an aggregated format that aggregated FlowFalcon views use for faster report execution times.
-
* In the Raw Flow Duration field, enter the number of days' worth of raw flow data to keep. Gigabytes of raw flow data can accumulate quickly. You define aggregated flow duration on the Cluster Manager at the peer level as described later in this topic. The minimum value is 0 days. The default value is 1 day.
-
* In the Raw Flow Data Size field, enter the maximum amount of disk space to allocate for raw flow data. The minimum value is 0 GB. The default value is 100 GB.
-
* In the Write Interval field, enter the number of seconds to collect flow data before creating a flat file and writing the data to the disk (between 60 and 300). The default is 60, which is recommended. A longer write interval results in fewer (but larger) flat files for raw data and smaller tables for aggregated data. See example below.
-
Select the Drop Long Flows check box and enter the maximum number of seconds to consider flow data "long" in the Max Flow Duration field (between 60 and 600). The default is 120. This drops flows when the flow's duration exceeds the write interval. Long flows are usually due to improper router configuration. This setting triggers an administrative message that appears upon log on to inform you to review the router configuration. Suggested Max Flow Duration is ~2x the Write Interval from the previous step.
-
Select the Enable ASN/Country Enrichment check box to enable enrichment of flow with ASN (Autonomous System Number) and Country determined from the IP addresses in the flow. When enabled, flow is matched as it arrives to a country and ASN in the table; the ASN and Country information is stored along with the flow. Available for both raw and aggregated flow. By default, this field is enabled. Enriched views are enabled by default but, only apply to raw flow data. At present, there is a limit of 10 aggregated views your appliance can support. Due to this limit, the views are delivered as raw data. However, you can aggregate as needed. Please refer to FlowFalcon View Editor for details.
-
Select the Enable Service Enrichment check box to enable service enrichment for flow collection and reporting. When enabled, flow is matched as it arrives to a service profile and service category in the service profile table and the Service Profile Id and Service Category Id are stored along with the flow. Available for both raw and aggregated flow. By default, this field is enabled. At present, there is a limit of 10 aggregated views your appliance can support. Due to this limit, the views are delivered as raw data. However, you can aggregate as needed. Please refer to FlowFalcon View Editor for details.
The Service Profiles can be found in Administration > Flow Configuration > Protocols and Services > Service Mapping tab.
-
Select the Enable MPLS Attribute Mapping check box and enter the number of seconds for how frequently to read the map files and to refresh the mapping in the MPLS Attribute Mapping Refresh Interval field. This enables you to map v9 NetFlow template data from core "P" routers for reports that use the following fields in FlowFalcon views: 45050: Customer Client IP, 45051: Customer Client Subnet, 45052: Customer VRF Name, 45053: Customer Application IP, 45054: Customer Application Subnet, 45055: PE Ingress IP, and 45056: PE Egress IP.
Map files are customer-specific. The MPLS Flow Mapping page enables you to upload the two required map files into SevOne NMS.
-
* In the Aggregation TopN field, enter the number of results (between 50 and 1000) to store for each aggregation per each write interval. This consumes disk space and is the maximum number of individual results that an aggregated FlowFalcon view can display. The default value is 100.
Warning: Setting a value greater than the default may result in data loss.
-
In the Hide Inactive field, enter the number of days (minimum 1) to display data for an inactive device or interface before the device or interface is considered inactive and its information is hidden. The default is 14. A device or interface is considered inactive if it does not send data to SevOne NMS.
-
In the Deny Inactive field, enter the number of days (minimum 0) to deny an interface that is inactive (does not send data) for this many days. The default value is 0 days; i.e., disabled. If an interface is found to have no data for the defined number of days, the process denies the interface in the Flow Interface Manager. When all interfaces for a device are denied, the device is also denied. Upon denial, licenses / objects that were in use are freed up for the denied interface(s).
-
In the Purge Inactive field, enter the number of days (minimum 0) to store data for an inactive device or interface. The default is 0. Enter 0 (zero) to never purge data.
-
In the Incoming Port field, enter the port number on the SevOne appliance to listen for flow traffic.
-
Click the Raw Data Compression drop-down and select a method for compressing raw data files. Greater compression requires less storage but results in higher CPU usage.
-
Select the Display Flow Sample Rates check box to display the sampled flow rate on FlowFalcon reports that contain split interfaces and to display an additional column on the Flow Interface Manager for sampled data. FlowFalcon reports with sampled data display a message. Interfaces that are not sampled use a sample rate of 1X.
-
Select the Create Egress Records When Not Available check box to automatically create egress records for ingress interfaces that do not receive egress records. Leave clear if your devices support both ingress and egress interface flow export. This does not affect how SevOne NMS handles NetFlow v5.
-
Select the Create Ingress Records When Not Available check box to automatically create ingress records for egress interfaces that do not receive ingress records. Leave clear if your devices support both ingress and egress interface flow export. This does not affect how SevOne NMS handles NetFlow v5.
-
Select the NAT Support check box to enable support for routers behind network address translation (NAT).
-
In the Max Write Threads field, enter the maximum write threads for Flow Traffic. The minimum value is 1 thread and the maximum value is 10 threads. The default value is 1 thread.
-
Click Save to save the FlowFalcon settings.
This example uses flows that come from a single device/interface/direction to compare raw and aggregated data at both ends of the settings spectrum (60 to 300 seconds) when flows are received at a rate of 100 flows/minute and each flow is 50 bytes.
Raw - All flows collected during each write interval are written to the disk in a single file. A longer write interval results in larger file sizes, but fewer files (since they are written less often). For a flow rate of 100 flows/minute at 50 bytes each over a 10 minute time frame.
-
60 second write interval: 10 files are written, one file per minute. Each file contains 100 flows resulting in 5000 bytes per file. (10 x 5 KB files = More smaller files)
-
300 second write interval: 2 files are written, one file every 5 minutes. Each file contains 500 flows resulting in 25,000 bytes per file. (2 x 25 KB files = Fewer larger files).
Both approaches result in the same amount of disk usage (in this case 50 KB).
Aggregated - At the end of each write interval, SevOne NMS calculates one data point each for the number of results you enter as the Aggregated TopN per aggregated view and writes those <n> data points to the database (default - 100). Using a 10 minute time span:
-
60 second write interval: Writes 100 data points every minute and adds a total of 1000 records to the database.
-
300 second write interval: Writes 100 data points every 5 minutes and adds a total of 200 records to the database.
Thus a larger write interval results in fewer entries to the database and is why a longer time period results in smaller tables.
For every write interval (in this case 60 seconds), SevOne NMS determines the top <n> for every device, interface, direction, aggregated view combination (e.g., Router 1, Eth0/0, Incoming would provide the top 100 data points for every aggregated view (Top Talkers, Top Conversations, etc.). Then SevOne NMS determines a top 100 for Router 1, Eth0/0, Outgoing for every aggregated view. This process continues for each Interface on every device.
All flows that do not make it into the top 100 are aggregated together into a single record called Remaining Traffic. This happens for every device, interface, direction, view combination. Total Traffic is the top <n> plus remaining traffic to represent all traffic in the network.
FTP
The FTP subtab enables you to define the FTP destination settings for SevOne NMS to use when you send a report via FTP. For details, please refer to section Report Properties in SevOne NMS User Guide.
-
In the Server field, enter the IP address or host name of the FTP server where SevOne NMS is to send reports.
-
In the Port field, enter the port to which SevOne NMS is to send reports.
-
In the Username field, enter the user name SevOne NMS needs to authenticate onto the FTP server.
-
In the Password field, enter the password SevOne NMS needs to authenticate onto the FTP server.
-
In the Path field, enter the path to the location on the FTP server where you want the report to be sent.
-
Click Test FTP Settings to verify that your FTP settings work correctly.
-
Click Save to save the FTP settings.
General
The General subtab enables you to define general system settings.
-
In the Cluster Name field, enter the name of your SevOne NMS cluster. The name entered will appear in your web browser tab if Cluster Settings tab > Alerts subtab > Show Alerts in Title field is disabled.
-
Click the Log Entry Severity Level drop-down and select the severity level at which to write to the log file. Select a lower severity level to generate more log data. This setting is primarily for use by SevOne Support Engineers.
-
Click the Search Behavior drop-down and select one of the following options:
-
Default. Searches with special characters are exact searches. Searches without special characters are wildcard searches.
-
Never Exact. All searches are wildcard searches.
-
Always Exact. All searches are exact searches.
-
-
Select the Override Precision check box to specify the level of precision. Data typically rounds to two decimal places. Select this check box and enter the number of decimal places to which to round data (between 0 and 6). The default is 0. Most report workflows enable you to define the precision for each report.
-
In the Peer Status Cache field, specify the number of seconds between updates to the peer availability cache. SevOne advises against entering 0 or high values (anything over 60 seconds) without first contacting SevOne. (A cache invalidation setting of 0 will not rebuild the cache.) The minimum value is 0 seconds and the maximum value is 999999 seconds.
-
Select the API Weekend Work Hours check box if you use the SevOne NMS API and your work hours include weekends.
-
Select the Measure System Uptime check box to populate the Deferred Data plugin for each device with a system object and a SysUpTime indicator that contains the normalized data. The deferred data SysUpTime is the true representation of the devices uptime as SevOne NMS derives from polls every 15 minutes. Each poll collects data for the past 7 days. System uptime is the length of time a device has been up without any downtime (loss of connection to the device can appear as downtime). For details, please refer to section Deferred Data Plugin in SevOne NMS User Guide.
-
Select the Reports Restricted By Default check box to restrict access to new reports. You can override this setting for each report on the Report Properties. For details, please refer to section Report Properties in SevOne NMS User Guide.
-
Select the Use WebKit to PDF check box to use WebKit to render .pdf reports. WebKit integration is a beta feature but has proven to generate more presentable .pdf's. NOTE: If a Performance Metrics Report is added with more than 25 indicators (which are in single-row table) along with the graph, the report will shrink-to-fit on the page.
-
Select the Fit PM Graph in One Page check box to shrink the Performance Metrics graph to fit on a single page while using Webkit to render .pdf reports.
-
Select the Enable Localization check box to enable the display of SevOne NMS in a language other than English. When you select this check box, click the Default Language drop-down and select the language to appear by default in user definition workflows and to display on the Login page. Localization is a beta feature and can be set for each user on the Preferences page. For details, please refer to section Preferences in SevOne NMS User Guide.
-
Click the Week starts on drop-down and select the start day of the week. Options are Saturday, Sunday, or Monday. This can also be set on the Preferences page.
The value set in Week starts on field here overwrites any user specified setting when reports are mailed. For example,
Cluster Manager > Cluster Settings > General > Week starts on is set to Sunday.
Administration > My Preferences > Week starts on is set to Monday.
When reports are mailed, it will choose the day set in Cluster Manager (Sunday as shown in this example) as the week's start day. -
In the Peer Takeover Threshold field, specify the number of minutes for the self-monitoring notification to be pushed when the peer takeover exceeds <n> minutes to complete. The default value is 10 minutes. The minimum value is 1 minute and maximum value is 999 minutes.
-
Select the Show Hostname in Title check box to add the hostname to the web browser tab.
-
Select the Enable Admin Notifications check box to enable email receipt of Admin Notifications.
If the Alertmanager service is stopped and then, email configuration is modified, the updates to the configuration will only take effect after the Alertmanager service is restarted.
Stop Alertmanager$ supervisorctl stop alertmanagerRestart Alertmanager$ supervisorctl restart alertmanager -
In the Cluster Time Drift Threshold field, specify the number of seconds allowed in time drift. The admin will be notified when an appliance exceeds the configured threshold for time drift as compared to the the system time on the Cluster Leader. The default value is 60 seconds. The minimum value is 15 seconds and maximum value is 300 seconds.
-
Select the Alert NTP server unavailable check box to notify if there are no active NTP servers.
-
Click the IPv6 address representation drop-down and select one of the following options:
-
Full Format - to display IPv6 address in full format. For example, 1080:0000:0000:2601:0000:0800:200c:417a
-
Zero Compression with Drop Zero - replaces the consecutive blocks of zeros with a double colon for the first contiguous block only. Drops/omits the leading zeros and not the trailing zeros of the rest where applicable. For example: 1080::2601:0:0800:200c:417a
-
Drop Zero - drops/omits the leading zeros and not the trailing zeros. For example, 1080:0:0:2601:0:800:200c:417a
-
Zero Compression - replaces the consecutive blocks of zeros with a double colon for the first contiguous block only. For example: 1080::2601:0000:0800:200c:417a
-
-
Select the Disk Emergency Mode check box to enable or disable the disk emergency mode safety checks.
-
On an active appliance, script disk-emergency-mode runs on a cron job every 15 minutes to determine whether the peer needs to be put into disk emergency mode.
-
Field Disk Emergency Mode must be enabled if all of the following conditions are met.
-
disk use exceeds max_disk_util.
-
you have enabled this feature and configured a threshold (for example, 50%) for /data utilization by non-longterm-data.
-
a ratio greater than this threshold is being used by non-longterm-data in /data. For example, 80% of /data is filled with logs; a critical error state. This implies a situation that cannot be recovered from by automated means and requires admin intervention.
-
-
When field Disk Emergency Mode is enabled,
-
an admin message is presented to you at login.
-
if prometheus is enabled, a prometheus alert is generated.
-
in SevOne-act trim longterm, no disk-use-based trim will take place. Duration-based trim will continue as normal.
-
updater does not commit any polling shortterm data to risk.
-
SevOne-ffupdater does not commit any flow shortterm data to risk.
-
SevOne-trapd does not write traps to disk.
-
SevOne-netflowd does not collect raw data.
-
polling and collection continue as normal; the downstream services such as SevOne Data Publisher, Dataminer, etc. operate as expected with shortterm data as long as mysqld has not stopped completely due to the disk (/data) being 100% full.
-
-
If the conditions required for Disk Emergency Mode are remediated, the mode is turned off.
-
This mode runs on all PAS peers in a cluster including passive appliances.
-
The status of Disk Emergency Mode is stored in /SevOne/appliance/settings/disk_emergency_mode comprised of 1 or 0 / on or off.
-
Disk emergency script is logged in /var/SevOne/SevOne-disk-emergency-mode.log file.
-
-
In the Disk Emergency Threshold field, specify the threshold percent of non-MySQL data allowed to occupy /data. The minimum percent is 20% and maximum percent is 90%. The default value is 90%.
-
Click Save to save the General settings.
Graphs
The Graphs subtab enables you to define the settings for the graphs that appear in reports. For details, please refer to section Report Manager in SevOne NMS User Guide.
-
Select the Abbreviate Graph Text check box to abbreviate long names on the graph with ellipses.
-
Select the Display Poll Frequency check box to have the Display Frequency check box selected by default in report creation workflows.
-
Select the Display Minimum Value check box to have the Display Minimum check box selected by default in report creation workflows.
-
Select the Draw Horizontal Grid Lines check box to display horizontal lines on the graph then enter how close the horizontal lines should be to one another in the Horizontal Grid Density field.
-
Select the Draw Vertical Grid Lines check box to display vertical lines on the graph enter how close the vertical lines should be to one another in the Vertical Grid Density field.
-
Select the Display Last Poll Value check box to display the value of the last successful poll in the graph legend.
-
Select the Display Units in TopN CSV check box to append the units as an additional column in the TopN CSV exports.
-
Click the Default Aggregation Alignment drop-down and select Aligned to Interval or Aligned to Start Time to allow you to align all the aggregation points by Interval or by Start Time.
-
Select the De-normalizing GAUGE Totals check box to perform a total aggregation instead of using a simple sum for the Total column in graph summaries.
-
Click Save to save the Graphs settings.
ICMP
The ICMP subtab enables you to define ICMP settings for devices on which you enable the ICMP plugin. For details, please refer to section ICMP Plugin in SevOne NMS User Guide.
-
Select the Always 100% Availability check box to report 100% availability in ICMP even if a single packet makes it through. Leave clear to set availability to the percentage of the packets that make it through.
-
Click Save to save the ICMP settings.
IP SLA
The IP SLA subtab enables you to define IP SLA settings for the devices on which you enable the IP SLA plugin. You can override this setting for individual devices from the Edit Device page. For details, please refer to sections IP SLA Plugin and Edit Device in SevOne NMS User Guide.
-
Click the Default Responder Action drop-down.
-
Select Ignore to have SevOne NMS not change the IP SLA responder setting on devices.
-
Select Yes to turn on the IP SLA responder on devices upon discovery, when possible.
-
Select No to turn off the IP SLA responder on devices upon discovery, when possible.
-
-
Click Save to save the IP SLA settings.
Logging
The Logging subtab enables you to manage which user actions are to create log entries. You can view log entries on the Cluster Manager at the appliance level on the System Logs tab. See the Processes and Logs topic for a list of the system logs to where log entries are made.
-
 - User actions are logged.
-
 - User actions are not logged.
You can override cluster level Logging settings at the peer level from the Peer Settings tab described later in this topic. Some user action log functionality is dependent upon your software kernel version being higher than 2.6.36. On the Administration > About page, click PHP Status under Status Information to find your kernel version.
-
applianceSettingManaged - Cluster Manager Appliance Settings creates log entries when a user changes a setting on the Cluster Manager Appliance Settings tab.
-
clusterManaged - Cluster Manager Appliance Management creates log entries when a user performs actions such as database synchronization, fail over, etc. from the gear menu at the appliance level on the Cluster Manager.
-
commandExecuted - Console Command Execution creates log entries when a user executes a command in the Linux terminal.
-
configFileModified - System Configuration Files creates log entries when various system configuration files are modified.
-
devicePluginEntityManaged - Device Editor Plugin Object Managers creates log entries when a device plugin object manager (e.g. "DNS Objects", "ICMP Objects" or "HTTP Objects") is modified.
-
devicePluginManaged - Device Editor Plugin Settings creates log entries when a user modifies the plugin settings for a device on the Add/Edit Device page.
-
discoveryManaged - Discovery Management creates log entries when a user queues a device discovery, changes discovery priority or cancels discovery.
-
entityManaged - General Management triggers when a user creates, updates, deletes, enables or disables devices, alerts, thresholds, policies, users, trap destinations, and others.
-
entityMappingManaged - Association Management creates log entries when a user modifies associations of device/object groups, nested device/object groups, user roles, trap destinations or metadata mapping.
-
fileUploaded - File Upload Management creates log entries when a file has been uploaded to cluster manager upload update file, status maps or device types.
-
importTriggered - Data Import creates log entries when a user imports data via an .spk file.
-
processManaged - Cluster Manager Processes creates log entries when a user starts, stops, or restarts a process from the Process Overview tab on the Cluster Manager.
-
ruleApplied - Membership Rules triggers when a user applies object group and device group membership rules.
-
settingModified - Cluster Manager Settings creates log entries when a user modifies the settings on the Cluster Settings tab or the Peer Settings tab on the Cluster Manager.
-
soapMethodInvoked - SOAP API Call creates log entries when a user invokes a SOAP API call.
-
userAuth - User Authentication creates log entries when a user logs in, logs out or is affected by other authentication events such as inactivity time out or failed login attempts.
-
userPasswordChanged - User Password creates log entries when a user changes their password or an account is created with a new password.
Click Save to save the Logging settings.
Login
The Login subtab enables you to add a custom message to the Login page and to display the Alert Summary, Instant Status, and Alerts on the Welcome Dashboard.
-
In the Login Page Message field, enter the message to appear on the Login page. Limit is 1500 characters and you cannot use HTML formatting.
-
Select the Use a Fixed Width Font check box to use a font whose letters and characters each occupy the same amount of horizontal space. The font you define for your browser is the default font for the message. To change your font in Internet Explorer; click the Tools menu and select Internet Options then Fonts. To change your font in Firefox: click the Tools menu, select Options, and then select Content.
-
In the Welcome Dashboard section:
-
Select the Display Alert Summary check box to display an Alert Summary report on the Welcome Dashboard. For details, please refer to section Alert Summary in SevOne NMS User Guide.
-
Select the Display Instant Status check box to display an Instant Status report on the Welcome Dashboard. For details, please refer to section Instant Status in SevOne NMS User Guide.
-
Select the Display Alerts check box to display an Alerts section on the Welcome Dashboard. For details, please refer to section Alerts in SevOne NMS User Guide.
-
-
In the User Sessions section, select the Allow Concurrent User Sessions check box to allow a user to login in more than once, concurrently, using the same login credentials.
-
In the Single Sign-On section,
-
Select the Enable Single Sign-On check box to allow a user to use the configured Single Sign-On integrations instead of the default authentication.
-
Select the Enable Peer Certificate Verification check box to verify the peer's certificate when logging in with Single Sign-On.
-
In the OpenID-Connect Issuer URL field, enter the issuer URL to use for Single Sign-On integrations.
The OpenID-Connect Issuer URL must match the Nginx Server Certificate Common Name. For example, if the server certificate common name is sso.example.com, the OpenID-Connect Issuer URL must be https://sso.example.com/sso.
-
In the OpenID-Connect Client ID field, enter the string to identify SevOne NMS for Single Sign-On integrations.
-
In the OpenID-Connect Client Secret field, enter the secret to identify SevOne NMS for Single Sign-On integrations.
Root certificate (and chain) must be added to the operating system trust storeExample$ SevOne-act add-certificates --file/path/to/cert.crt
-
-
Click Save to save the Login settings.
Poller
The Poller subtab enables you to define poller settings.
-
In the Poller Threads field, enter the number of poller threads to use concurrently (between 1 and 1000). The default is 60.
SevOne NMS Appliance Model
Recommended Poller Thread Max
PAS2k
60
PAS5k
60
PAS10k
100
PAS20k
200
PAS60k
300
PAS100k
600
vPAS100k
1000
PAS200k
1000
PAS300k
1000
Poller Thread Max should be set to the smallest size of the SevOne NMS appliance model in the cluster. By not doing so, it may result in resource issues.
-
In the Update Interval field, enter the number of seconds to collect poll data before writing data to the disk (between 1 and 300). The default is 60.
-
Select the Display Poller Downtime check box to display a gap in a graph when a poller is down. This field is strictly related to the data that is polled via SevOne-polld and does not apply to any external data pushed to the system. In the Poller Downtime Threshold field, enter the number of seconds for polling to be down before a gap appears in a graph. Leave clear to display a continuous line in graphs between actual poll points. The minimum value for Poller Downtime Threshold field is 1 second.
-
In the Oracle Plugin Timeout field, enter the number of minutes to keep each Oracle poller thread polling before time out and start over. This prevents threads from being consumed by infinite Oracle poll times. The minimum value is 1 second and the maximum value is 32767 seconds.
-
In the SNMP Timeout field, enter the number of seconds until timeout. The minimum value that SevOne NMS allows is 1 second. The default is 3 seconds.
-
In the SNMP Retries field, enter the number of retries before SNMP gives up on the timeout. The default is 3.
-
Select the Enable Custom Calculation Poller Cutoff Period check box to enable custom calculation poller cutoff period for all devices in the cluster. In the Calculation Poller Custom Cutoff Period, enter the number of minutes that calculation poller will treat data buckets as valid. Calculation Poller Custom Cutoff Period field can range between 5 minutes to 120 minutes (2 hours). The default value is 5 minutes.
This field allows an administrator to define a duration between this range. The Calculation Poller looks for data for the indicators if the current values are not available. By updating this field, it affects all Calculation Poller devices on the next poll. For example, if a calculation object is comprised of two SNMP indicators that are normally polled every 5 minutes and, one of those indicators is no longer available, then the Calculation Poller uses the last available value for that indicator. This will prevent calculation objects from returning null values but may result in calculated values that do not accurately reflect the raw data.
When a customized cutoff period is not used for Calculation poller, SevOne-polld dynamically assigns an availability cutoff period of x2 the device's polling frequency.Since the default polling period is 5 minutes, devices that derive data from non-polled sources such as, xStats, may require the use of a custom cutoff period to avoid null calculation values when current data is not available.
-
If SevOne-polld fails to poll the device, an admin may select the criteria required for a device to be considered unavailable. Under Device Unavailability by Plugin Type, configure the following fields.
-
Select Criteria for Device Unavailability drop-down and choose the desired criteria.
-
All - Marks devices as unavailable if all of the checked plugins are found unavailable.
-
Any - Marks devices as unavailable if any of the checked plugins are found unavailable.
-
-
Select the SNMP check box to select the SNMP plugin.
-
Select the ICMP check box to select the ICMP plugin.
-
-
Click Save to save the Poller settings.
Ports
The Ports subtab enables you to define the port settings for communication between peers in the cluster.
-
The Primary/Secondary Port field displays the TCP port for communication between the Primary appliance and the Secondary appliance in a Hot Standby Appliance peer pair. Do not change. This port is for internal use.
-
The Alert Server Port field displays the port for alerts. Do not change. This port is for internal use.
-
In the Trap Receiver Port field, enter the UDP port number on the SevOne appliance to listen for incoming SNMP traps.
-
The SevOne-gui-installer Port field displays the TCP port number required for SevOne-gui-installer. The default value is 9443. You may change the port number to any other valid value. The port will get opened automatically if firewall is enabled on the system. After changing the port, you must go to Cluster Manager > Cluster Upgrade and click on Run Installer to generate the new URL.
-
Click Save to save the Ports settings.
Requestd
The Requestd subtab allows you to configure SevOne-requestd runtime parameters for the cluster.
-
The Responder Queue Size field allows you to set the number of responder tasks to queue up. Maximum number of queries from remote peers that queue up for the local peers to reply to, as the responder threads become available. The default value is 400. The queue size can range between 400 and 1200.
-
The Local Threads field allows you to set the maximum number of worker threads used for internal requestd requests made to the local appliance. The default value is 200. The threads can range between 200 and 600.
-
The Originator Threads field allows you to set the maximum number of worker threads from the originator. These threads are used for executing the requests from the local appliance (the originator) to the remote appliances. The originator threads are requests that distribute tasks to other peers. The default value is 200. The threads can range between 200 and 600.
-
The Responder Threads field allows you to set the maximum number of threads used for responding to remote requests from other appliances. The default value is 200. The threads can range between 200 and 600.
-
The Requestd Module Originator ZMQ Timeout field allows you to set the timeout for the originator ZMQ process that handles the requestd queries. 0 minutes indicates no timeout. Timed out queries are discarded, resulting in query failure. Lowering the timeout may help requestd from exhausting threads due to excessively long queries or network conditions that may cause ZMQ to wait indefinitely. Setting the value too low may cause reports that are expected to take a long time to run, to timeout or display impartial results. The valid values are 0 minutes (for no timeout) or 15 - 1440 minutes. The default value is 0 minutes.
-
Click Save to save the Requestd settings.
IMPORTANTThese settings are provided to support advanced NMS troubleshooting. NMS administrators are strongly discouraged from making changes to these settings without first contacting SevOne Support. Improper changes to these settings may cause service degradation or disruption.
When you save the requestd settings, you will get the following warning message.
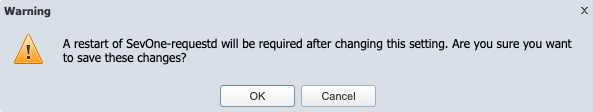
Click OK to save the settings or Cancel to exit.
Security
The Security subtab enables you to define security settings.
-
In the Inactivity Timeout field, enter the number of minutes a user can remain inactive before SevOne NMS automatically logs the user out of the application (between 5 and 86400). The default is 30. You can override this setting for each individual user from the User Manager.
-
Select the Enable Hard Timeout check box to enable hard timeout for all users in the cluster with the exception of the admin user. Enable the check box to allow you to enter the number of minutes in Hard Timeout field the user can remain alive before SevOne NMS automatically logs them out of the application. The default value is 30 minutes. Hard Timeout field can range between 5 minute to 86400 minutes (60 days).
-
In the Minimum Password Length field, enter the number of characters users must have in their password (between 0 and 99). The default is 0. Enter 0 (zero) to disable this feature.
-
In the Enforce Password History field, enter the number of password changes a user must make before they can repeat a password (between 0 and 999). The default is 0.
-
In the Minimum Password Age field enter the number of days a user must wait between password changes (between 0 and 999). The default is 0. This feature prevents users from circumventing Password History enforcement. Enter 0 (zero) to disable this feature.
-
In the Password Change Notification field, enter the number of days to wait after a password change before a user receives a password change notification (between 0 and 999). The default is 0. Enter 0 (zero) to disable this feature.
-
In the Maximum Password Age field, enter the number of days a user account can remain enabled before the user must change their password (between 0 and 999). The default is 0. Enter 0 (zero) to disable this feature.
-
Select the Mask Read Community String check box to mask Read Community Strings on user interfaces. Write Community Strings are masked by default.
-
Select the Require Strong Passwords check box to enforce the complexity of user passwords. If you select this check box, passwords must contain at least one special character !@#$%^&*=+_?<>/~()-[{]}|\;:", and at least two of the following three types of characters: lowercase letters, UPPERCASE letters, and numbers. In addition, passwords cannot contain more than two of a given type of character in succession (upper and lowercase letters count as the same type). An example of a valid password: 8s0h43o@7!o&p3. If your current password does not meet this requirement, you will be forced to change the password at the next log on.
-
Select the Require Strong Passwords for mysql users check box to enforce the complexity of MySQL user passwords. If you select this check box, minimum length of the MySQL password must be at least 14 symbols long, contain at least one special character +-_@[]:,.%, at least one number, at least one UPPERCASE letter, and at least one lowercase letter. The valid characters are a-z, A-Z, 0-9, +-_@[]:,.%. The invalid characters are *$!#^;&. An example of a valid password: 8s0H43o@7]o%p3. Current MySQL passwords that do not meet this requirement will be changed to a random, compliant password.
By selecting the check box, the following warning message will appear. Please read the warning message and proceed with caution.
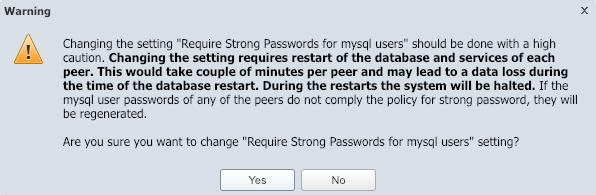
Select No to make no changes.
Select Yes will require a restart of the MySQL database and services of each peer. Click on Save button to apply the changes. This action may result in you intermittently losing access to SevOne NMS User Interface as the MySQL services are being restarted. Depending on the cluster and load per appliance, times will vary.
Log in to the SevOne NMS via the Command Line Interface (CLI) as user root to check the progress of the restart of mysqld services. Execute the command below.
Check mysqld services restart progress$ SevOne-peer-do"supervisorctl status mysqld mysqld2"Example: View status of MySQL services$ SevOne-peer-do "supervisorctl status mysqld mysqld2"
--- Gathering peer list...
--- Running command on 10.168.116.40...
Authorized uses only. All activity may be monitored and reported.
mysqld RUNNING pid 14358, uptime 0:00:12
mysqld2 STARTING
Connection to 10.168.116.40 closed.
[ OKAY ]
--- Running command on 10.168.117.67...
Authorized uses only. All activity may be monitored and reported.
mysqld RUNNING pid 5043, uptime 1:21:47
mysqld2 RUNNING pid 5085, uptime 1:21:36
Connection to 10.168.117.67 closed.
[ OKAY ]
--- Running command on 10.168.118.17...
Authorized uses only. All activity may be monitored and reported.
mysqld RUNNING pid 17089, uptime 1:20:49
mysqld2 RUNNING pid 17206, uptime 1:20:35
Connection to 10.168.118.17 closed.
[ OKAY ]
--- Running command on 10.168.117.30...
Authorized uses only. All activity may be monitored and reported.
mysqld RUNNING pid 16234, uptime 1:19:51
mysqld2 RUNNING pid 16355, uptime 1:19:36
Connection to 10.168.117.30 closed.
[ OKAY ]The processes are seen in transition between RUNNING and STARTING but you have to wait until all the peers have the mysqld and mysqld2 services in RUNNING state and the uptime is seen as close to the current time. The ones highlighted in red have still not restarted and are yet to be processed - the process is performed one peer at a time.
Example: Completion of MySQL services after restart on all appliances$ SevOne-peer-do "supervisorctl status mysqld mysqld2"
--- Gathering peer list...
--- Running command on 10.168.116.40...
Authorized uses only. All activity may be monitored and reported.
mysqld RUNNING pid 14731, uptime 0:04:35
mysqld2 RUNNING pid 14873, uptime 0:04:13
Connection to 10.168.116.40 closed.
[ OKAY ]
--- Running command on 10.168.117.67...
Authorized uses only. All activity may be monitored and reported.
mysqld RUNNING pid 22565, uptime 0:02:58
mysqld2 RUNNING pid 22800, uptime 0:02:43
Connection to 10.168.117.67 closed.
[ OKAY ]
--- Running command on 10.168.118.17...
Authorized uses only. All activity may be monitored and reported.
mysqld RUNNING pid 9207, uptime 0:01:54
mysqld2 RUNNING pid 9267, uptime 0:01:33
Connection to 10.168.118.17 closed.
[ OKAY ]
--- Running command on 10.168.117.30...
Authorized uses only. All activity may be monitored and reported.
mysqld RUNNING pid 7949, uptime 0:00:38
mysqld2 RUNNING pid 7996, uptime 0:00:23
Connection to 10.168.117.30 closed.
[ OKAY ]This indicates that the setting for Require Strong Passwords for mysql users is now enabled.
If the password was not already set for the MySQL user, or if the existing password did not meet the secure complexity requirements, then SevOne NMS will automatically set a password that meets these requirements, but the actual password may not be known to the user. In such cases, you can optionally change the password and meet the complexity requirements. Please refer to SevOne Data Platform Security Guide, section Change MySQL User Credentials for details on how to change the MySQL user credentials.
-
Select the Allow Forcelogin check box to enable SevOne NMS integration with other software applications via the Forcelogin script.
-
Select the Force Same Origin Policy check box to prevent SevOne NMS from being loaded outside of the current domain. This includes portals and the use of the force login script to load SevOne NMS into an iframe from where a malicious user could log a user's activity. Note: If you clear this check box, the application security is lowered in a way that can prevent SevOne NMS from passing specific security scans.
-
Select the Rest API Validate Certificates check box to enforce REST API to validate the certificates of the other appliances when calling their REST API services.
-
Select the Require HTTPS check box to require a secure connection for all dynamic content. You must log on via HTTPS to enable this check box.
-
Select the Allow insecure code in Simple attachment check box for SevOne NMS administrators to allow/disallow usage of custom code in the Simple attachments.
-
Enable render graph security option, when unchecked, allows the administrator to share the exact URL (for example, http://<SevOne NMS IP address>/doms/graphs/renderGraph.php?is[]=1%3A7983%3A471642%3A834×pan=Today) of the report with a user who has more restrictive (reduced) permissions. The user can enter the exact URL in the browser to view the entire contents of the report. However, for security reasons, it is highly recommended that this option is always checked to prevent users with more restrictive (reduced) permissions from crafting the URL to view a report.
-
Select Set samesite to strict check box to set SameSite cookie, session.cookie_samesite, to strict. By default, the check box is unchecked. i.e., SameSite cookie, session.cookie_samesite, is set to lax.
By selecting the check box, the following warning message will appear. Please read the warning message and proceed with caution.
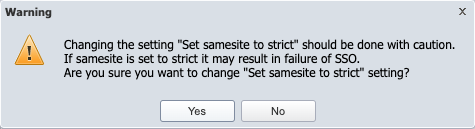
-
In the Account Lockout section:
-
In the Disable Inactive Users field, enter the number of days a user can go without logging on before their account is disabled (between 0 and 999). The default is 0. Enter 0 (zero) to disable this feature, so that inactive users will never be disabled.
Note: This setting does not affect the Guest users you define on the Authentication Settings page for LDAP, TACACS, and RADIUS; nor does it affect the “admin” user.
-
In the Threshold field, enter the number of incorrect log on attempts a user can make (within the Counter Reset time span) before the account is locked. Enter 0 (zero) to disable this feature. Note: When you set this to anything other than 0 (zero), log on becomes dependent upon validation from the cluster leader peer. If the cluster leader peer is not accessible from a peer on which a user attempts to log on, access to the application will not be available. The minimum value is 0 attempts and the maximum value is 99999 attempts.
-
If you enter a number in the Threshold field, in the Counter Reset field, enter the number of minutes during which the user enters an incorrect user name and password combination before the account is locked. Set this to 0 (zero) to disable this feature. Example: Enter 3 as the Threshold and 2 as the Counter Reset. If the user incorrectly enters their user name and password combination three times in a two minute time span, the account is locked for the number of minutes you enter in the Duration field. The minimum value is 0 minutes and the maximum value is 99999 minutes.
-
If you enter a number in the Threshold field, in the Duration field, enter the number of minutes for the account to be locked after the Threshold/Counter Reset combination is exceeded (between 0 - minimum value and 99999 - maximum value). The default is 0.
-
-
Click Save to save the Security settings.
SFTP
The SFTP subtab enables you to define the SFTP destination settings for SevOne NMS to use when you send a report via SFTP. For details, please refer to section Report Properties in SevOne NMS User Guide.
-
In the Server field, enter the IP address or host name of the SFTP server where SevOne NMS is to send reports.
-
In the Port field, enter the port to which SevOne NMS is to send reports.
-
In the Username field, enter the user name SevOne NMS needs to authenticate onto the SFTP server.
-
In the Password field, enter the password SevOne NMS needs to authenticate onto the SFTP server.
-
In the Path field, enter the path to the location on the SFTP server where you want the report to be sent.
-
Click Test SFTP Settings to verify that your SFTP settings work correctly.
-
Click Save to save the SFTP settings.
SNMP
The SNMP subtab enables you to define the SNMP settings for devices on which you enable the SNMP Plugin. You can override these settings for individual devices from the Edit Device page. For details, please refer to sections SNMP Plugin and Edit Device in SevOne NMS User Guide.
-
Select the Strictly Support RFC 2233 check box to enforce strict support of RFC 2233. When the check box is selected, it means the following.
-
for interfaces that operate at 20 Mbps or less, 32-bit byte and packet counters must be used.
-
for interfaces that operate faster than 20 Mbps and slower than 650 Mbps, 32-bit packet counters and 64-bit octet counters must be used.
-
for interfaces that operate at 650 Mbps or faster, 64-bit packet counters and 64-bit octet counters must be used.
The 64-bit counters are only used when the 32-bit counters do not provide enough capacity. When 64-bit counters are in use, the 32-bit counters must still be available. They will report the low 32-bits of the associated 64-bit count.
Certain combinations of Strictly Support RFC 2233 and Counter Preference can result in data loss.
If Strictly Support RFC 2233 check box is not selected, it means that strict RFC 2233 Support is not used.
-
-
Select the SNMP Version Lock check box to use the version of SNMP you select. This prevents the SNMP plugin from trying to determine the proper version if the version you select fails.
-
Select the Discover Max PDUs for Devices check box to attempt to discover the maximum data packet size allowed by devices.
SNMP Protocol Data Unit, or SNMP PDU, data types are complex and specific to SNMP. The PDU field contains the body of an SNMP message. SevOne NMS uses two PDU types, GetRequest and SetRequest, which hold the necessary data to get and set parameters.
-
Click the Counter Preference drop-down. This setting controls how the SNMP plugin determines what counter type (32 bit or 64 bit) to choose. If you select the Strictly Support RFC 2233 check box, this setting does not apply to in and out utilization for interfaces.
Certain combinations of Strictly Support RFC 2233 and Prefer 64-bit Counters can result in data loss.
-
Allow Both - use both 64-bit and 32-bit counters for an object.
-
Prefer 64-bit - if interfaces are under 20Mbps, 64-bit counters are not used when 32-bit counters are available. If the interfaces are over 20 Mbps, 32-bit counters are not used when 64-bit counters are available.
-
Prefer 32-bit - use 32-bit counters.
-
-
The Synchronization Objects section lets you specify whether to poll objects that are administratively or operationally down. You can override these settings on a per-object basis using the Object Manager. Please perform the following actions.
The OIDs that specify the administrative and operational status of an object are part of the object type definition.
-
Select the Administrative State check box to hide and not poll objects that are administratively down. Leave clear to poll administratively down objects normally. The Object Manager enables you to override this setting on a per object basis. For details, please refer to section Object Manager in SevOne NMS User Guide.
-
Select the Operational State check box to hide and not poll objects that are operationally down. Leave clear to poll operationally down objects normally. The Object Manager enables you to override this setting on a per object basis.
-
-
The Default Community Strings section displays the SNMP community strings to use during discovery. The field on the left (Read Community Strings) displays the list of read-community string in the sequence of precedence and the field on the right (Write Community Strings) displays the write strings in the sequence of precedence. When SevOne NMS discovers a device and attempts to poll SNMP data, the first string in the list is tested. If that string fails, the subsequent strings are tested, in sequence, until a string is successful. The successful community string appears on the Edit Device page for the device. For details, please refer to section Edit Device in SevOne NMS User Guide.
-
In the Read Community Strings field and the Write Community Strings field, click Add to add a new row in the list.
-
Enter the community string and click Update.
-
Repeat the previous steps to add additional strings.
-
Click the up / down arrows under Actions to move the string up or down in the list. The discovery process goes through the list sequentially.
-
-
Click Save to save the SNMP settings.
Storage
The Storage subtab enables you to define the size of items in the system.
Changes to these settings can cause data loss. Please consult with your SevOne Support Engineer before you modify these settings.
-
In the Data Retention field, enter the number of days' worth of data to store. The default/recommended value is 365 days. Increasing this value means that the physical storage requirements will be much greater. The minimum value is 1 day and the maximum value of 730 days.
Data retention greater than 365 days is not supported. SevOne recommends you contact SevOne Support before you click Yes to proceed.
-
In the Maximum Disk Utilization field, enter the percentage of disk space to allocate for the storage of poll data (between 80 and 100 percent). The default is 95 percent, which is recommended. Leave some disk space for logs and flow data. The FlowFalcon subtab (described above) enables you to define FlowFalcon raw data retention.
-
Click Save to save the Storage settings.
Syslog
The Syslog subtab enables you to define where SevOne NMS is to send Syslog data. You can override the cluster level Syslog destination at the peer level from the Peer Settings tab described later in this topic.
-
Click Add Syslog Destination or click
 to add or edit a Syslog destination.
-
In the Destination Name field, enter the name of the host/destination device to which to send the Syslog data.
-
In the IP Address field, enter the IP address of the host/destination device.
-
Click the Protocol drop-down and select TCP or UDP or TLS for the port type to which to send Syslog data.
-
In the Port field, enter the port number to which to send Syslog data.
-
Click Update to save the destination.
-
Repeat to add additional destinations to the list.
-
Click Save to save the Syslog settings.
Syslog Destinations can be created, modified, or deleted using the Command Line Interface (CLI) as well.
$ SevOne-act syslog-destination [create, delete, update]To create a syslog destination, provide the following options.
|
Flags |
Description |
|
--uid |
(Required) The id of the user executing the action. |
|
--peer-id |
(Optional) The ID of the peer for which the destination is to be created.
|
|
--name |
(Required) Unique name for the syslog destination. |
|
--host |
(Required) The host of the syslog destination. |
|
--protocol |
(Required) The protocol for the syslog communication. |
|
--port |
(Required) The port of the remote syslog. |
To update (modify) a syslog destination, provide the following options.
|
Flags |
Description |
|
--uid |
(Required) The id of the user executing the action. |
|
--peer-id |
(Optional) The ID of the peer for which the destination is to be updated.
|
|
--id |
(Optional) The ID of syslog destination to be updated. |
|
--name |
(Required) Unique name for the syslog destination. |
|
--host |
(Required) The host of the syslog destination. |
|
--protocol |
(Required) The protocol for the syslog communication. |
|
--port |
(Required) The port of the remote syslog. |
To delete a syslog destination, provide the following options.
|
Flags |
Description |
|
--uid |
(Required) The id of the user executing the action. |
|
--peer-id |
(Optional) The ID of the peer for which the destination is to be deleted.
|
|
--id |
(Optional) The ID of syslog destination to be deleted. |
The configured syslog destination(s) are stored in MySQL table, net.syslog_destinations.
+----+--------+-----------+----------+------+| id | name | host | protocol | port |+----+--------+-----------+----------+------+| 1 | banana | 127.0.0.1 | UDP | 100 |+----+--------+-----------+----------+------+
The configured destination(s) are stored in /etc/syslog-ng/conf.d/30-sevone-syslog-destinations.conf, which is part of the syslog-ng configuration.
For the configured syslog destination example above, 30-sevone-syslog-destinations.conf file contains the following .
# 30-sevone-syslog-destinations# This file is auto-generated by "SevOne-act syslog-destination generate-config --uid 1"## DO NOT EDIT THIS FILE MANUALLY# If you need to edit its contents use the Syslog Settings in the Cluster Manager.destination remote-destinations-all { network( "127.0.0.1" transport("UDP") port(100) flags(syslog-protocol) );};log { source(s_sys); destination(remote-destinations-all); };# END 30-sevone-syslog-destinationsThe root (default) configuration can be found in /etc/syslog-ng/syslog-ng.conf where the following section defines the source of the syslog. It specifies that the appliance can take syslog from localhost with port 514.
source s_sys { system(); internal(); udp(ip(127.0.0.1) port(514));};If you want the appliance to get syslog from a remote appliance or would like the appliance to receive syslog but from a different port, you may change the protocol, host, and port number for the source.
Please do not edit the syslog configuration file directly. SevOne recommends one of the following options.
-
Graphical User Interface - Administration > Cluster Manager > Cluster Settings tab > Syslog subtab.
-
Command Line Interface
$ SevOne-act syslog-destination
For additional details, please refer to syslog-ng documentation such as, https://www.syslog-ng.com/technical-documents/doc/syslog-ng-open-source-edition/3.22/administration-guide/12.
Topology
The Topology subtab enables you to manage which topology sources are discovered for each device type.
-
- Topology source discovered for the selected device type.
-
- Topology source not discovered for the selected device type.
You can discover topology sources independently at each level of the device type hierarchy.
-
Select a device type in the Device Types hierarchy in the field on the left.
-
Slide the toggle to enable or disable discovery of each topology source for the device type you select.
-
Repeat for each device type in the hierarchy.
-
Click Save to save the Topology settings.
Tracing
This feature is for Internal Use Only for the Support Team to use for troubleshooting.
Trap Collector
The Trap Collector subtab enables you to define the trap collector settings for devices.
Changes to these settings can cause data loss. Please consult with your SevOne Support Engineer before you modify these settings.
-
In the Threads field, enter the number of trap-handling threads to use. Each thread handles one trap at a time. The minimum value is 1 thread and the maximum value is 99 threads. The default value is 10 threads.
-
In the Update Interval field, enter the number of seconds for how often the trap collector updates the event information and caches data. The default value is 300 seconds. The minimum value is 1 second and the maximum value is 300 seconds.
-
Click Save to save the Trap Collector settings.
WMI Proxies
The WMI Proxies subtab enables you to define the WMI proxy servers for the WMI plugin use to poll WMI data and provides links to the WMI Proxy service and the .NET 3.5 Framework software you need to install on the proxy server. Please refer to section Enable WMI and to section WMI Plugin in SevOne NMS User Guide for details.
-
In the WMI Proxies section, click Add WMI Proxy or click
to add or edit a WMI proxy server.
-
In the Name field, enter the name of the proxy server.
-
In the IP Address field, enter the proxy server IP address.
-
In the Port field, enter the port for the proxy server to use to communicate with SevOne NMS (default – 3000).
-
Select the Encryption Support check box to allow support for encrypting the password. Enable the check box to allow you to enter the password in Encryption Password field.
-
On the pop-up, click Save.
-
Repeat the previous steps to define additional WMI proxy servers.
-
Click Save to save the WMI Proxy settings.
Downloads
The Downloads section includes the SevOne NMS WMI Proxy service file and the .NET 3.5 Framework installation file. On the WMI proxy server, run the .NET 3.5 Framework setup.exe if needed, then run the SevOne WMI Proxy Setup.msi to install the SevOne NMS WMI Proxy service.
-
The SevOne NMS WMI Proxy file installs a Windows service on the Windows device you designate to act as the proxy to perform WMI queries. Click the WMIProxy Download Installation Package link and save the file to the proxy device.
-
If the proxy device is not running the Microsoft .NET 3.5 framework, click the .NET 3.5 Framework Download Installation Package link to download the .NET installation package setup.exe file.
Follow the steps below to use the encryption capability for WMI traffic.
-
Download the file from SevOne NMS > Administration > Cluster Manager > Cluster Settings > WMI Proxies > click on Download Installation Package.
-
Send the downloaded file to the same server/computer where you have it previously running.
-
Uninstall the WMI Proxy (if one exists).
-
Install the new version of the WMI Proxy.
-
Enable the Encryption Support field.
-
Enter the Encryption Password.
SevOne provides a Windows native proxy to ensure speed and integrity of Windows native metrics.
The functionality with encryption is:
SevOne(encryption/decryption) ↔ Encrypted Traffic ↔ WMI Proxy(encryption/decryption) ↔ Polled Windows device (when encryption is enabled/supported)
-
Cluster Upgrade
-
For Self Service Upgrades, SevOne requests the customer to raise a proactive ticket to make SevOne Support aware that the customer will be performing this. By doing this, SevOne Support can assist the customer with the upgrade preparation and readiness.
-
Self-Service Upgrades may result in a potential IP address overlap between the customer's network and SevOne's Docker IP address range 172.17.0.0/16. If this conflicts with the customer's network, please refer to SevOne NMS Upgrade Guide note titled Change 'docker0' interface Subnet .
-
If there are Solutions such as SD-WAN, WiFi, and SDN present on your cluster, then please check the product Compatibility Matrix on SevOne Support Customer Portal before proceeding with the upgrade.
-
For add-ons/customizations, please engage SevOne's Platform Services team before the upgrade.
Click
Cluster in the cluster hierarchy on the left and select the Cluster Upgrade tab on the right to upgrade the cluster using the graphical user interface. This tab will contain all the details for the SevOne NMS Graphical User Interface installer and the upgrade history.
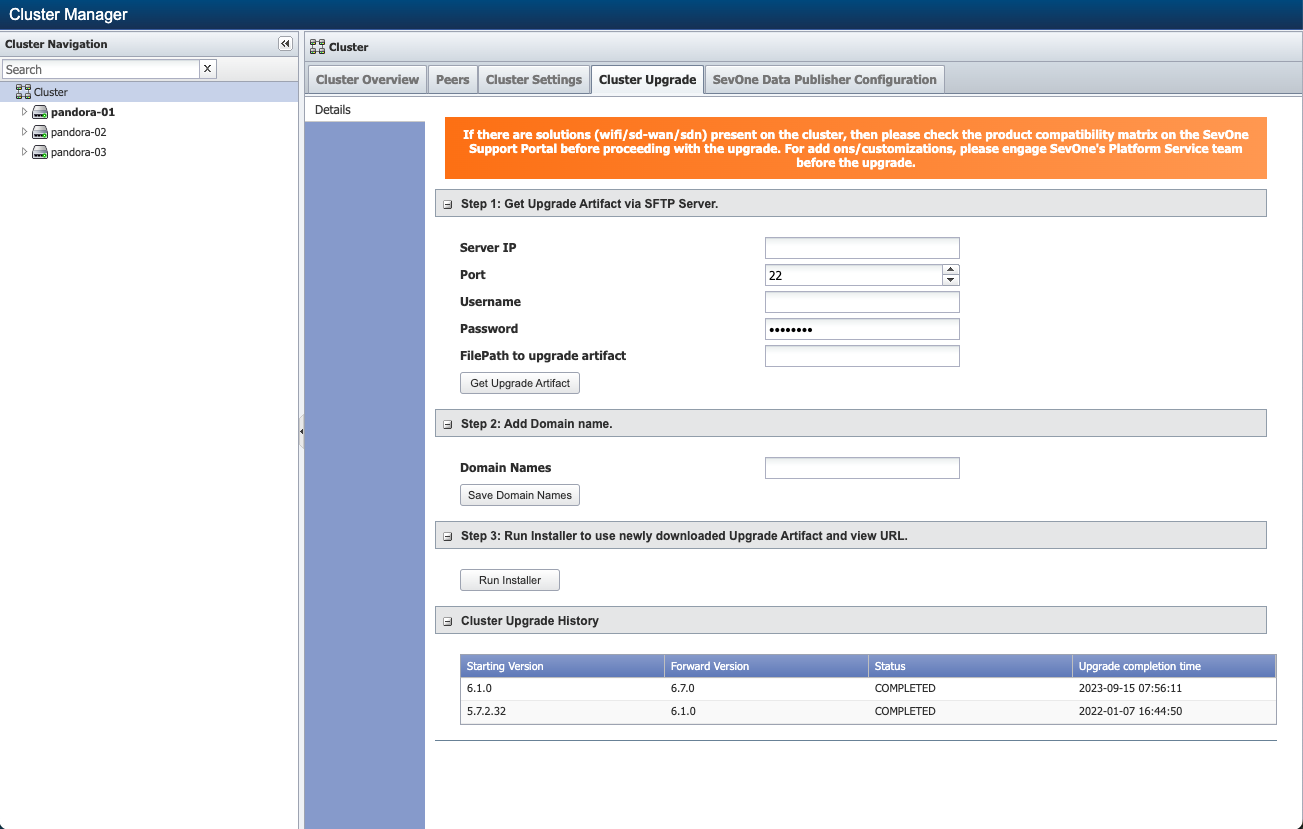
Get Upgrade Artifact via SFTP Server
Enter the values in the following fields for the SevOne NMS being upgraded.
-
Server IP - The IP Address or hostname of the SFTP server for SevOne NMS to use.
-
Port - The port number on which the SFTP server is running on the remote server. The default value is port 22. SevOne NMS will send the reports to this port.
-
Username - The username for copying the artifact from the remote server.
-
Password - The password SevOne NMS needs to authenticate onto the SFTP server.
-
FilePath to upgrade artifact - The path to the artifact on the remote SFTP server from where you wish to download the tar file. The user must have read permissions to the artifact.
-
Click on Get Upgrade Artifact button to get the artifact to be used by SevOne NMS for the upgrade. The artifact is put in /opt directory of the Cluster Leader.
If you have already configured the SFTP server on Cluster Manager > Cluster Settings tab > SFTP subtab, the same will be fetched except for the path. You may use the same server or configure a different one here.
Depending on the size of the artifact, this step may take some time.
In case you do not have SFTP, you may copy the artifacts directly to Cluster Leader's /opt directory.
Add Domain Name
Enter the value in the following field for the SevOne NMS being upgraded.
-
Domain Names - Enter comma separated domain names without https://. For example, test.sevone.com,test2.sevone.com.
-
Click Save Domain Names button to save the domain names.
Run Installer
Run Installer may take several minutes to respond. Please do not cancel or retry. While loading, it checks for the .tar files available for the update and also, sets the Graphical User Interface installer service.
After the upgrade artifact is downloaded, you can upgrade the installer with the latest version available in the artifact. Click on the Run Installer button and the following will be processed in the background.
-
The latest installer from the artifact is extracted.
-
The installer is upgraded to the latest version.
-
A URL for the installer is generated.
You may proceed to the generated URL to initiate the upgrade via the Graphical User Interface.
By default, the installer runs on port 9443. However, you may change the port and reconfigure the installer to run on any port. To change the port on which the Graphical User Interface installer runs, go to Cluster Manager > Cluster Settings tab > Ports subtab. You may change the SevOne-gui-installer Port to any value desired. If cluster-wide firewall setting is enabled, this will automatically add the new port to the allowed ports list.
Login and upgrade are only allowed if you have administrative permissions.
Cluster Upgrade History
This section shows the cluster upgrade history for all the previous upgrades done using the Graphical User Interface installer. The following details are available.
-
Starting Version - The SevOne NMS version of the cluster prior to the upgrade.
-
Forward Version - The SevOne NMS version of the cluster that it is upgraded to.
-
Status - The status of the upgrade. i.e., it indicates whether the upgrade is in progress, successful, or has failed.
-
Upgrade completion time - This field shows the time it took to complete the upgrade.
Hotpatches
When you click Run Installer button, it will return the hotpatch available on the system, if any.
 SevOne NMS 6.0.2 is available to upgrade. To access the SevOne GUI Installer, proceed to https://10.129.14.168:9443 with admin credentials.
Click the URL and perform the Self-Service Upgrade. Please refer to SevOne NMS Upgrade Process Guide > section Self-Service Upgrade for details.
If there is no hotpatch available on the system, you will see a message as shown below in the example.
No upgrade available. To access the SevOne GUI installer, proceed to https://10.129.14.168:9443 with admin credentials.
Hotpatches are cumulative. For example, lets say there are two hotpatches, 6.0.1 and 6.0.2. If 6.0.1 contains a fix for A, 6.0.2 must contain the fix for A and B.
The following details are available.
-
Action - informs the action performed with the hotpatch. It can be an action to install or revert.
-
Jira # - provides the Jira ticket number to reference to for details.
-
Description - provides the description.
-
Fix version - the version in which the fix is made generally available.
-
Date installed - provides the date when the installation was performed.
-
Installed by - provides the name of the person who performed the action. For example, admin.
Example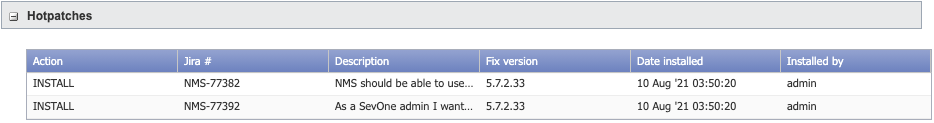
SevOne Data Publisher Configuration
SevOne Data Publisher configuration using the Graphical User Interface:
-
does not support SevOne Data Publisher's historical replay
-
backs-up existing configuration file on upgrade; any other configurations are not backed-up
-
writes/overwrites /etc/sevone/sdp/config.yml file and /etc/sevone/sdp/schema.json file on each node in the cluster
While running SevOne Data Publisher, if any changes are made to its configuration via the Graphical User Interface, new changes will not be applied automatically in config.yaml file. You must select the publisher, set it as default, and restart SevOne Data Publisher service on all nodes.
-
Select the Enable SevOne Data Publisher GUI configuration check box to allow user to configure SevOne Data Publisher through the interface and generate a configuration file.
By selecting the check box, the following warning message will appear. Please read the warning message and proceed with caution.
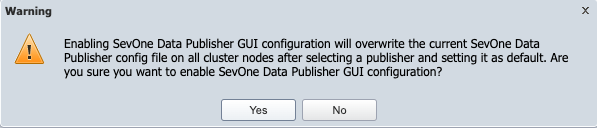
-
If you click Yes in the Warning message above, the following configuration capabilities become available.
-
Export SDP configurations
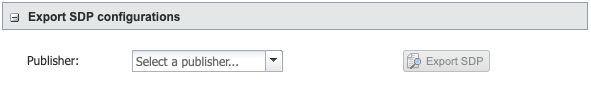
-
Click the Publisher drop-down and select a publisher from the list.
-
Click Export SDP to allow the admin to export existing SevOne Data Publisher configurations as a downloadable file. For example, SDP Configurations.spk file.
-
-
Import SDP configurations
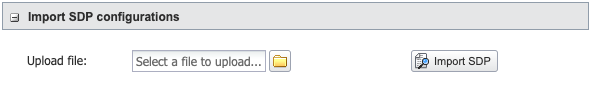
-
Upload file - click
 to import the SevOne Data Publisher file (.spk file) from the directory where it can be uploaded from.
-
Click Import SDP to allow the admin to import a file containing SevOne Data Publisher configurations to a cluster.z
If the same file is uploaded again or if a file with the same name is uploaded, the imported file is created with a unique name. For example, SDP Configurations.spk becomes SDP Configurations (1).spk.
-
-
Output Schema
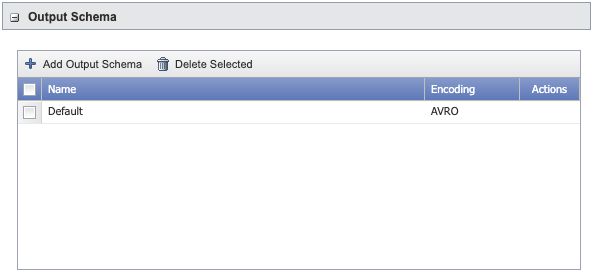
By default, an output schema is available with output format, AVRO, and all indicator fields selected. For additional schemas, click Add Output Schema.
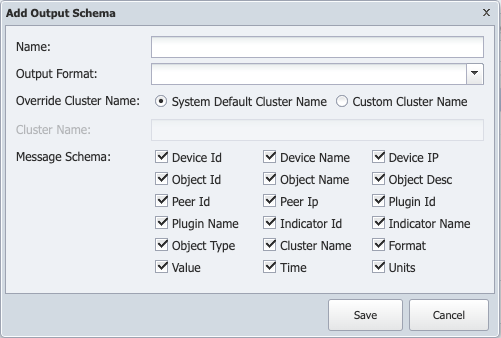
-
In the Name field, enter the name for the output schema.
-
Click the Output Format drop-down and select one of the following options.
-
AVRO - When using avro, you can configure the JSON schema to customize the fields that SevOne Data Publisher exports.
-
JSON - When using JSON, all of the message schema fields are exported.
Fields Cluster Name and Message Schema are only available when Output Format selected is AVRO. Schema file is not used for output format, JSON.
-
-
Select an option for Override Cluster Name.
-
Select System Default Cluster Name option to use the system cluster name.
-
Select Custom Cluster Name option to enter a custom cluster name in field Cluster Name.
-
-
By default, all indicators are selected in field Message Schema. You may choose to unselect one or more indicators.
-
Click Save to save the output schema.
Example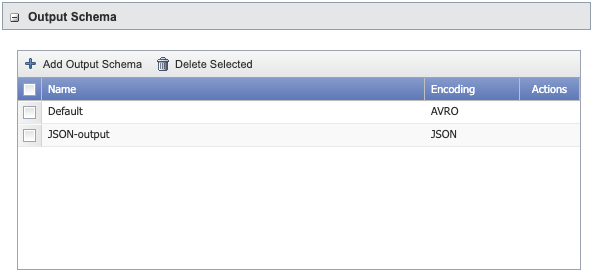
To delete an output schema, click Delete Selected.
-
-
System Config
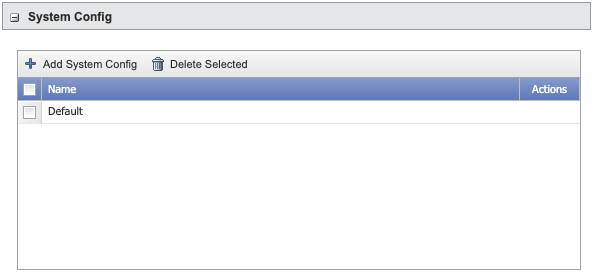
A system configuration is created by default. For additional system configurations, click Add System Config.
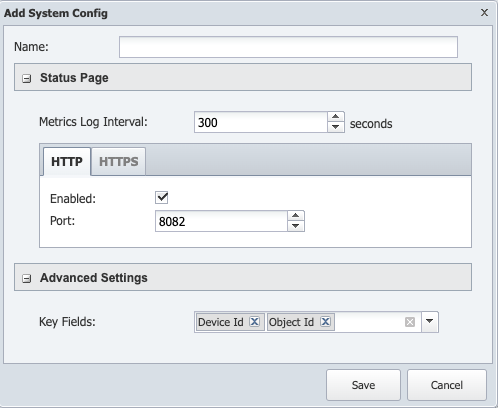
-
In the Name field, enter the name for the system configuration.
-
Status Page
-
In the Metrics Log Interval field, enter the number of seconds for how often the metrics must be updated. The minimum value is 60 seconds and the maximum value is 360000 seconds. The default value is 300 seconds.
-
Under tab HTTP (default),
-
Select the Enabled check box to enable HTTP status page.
-
In the Port field, enter the port number SevOne Data Publisher status page runs on. The default port is 8082.
-
-
Under tab HTTPS,
-
Select the Enabled check box to enable HTTPS status page.
-
In the Port field, enter the secure port that the SevOne Data Publisher status page runs on. The default port is 8443.
-
In the Private Key Password field, enter the private key password.
-
In the Server Cert Path field, enter the path to the server certificate.
-
In the Server Key Path field, enter the path to the server key.
-
-
-
Advanced Settings
-
Click the Key Fields drop-down to select one or more indicators to use with Kafka hashing. The default is Device Id, Object Id.
-
-
Click Save to save the system configuration.
Example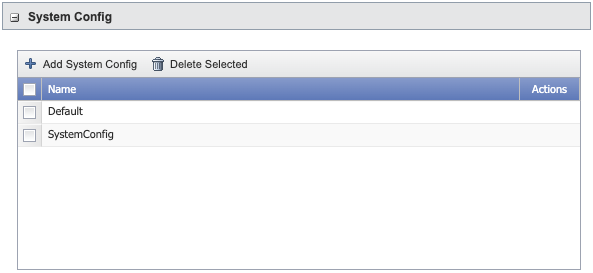
To delete a system configuration, click Delete Selected.
-
-
Filter
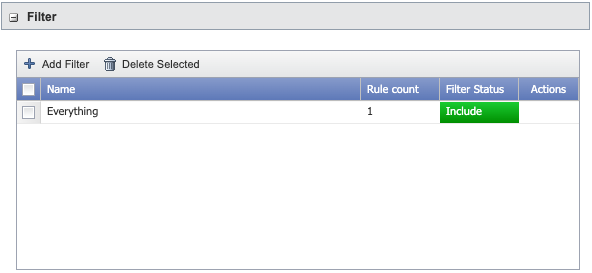
By default, a filter named Everything is created. For additional filters, click Add Filter.
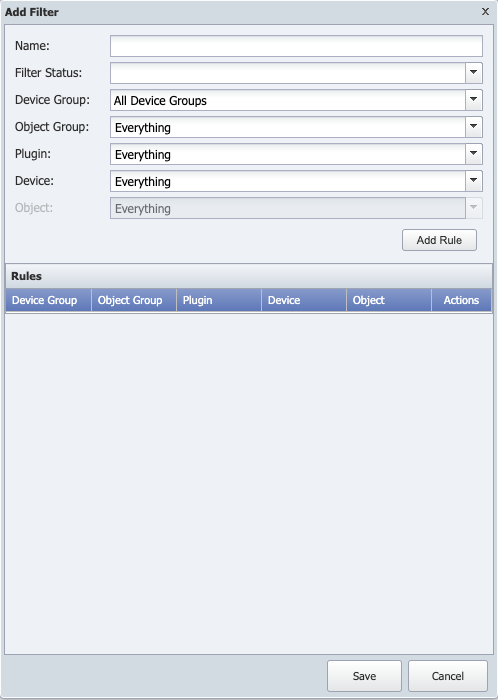
-
In the Name field, enter the name for the filter.
About filters and rules-
There are two classes of filter in SDP - Include filters (allowlist) and Exclude filters (blocklist).
-
A filter consists of a name and a list of rules.
-
A rule consists of a group of 5 attributes.
-
Device Group ID (devGrpID)
-
Object Group ID (objGrpID)
-
Device ID (devID)
-
Object ID (objID)
-
Plugin ID (pluginID)
-
-
The attribute value is either the ID of the particular attribute or -1 indicating that all IDs are matched. By default, the attribute value is -1. If an attribute is not specified in a rule, its default value is assumed.
-
Within the rule, the attributes are combined in a logical AND operation.
For example, the rule {devGrpID = 4, objID = 7} is the same as {devGrpID = 4, objGrpID = -1, devID = -1, objID = 7, pluginID = -1} and means indicators with device group 4 and object ID 7 will be matched. -
Within the rule list, the rules are combined in a logical OR operation.
For example, the rule list [{devID=5},{devID=6, pluginID=3}] is the same as [{devGrpID = -1, objGrpID = -1, devID = 5, objID = -1, pluginID = -1},{devGrpID = -1, objGrpID = -1, devID = 6, objID = -1, pluginID = 3}] and means indicators with device ID 5 or indicators with device ID 6 and pluginID 3 will be matched. -
Exclude filters are applied first to remove indicators that match the filter, then the include filters are applied to select matches from the remaining indicators.
-
-
Click the Filter Status drop-down and select one of the following options.
-
Include - For allowlist filter rules.
-
Exclude - For blocklist filter rules.
-
-
Click the Device Group drop-down and select the device group.
-
Click the Object Group drop-down and select the device group.
-
Click the Plugin drop-down and select the device group.
-
Click the Device drop-down and select the device. Based on the device selected, you can choose an object from the Object drop-down.
-
Click Add Rule to add a new rule.
-
Click Save to save the filter.
Example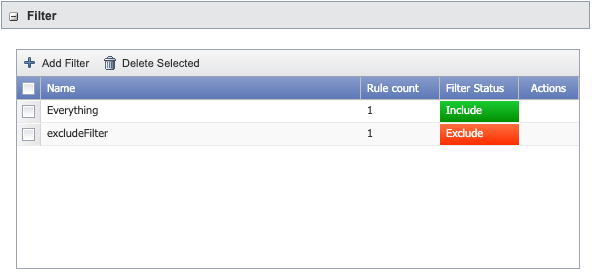
To delete a filter, click Delete Selected.
-
-
Destination
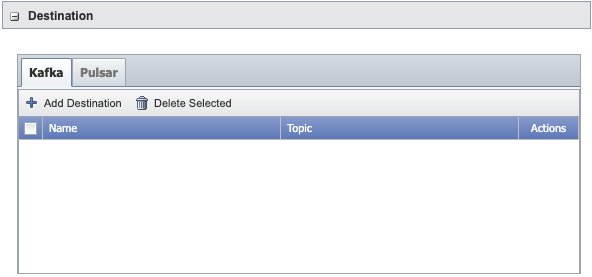
To add Kafka destination, click Add Destination from Kafka tab to set the Kafka producer configuration settings.
Add Destination for Kafka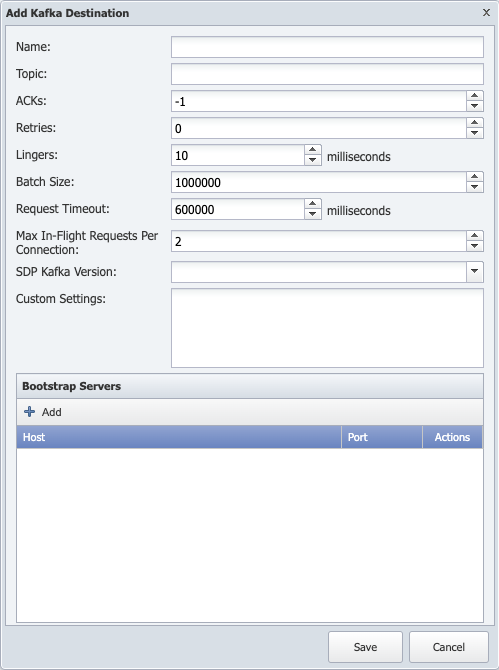
-
In the Name field, enter the name for the Kafka destination.
-
In the Topic field, enter the name of the Kafka topic that SevOne Data Publisher writes to. For example, sdp.
-
In the ACKs field, select the number of acknowledgements that the leader must receive before a request is considered complete. The default is -1 and is considered to be the most robust, albeit slowest, option. The available values are -1, 0, and 1. For additional details, please refer to https://kafka.apache.org/documentation/#producerconfigs_acks.
-
In the Retries field, select the number of times to retry sending a failed message. The default is 0. The minimum value is 0 and the maximum value is 100.
-
In the Lingers field, enter the amount of time in milliseconds for messages to remain in the producer queue before message batches are created. The default is 0 milliseconds. The minimum value is 0 milliseconds and the maximum value is 300 milliseconds.
-
In the Batch Size field, enter the number of messages in the batch. The default is 1000000. The minimum value is 1000 and the maximum value is 9999999.
-
In the Request Timeout field, enter the amount of time in milliseconds that the client will wait for a request response. The default is 600000 milliseconds. The minimum value is 1000 milliseconds and the maximum value is 1800000 milliseconds.
-
In the Max In-Flight Requests Per Connection field, enter the maximum number of unacknowledged requests sent to a broker. The default is 2. The minimum value is 1 and the maximum value is 10.
-
Click SDP Kafka Version drop-down to choose the SDP Kafka version from the list. In most cases, this field can be set to auto. It should only be set to a specific Kafka version from the drop-down list where the feature requires it to ensure compatibility in the rare edge cases.
-
In the Custom Settings field, enter additional settings that are passed through to Kafka. For a complete list of parameters supported, please refer to SevOne NMS System Administration Guide > SevOne Data Publisher > Broker Configuration > Kafka > section Producer. For additional details, please refer to https://kafka.apache.org/documentation/#producerconfigs.
-
To add Bootstrap Servers, click Add. Enter the hostname or IP address in the Host field (for example, 10.129.13.10) and enter the port number in the Port field. Port TCP 9092 is the default port number. Click Update to add.
-
Click Save to save the Kafka destination.
To delete a Kafka destination, from Kafka tab, click Delete Selected.
To add Pulsar destination, click Add Destination from Pulsar tab.Add Destination for Pulsar
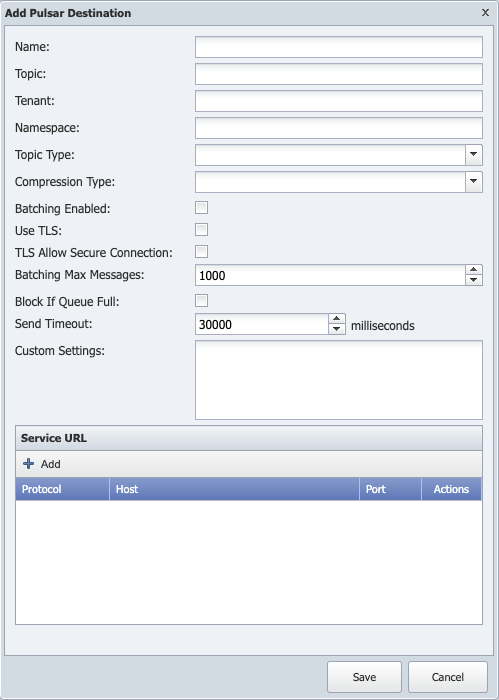
-
In the Name field, enter the name for the Pulsar destination.
-
In the Topic field, enter the name of the Pulsar topic that SevOne Data Publisher writes to. For example, sdp.
-
In the Tenant field, enter the Pulsar service tenant name.
-
In the Namespace field, enter the Pulsar service namespace.
-
Click the Topic Type drop-down and select one of the following options.
The Topic Type indicates whether the Pulsar broker stores messages on persistent storage for later consumption or stores messages in non-persistent storage.
-
Persistent - The messages are stored in the secondary storage (disk, SSD, etc.). There is some cost in terms of overhead and latency, but messages will be present if the broker is restarted.
-
Non Persistent - The messages are stored in the primary storage (RAM). It offers higher performance for real-time messages at the cost of lost messages when the broker is restarted.
-
-
Click the Compression Type drop-down and select one of the following options to set the compression type for the producer.
-
ZLIB
-
LZ4
-
ZSTD
-
-
Select the Batching Enabled check box to enable batching.
-
Select Use TLS check box to use TLS.
-
Select TLS Allow Secure Connection check box to allow a secure TLS connection.
-
In the Batching Max Messages field, enter the maximum number of messages permitted in a batch. The default is 1000. The minimum value is 300 and the maximum value is 9999.
-
Select Block If Queue Full check box for send operations to block when the outgoing message queue is full. For additional details, please refer to the following links.
-
In the Send Timeout field, enter the amount of time in milliseconds for which Pulsar will wait to report an error if a message is not acknowledged by the server. The default is 30000 milliseconds. The minimum value is 18000 milliseconds and the maximum value is 1000000 milliseconds.
-
In the Custom Settings field, enter additional settings that are passed through to Pulsar. For a complete list of parameters supported by pulsar producer and client, please refer to SevOne NMS System Administration Guide > SevOne Data Publisher > Broker Configuration > Pulsar > sections Producer and Client respectively.
-
To add Service URL, click Add. By default, Protocol is pulsar+ssl. Enter the hostname or IP address in the Host field (for example, 10.129.13.10) and enter the port number in the Port field. Port TCP 6651 is the default port. Click Update to add.
-
Click Save to save the Pulsar destination.
Example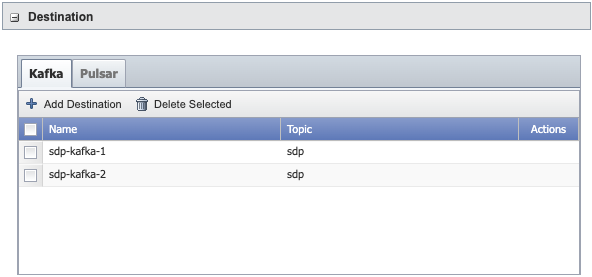
To delete a Pulsar destination, from Pulsar tab, click Delete Selected.
-
-
Publisher
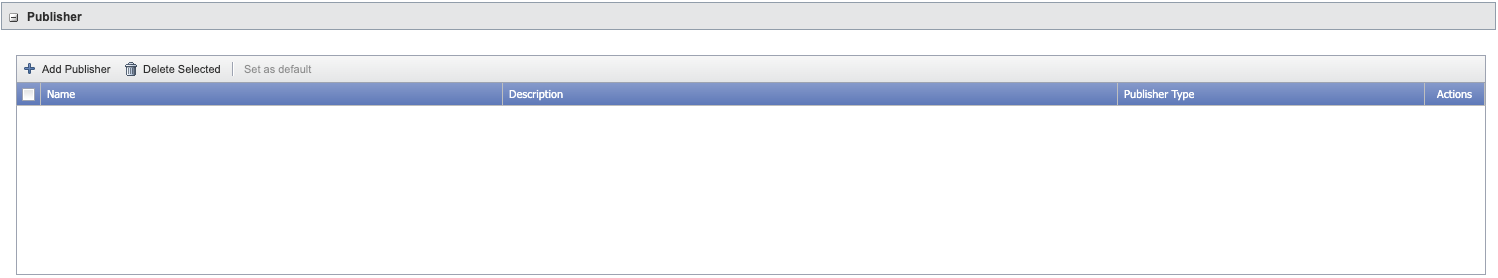
After Output Schema, System Config, Filter, and Destination are configured, you are now ready to add a publisher. Click Add Publisher.
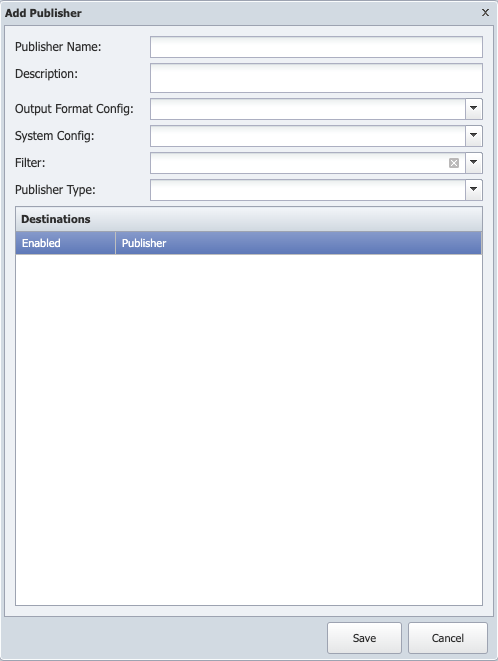
-
In the Publisher Name field, enter the name for the publisher.
-
In the Description field, enter the description for the publisher being added.
-
Click the Output Format Config drop-down and select one from a list of Output Schemas available.
-
Click the System Config drop-down and select one from a list of System Configurations available.
-
Click the Filter drop-down and select one from a list of Filters available.
-
Click the Publisher Type drop-down and select one of the following options.
-
Kafka
-
Pulsar
-
-
Once all the fields are entered, it will provide you with the list of destinations defined. Enable one or more destinations from the list.
Example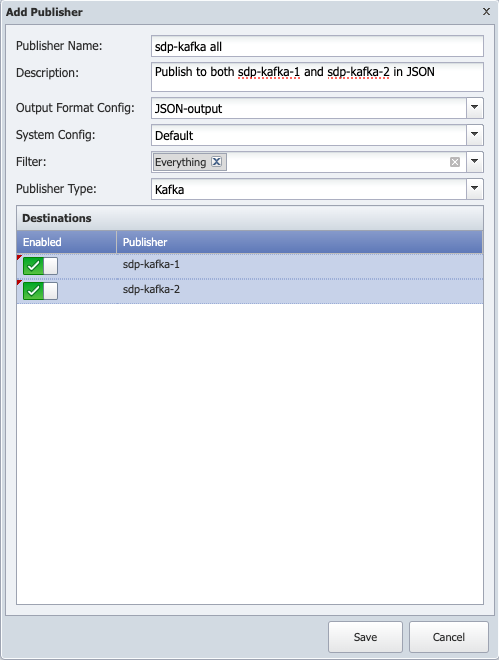
-
Click Save to save the publisher.
Example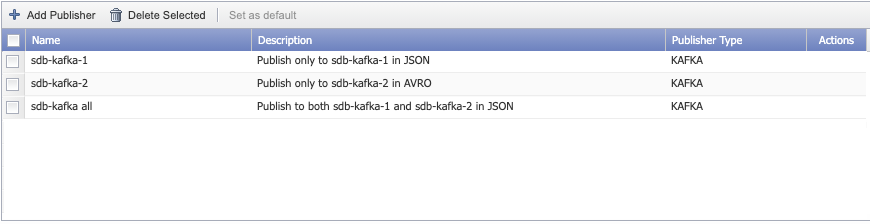
To delete a publisher, click Delete Selected.
You are now ready to select a publisher from the list.
-
Select a publisher.
-
Set as default button becomes available.
-
Click Set as default button and you will get the following pop-up.
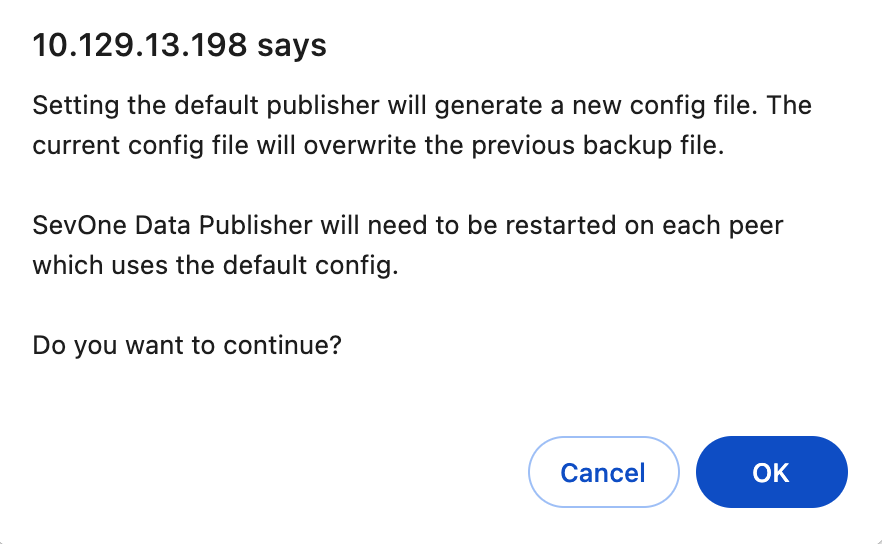
Click OK to continue.
SevOne Data Publisher configuration has been generated. To apply this configuration, SevOne Data Publisher must be restarted. To restart SevOne Data Publisher, click
<peer name> in the cluster hierarchy in the left navigation bar. Select the Peer Settings tab > SevOne Data Publisher subtab. Please follow the steps in section SevOne Data Publisher to restart.
-
-
Peer Level - Peer Overview and Peer Settings
<peer name> - Select a peer in the hierarchy on the left side of the Cluster Manager. The cluster leader peer name displays at the top of the peer hierarchy in bold font and other peers display in alphabetical order.
The following tabs appear on the right side to enable you to view peer level information and to define peer level settings.
-
Peer Overview - Enables you to view peer level information.
-
Peer Settings - Enables you to define settings that are peer specific.
Click on the peer name that displays above the Peer Overview tab to display a pop-up that enables you to rename the peer.
Peer Overview
Click
<peer name> in the cluster hierarchy on the left and select the Peer Overview tab on the right to view peer level information.
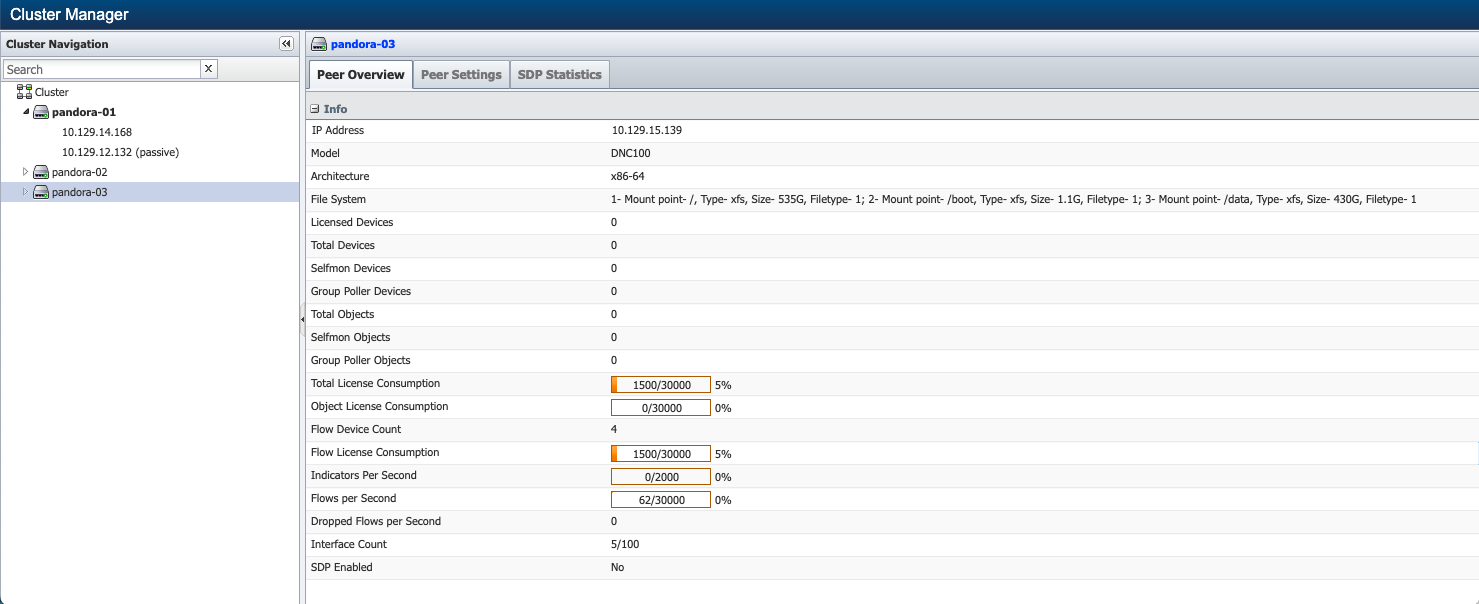
-
IP Address - Displays the IP address of the peer.
-
Model - Displays the actual SevOne NMS appliance model: PAS = Performance Appliance Solution, DNC = Dedicated NetFlow Collector, vPAS = Virtual Performance Appliance Solution. For example, PAS5K, PAS60K, ..., PAS200K, DNC1000, etc.
-
Architecture - Displays the architecture used for the peer. For example, x86-64.
-
File System - Displays the file system you are on. The preferred file system is XFS built on CentOS. It provides the ability to detect undesirable file systems so that you can migrate / rebuild to use a more supportable file system.
-
Licensed Devices - Displays the number of devices the peer discovers and polls. The Device Manager enables you to manage devices. The Licensed Devices count is equal to (Total Devices - (Selfmon Devices + Group Poller Devices)) in the peer. For details, please refer to section Device Manager in SevOne NMS User Guide.
-
Total Devices - Displays the total number of Licensed, Selfmon, and Group Poller devices in the peer.
-
Selfmon Devices - Displays the number of Selfmon devices in the peer.
-
Group Poller Devices - Displays the number of Group Poller devices in the peer.
-
Total Objects - Displays the total number of objects polled from the selected peer along with Selfmon and Group Poller objects. The Object Types page, Object Rules page, and Object Manager enable you to manage the number of polled objects.
-
Selfmon Objects - Displays the number of Selfmon objects in the peer.
-
Group Poller Objects - Displays the number of Selfmon objects in the peer.
-
Total License Consumption - Displays the sum usage of objects and flow. This displays the number of flows and objects the peer is licensed to use and the percentage of the license capacity your peer uses.
-
Object License Consumption - Displays the number of objects the peer uses, the number of objects the peer is licensed to use, and the percentage of the license capacity the peer uses.
-
Flow Device Count - Displays the number of flow device count in the peer.
-
Flow License Consumption - Displays the number of flows the peer uses, the number of flows the peer is licensed to use, and the percentage of the license capacity the peer uses.
-
Indicators Per Second - Displays the total number of indicators the peer receives per second from all objects and interfaces along with backfilled data from net.deviceipsinfo table.
-
Flows per Second - Displays the total number of flows the peer receives per second from all interfaces.
-
Dropped Flows per Second - Displays the number of flows dropped per second in the peer.
-
Interface Count - Displays the flow interfaces available and its capacity in a peer.
-
SDP Enabled - Displays whether SevOne Data Publisher is enabled or disabled for the peer.
Processed Flows + Dropped Flows = Number of Flows licensed (because these statistics are rolling averages, the total may be off slightly). The flow statistics display a weighted, rolling average of the flow data over the past hour, before duplication*, along with the number of processed flows to assist with peer capacity management. The processed flow data does not factor in malformed flows nor the flows you deny via a rule on the Flow Rules page.
*Several pages display flow statistics. The flow statistics that each page displays are used for different purposes. Each page uses a different way to calculate flow data, mainly because v5 NetFlow only exports information about the incoming interface. SevOne NMS duplicates the flow statistics for v5 NetFlow to factor for outgoing flows on devices that use v5 NetFlow in reports but does not duplicate flow statistics for v5 NetFlow for license object consumption.
-
The Cluster Manager calculates flow data without duplication for v5 NetFlow and uses a one hour rolling average.
-
The Flow Interface Manager duplicates v5 NetFlow and displays the flow data for the past one minute.
-
FlowFalcon reports duplicate v5 NetFlow and calculate flow data based on the report settings. For details, please refer to section FlowFalcon Reports in SevOne NMS User Guide.
Peer Settings
Click
<peer name> in the cluster hierarchy on the left and select the Peer Settings tab. Subtabs appear along the left side of the Peer Settings tab to enable you to define peer specific settings.
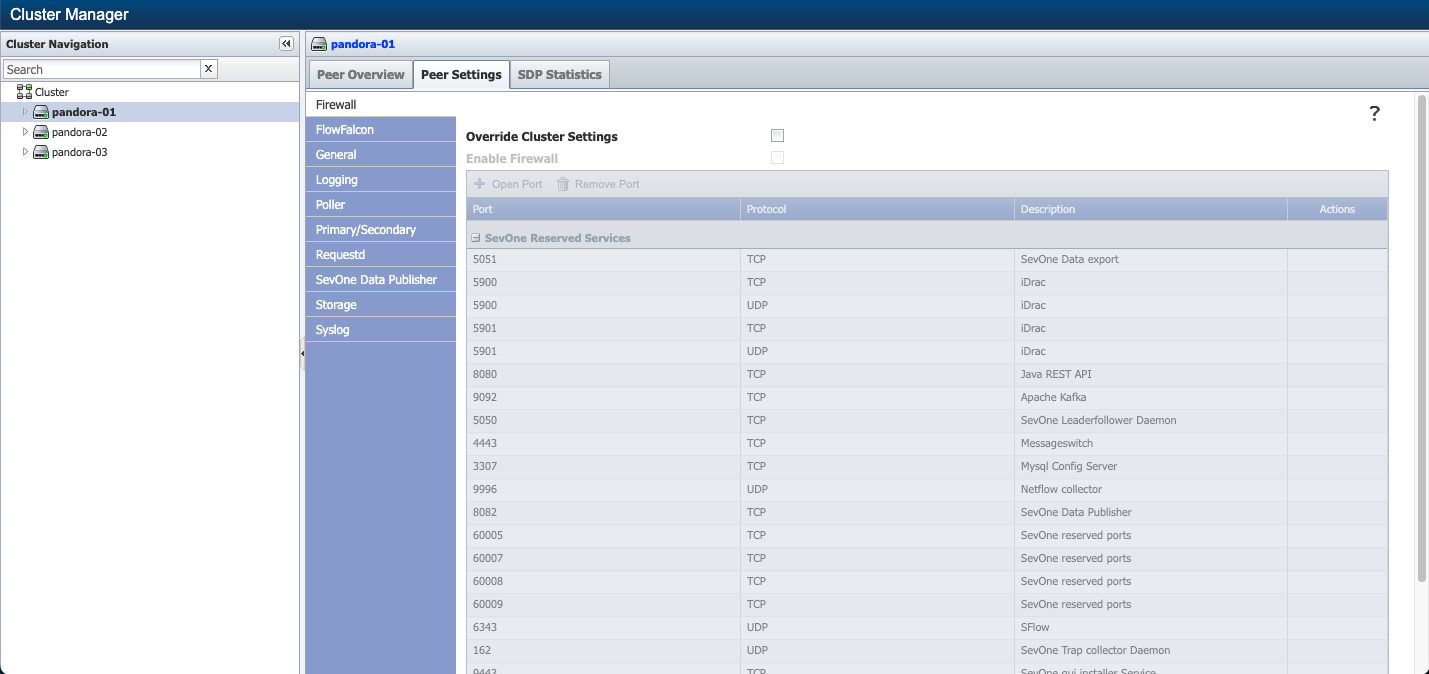
Firewall
The Firewall subtab enables you to select the firewall service for the selected peer.
Select the Override Cluster Settings check box to override cluster-level firewall settings with firewall settings at the selected peer-level. When Override Cluster Settings field is enabled, Enable Firewall field is available. Click the check box to enable the firewall service for the selected peer. It is disabled by default.
Also, Open Port becomes available. Click on Open Port to add the firewall port for the selected peer and Remove Port removes user-added ports only.
FlowFalcon
The FlowFalcon subtab enables you to define the retention of aggregated flow data on the peer for use in FlowFalcon reports. You define raw flow duration on the Cluster Manager at the cluster level as described earlier in this topic. For details, please refer to section FlowFalcon Reports in SevOne NMS User Guide.
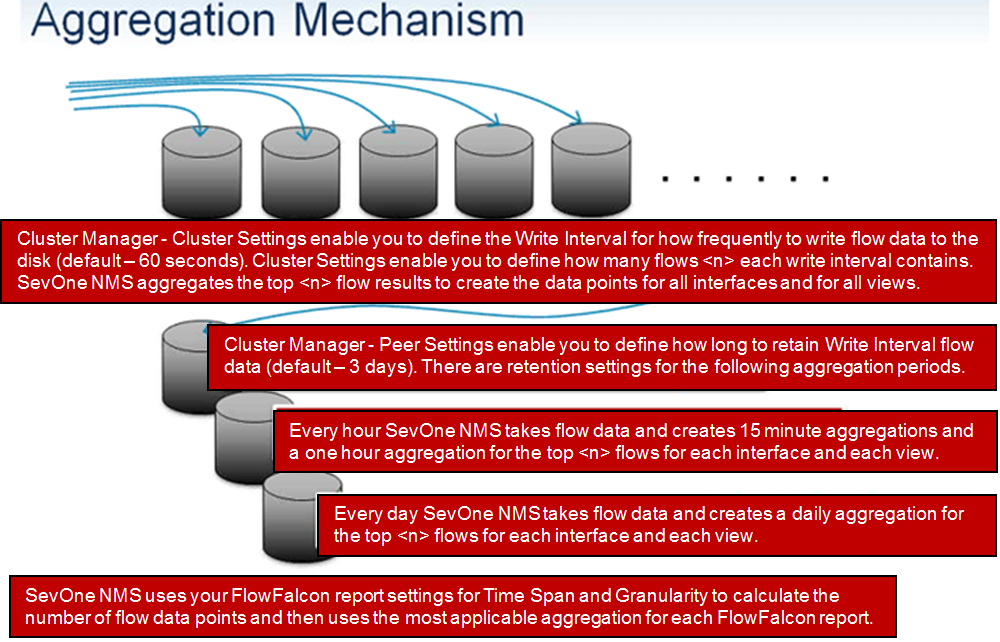
Changes to these settings can cause data loss. Please consult with your SevOne Support Engineer before you modify these settings.
-
In the Write Interval Duration field, enter the number of days’ worth of <write interval> aggregated flow data to store for calculations. The default is 3 days. The <write interval> is defined in Cluster Settings tab > FlowFalcon subtab. Please see details above.
-
In the Fifteen Minutes field, enter the number of days' worth of fifteen minute aggregation data to store for calculations. Every hour, SevOne NMS takes the flow data and creates one 1 hour aggregation data points for each of the top flows for each interface and each view. The default value is 7 days. The minimum value is 0 days.
-
In the One Hour field, enter the number of days' worth of one hour aggregation data to store for calculations. Every hour, SevOne NMS takes the flow data and creates four 15 minute aggregation data point for each of the top flows for each interface and each view. The default value is 90 days. The minimum value is 0 days.
-
In the One Day field, enter the number of days' worth of one day aggregation data to store for calculations. Every hour, SevOne NMS takes the flow data and creates one 1 day aggregation data point for each of the top flows for each interface and each view. The default value is 365 days. The minimum value is 0 days.
-
Click Save to save the FlowFalcon peer settings.
General
The General subtab enables you to add a tunneling proxy server for each peer to use for HTTP poll requests and proxy information for VMware requests. This subtab also enables you to schedule when the peer is to perform the automatic discovery function.
-
In the HTTP Proxy section, in the HTTP Proxy Server field, enter the full URL of the HTTP server you want the peer to poll for data from devices on which you enable the HTTP plugin. This field is applicable when your implementation includes a HTTP proxy server and the URL must have a valid format with a port number. For details, please refer to section HTTP Plugin in SevOne NMS User Guide.
Examplehttp://www.yourproxyserver.com:portnumber/
-
In the VMware Proxy section, the following fields enable you to define how peers communicate with each other to collect VMware data from the VMware plugin. For details, please refer to section VMware Plugin in SevOne NMS User Guide.
-
In the Port field, enter the port on the proxy for the peer to use to collect the VMware data from other peers.
-
In the Username field, enter the user name the peer needs to authenticate onto the proxy.
-
In the Password field, enter the password the peer needs to authenticate onto the proxy. The password must be <= 8 characters long.
-
-
In the Automatic Discovery section: the following fields enable you to schedule when to run the Automatic Discovery process.
-
In the Days field, click the day tab for each day to run the automatic discovery. Automatic discovery runs on the days that appear dark blue. You must schedule automatic discovery to occur at least once every week. You should run automatic discovery daily at a time when the application is least used.
-
Click the Time drop-downs to enter the automatic discovery start time.
-
Click the Time Zone drop-down and select a time zone.
-
Click Discover Now to run automatic discovery now.
-
-
Click Save to save the General peer settings.
Logging
The Logging subtab enables you to manage which user actions are to create log entries. You can view log entries on the Cluster Manager at the appliance level on the System Logs tab. See the Processes and Logs topic for a list of the system logs to where log entries are made.
This subtab enables you to override the cluster level Logging settings for an individual peer. Select the Override Cluster Setting check box to enable the following fields.
-
- User actions are logged.
-
- User actions are not logged.
Some user action log functionality is dependent upon your software kernel version being higher than 2.6.36. On the Administration > About page, click PHP Status under Status Information to find your kernel version.
-
applianceSettingManaged - Cluster Manager Appliance Settings creates log entries when a user changes a setting on the Cluster Manager Appliance Settings tab.
-
clusterManaged - Cluster Manager Appliance Management creates log entries when a user performs actions such as database synchronization, fail over, etc. from the gear menu at the appliance level on the Cluster Manager.
-
commandExecuted - Console Command Execution creates log entries when a user executes a command in the Linux terminal.
-
configFileModified - System Configuration Files creates log entries when various system configuration files are modified.
-
devicePluginEntityManaged - Device Editor Plugin Object Managers creates log entries when a device plugin object manager (e.g. "DNS Objects", "ICMP Objects" or "HTTP Objects") is modified.
-
devicePluginManaged - Device Editor Plugin Settings creates log entries when a user modifies the plugin settings for a device on the Add/Edit Device page.
-
discoveryManaged - Discovery Management creates log entries when a user queues a device discovery, changes discovery priority or cancels discovery.
-
entityManaged - General Management triggers when a user creates, updates, deletes, enables or disables devices, alerts, thresholds, policies, users, trap destinations, and others.
-
entityMappingManaged - Association Management creates log entries when a user modifies associations of device/object groups, nested device/object groups, user roles, trap destinations or metadata mapping.
-
fileUploaded - File Upload Management creates log entries when a file has been uploaded to cluster manager upload update file, status maps or device types.
-
importTriggered - Data Import creates log entries when a user imports data via an .spk file.
-
processManaged - Cluster Manager Processes creates log entries when a user starts, stops, or restarts a process from the Process Overview tab on the Cluster Manager.
-
ruleApplied - Membership Rules triggers when a user applies object group and device group membership rules.
-
settingModified - Cluster Manager Settings creates log entries when a user modifies the settings on the Cluster Settings tab or the Peer Settings tab on the Cluster Manager.
-
soapMethodInvoked - SOAP API Call creates log entries when a user invokes a SOAP API call.
-
userAuth - User Authentication creates log entries when a user logs in, logs out or is affected by other authentication events such as inactivity time out or failed login attempts.
-
userPasswordChanged - User Password creates log entries when a user changes their password or an account is created with a new password.
Click Save to save the Logging settings.
Poller
The Poller subtab enables you to define poller settings for the peer.
-
Select the Override Cluster Settings check box to enable the following field.
-
In the Poller Threads field, enter the number of poller threads to use concurrently (between 1 and 1000). The default is 60.
SevOne NMS Appliance Model
Recommended Poller Thread Max
PAS2k
60
PAS5k
60
PAS10k
100
PAS20k
200
PAS60k
300
PAS100k
600
vPAS100k
1000
PAS200k
1000
PAS300k
1000
Poller Thread Max should be set to the smallest size of the SevOne NMS appliance model in the cluster. By not doing so, it may result in resource issues.
Primary/Secondary
The Primary/Secondary subtab enables you to view the IP addresses for the two appliances that act as one SevOne NMS peer in a Hot Standby Appliance (HSA) peer pair implementation. In a Hot Standby Appliance relationship, the active appliance does the normal network polling and the passive appliance pulls the config database data from the active appliance and pulls the data database data from the active appliance to provide redundancy. The passive appliance takes the active role if the active appliance fails. The primary appliance is initially set up to be the active appliance. If the primary appliance fails, it is still the primary appliance but its role changes to the passive appliance. The secondary appliance is initially set up to be the passive appliance. If the primary appliance fails, the secondary appliance is still the secondary appliance but it becomes the active appliance. You define the appliance IP address upon initial installation. Please refer to SevOne NMS Installation Guide for details.
-
In the Primary Appliance IP Address field, view the IP address of the primary appliance.
-
In the Secondary Appliance IP Address field, view the IP address of the secondary appliance.
-
The Virtual IP Address field appears empty unless you implement the primary appliance and the secondary appliance to share a virtual IP address. A virtual IP address is useful when you configure the devices SevOne NMS polls to communicate with a specific appliance IP address because if that appliance fails, the virtual IP address becomes the IP address of what was the passive appliance and the communication from the poller is not blocked because of a different poller IP address.
-
In the Failover Time field, enter the number of seconds for the passive appliance to wait for the active appliance to respond before the passive appliance takes over. SevOne NMS pings every 2 seconds and the timeout for a ping is 5 seconds. The default value is 600 seconds. The minimum value is 1 second.
If you change this setting, you must restart the SevOne Leader / Follower Monitor process for both the active appliance and the passive appliance on the Cluster Manager at the appliance level on the Process Overview tab.
-
Click Save to save the Primary/Secondary peer settings.
Requestd
The Requestd subtab allows you to configure SevOne-requestd runtime parameters for a peer.
-
Select the Override Cluster Settings check box to enable the following fields. It provides local overrides of the requestd settings for the selected peer.
The following settings are provided to support advanced NMS troubleshooting. NMS administrators are strongly discouraged from making changes to these settings without first contacting SevOne Support. Improper changes to these settings may cause service degradation or disruption.
-
In the Responder Queue Size field , enter the number of responder tasks to queue up. Maximum number of queries from remote peers that queue up for the local peers to reply to, as the responder threads become available. The default value is 400. The queue size can range between 400 and 1200.
-
In the Local Threads field, enter the maximum number of worker threads used for internal requestd requests made to the local appliance. The default value is 200. The threads can range between 200 and 600.
-
In the Originator Threads field, enter the maximum number of worker threads from the originator. These threads are used for executing the requests from the local appliance (the originator) to the remote appliances. The originator threads are requests that distribute tasks to other peers. The default value is 200. The threads can range between 200 and 600.
-
In the Responder Threads field, enter the maximum number of threads used for responding to remote requests from other appliances. The default value is 200. The threads can range between 200 and 600.
-
In the Requestd Module Originator ZMQ Timeout field, enter the timeout for the originator ZMQ process that handles the requestd queries. 0 minutes indicates no timeout. Timed out queries are discarded, resulting in query failure. Lowering the timeout may help requestd from exhausting threads due to excessively long queries or network conditions that may cause ZMQ to wait indefinitely. Setting the value too low may cause reports that are expected to take a long time to run, to timeout or display impartial results. The valid values are 0 minutes (for no timeout) or 15 - 1440 minutes. The default value is 0 minutes.
-
Click Save to save the Requestd settings.
When you save the requestd settings, you will get the following warning message.
Click OK to save the settings or Cancel to exit.
SevOne Data Publisher
The SevOne Publisher subtab enables you to choose a publisher and restart SevOne Data Publisher.
-
Select the Enable SevOne Data Publisher check box to enable SevOne Data Publisher.
The following fields are only available if SevOne Data Publisher is enabled.
-
Select the Override Publisher check box to override the default SevOne Data Publisher.
-
Click the Publisher drop-down list and select the publisher you would like to overwrite and restart.
-
Click Save to save the SevOne Data Publisher settings before performing a restart.
-
Click Restart SDP to restart the SevOne Data Publisher.
-
Storage
The Storage subtab enables you to configure storage data retention on an individual peer.
-
Select the Override Cluster Settings check box to enable the following field. This subtab enables you to override Data Retention settings for an individual peer.
-
In the Data Retention field, enter the number of days' worth of data to store. The default/recommended value is 365 days. Increasing this value means that the physical storage requirements will be much greater. The minimum value is 1 day and the maximum value of 730 days.
Data retention greater than 365 days is not supported. SevOne recommends you contact SevOne Support before you click Yes to proceed.
-
Click Save to save the Storage settings.
Syslog
The Syslog subtab enables you to define where this peer is to send Syslog data. This subtab enables you to override the cluster level Syslog destination for an individual peer.
-
Select the Override Cluster Settings check box to enable the following fields.
-
Click Add Syslog Destination or click
to add or edit a Syslog destination.
-
In the Destination Name field, enter the name of the host/destination device to which to send the Syslog data.
-
In the IP Address field, enter the IP address of the host/destination device.
-
Click the Protocol drop-down and select TCP or UDP or TLS for the port type to which to send Syslog data.
-
In the Port field, enter the port number to which to send Syslog data.
-
Click Update to save the destination.
-
Repeat to add additional destinations to the list.
-
Click Save to save the Syslog settings.
To configure syslog destination(s) using the Command Line Interface, please refer to Configure Syslog Destinations.
SDP Statistics
SDP statistics are available only when SevOne Data Publisher is configured using the Graphical User Interface. When configured using the Command Line Interface, SDP statistics are not available.
Click
<peer name>
in the cluster hierarchy on the left and select the
SDP Statistics
tab on the right to view SevOne Data Publisher statistics.
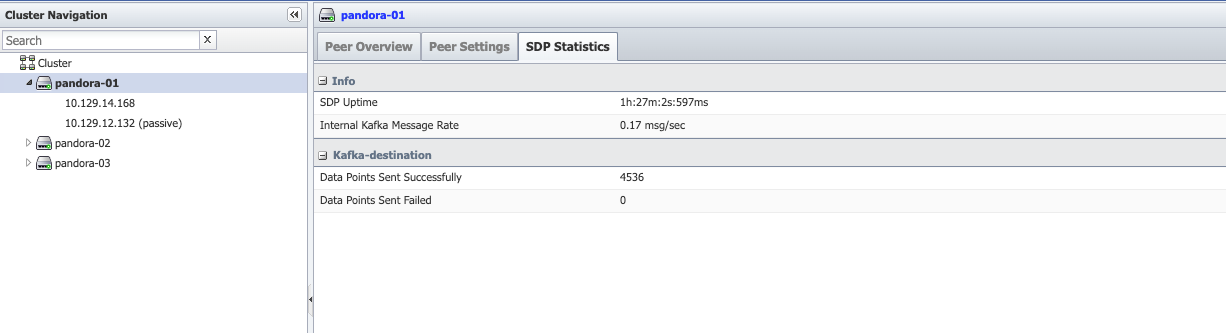
SDP Statistics are available only when SevOne Data Publisher (SDP) is active and running otherwise, no statistics are available. Provides you with key performance indicators (KPIs) such as,
-
SDP Uptime - the amount of time SDP has been running.
-
Internal Kafka Message Rate (per second) - generated by SevOne Data Publisher. This is the number of messages seen since the SDP process started, divided by the amount of time SDP has been running.
-
Data Points Sent Successfully (for each publisher) - generated by SevOne Data Publisher. This is the number of data points processed and sent successfully by the publisher to user's kafka / pulsar.
-
Data Points Sent Failed (for each publisher) - generated by SevOne Data Publisher. This is the number of data points that failed to be processed by the publisher.
Multiple publishers can be defined, and publishers assigned to a specific peer are listed in SDP statistics. Each publisher is used to send data points to the user's kafka / pulsar.
Appliance Level - Appliance Overview, Appliance Settings, System Settings, Process Overview, System Logs, Integration, Appliance License
<peer name> - Click the triangle next to the peer level icon in the hierarchy to display the IP address of the appliance that makes up the peer.
For a Hot Standby Appliance peer pair implementation two appliances appear.
-
The primary appliance appears first in the peer pair.
-
The secondary appliance appears second in the peer pair.
-
The active appliance that is actively polling does not display any additional indicators.
-
The passive appliance in the peer pair displays (passive).
<IP address> - When you click on an appliance IP address in the cluster hierarchy on the left, the following tabs appear on the right to enable you to view appliance level information and to define appliance level settings.
-
Appliance Overview - Enables you to view appliance level information including the status of the replication of the SevOne NMS databases. See below for details.
-
Appliance Settings - Enables you to make the appliance conform to Common Criteria security standards.
-
System Settings - Enables you to read/write the various SevOne-select settings, available from the Command Line Interface, the appliance is using.
-
Process Overview - Enables you to view the list of processes SevOne NMS runs.
-
System Logs - Enables you to view the data SevOne NMS writes to log files.
-
Integration - Enables you to add a new appliance to your cluster as a new peer. If you plan to add a new appliance to your cluster as a Hot Standby Appliance you must contact SevOne Support.
-
Appliance License - Enables you to view SevOne NMS details for the appliance you are logged into.
Database Replication Explanation
The SevOne NMS application peer-to-peer architecture has two fundamental databases.
Config Database - The config database stores configuration settings such as cluster settings, security settings, device settings, etc. SevOne NMS saves the configuration settings you define (on any peer in the cluster) in the config database on cluster leader peer. All active appliances in the cluster pull config database changes from the cluster leader peer config database. Each passive appliance in a Hot Standby Appliance (HSA) peer pair pulls its active appliance's config database to replicate the config database onto the passive appliance.
Data Database - The data database stores a copy of the config database plus all poll data for the devices/objects that the peer polls. The config database on an active appliance replicates to the data database on the appliance. Each passive appliance in a Hot Standby Appliance peer pair pulls its active appliance's data database to replicate the data database onto the passive appliance.
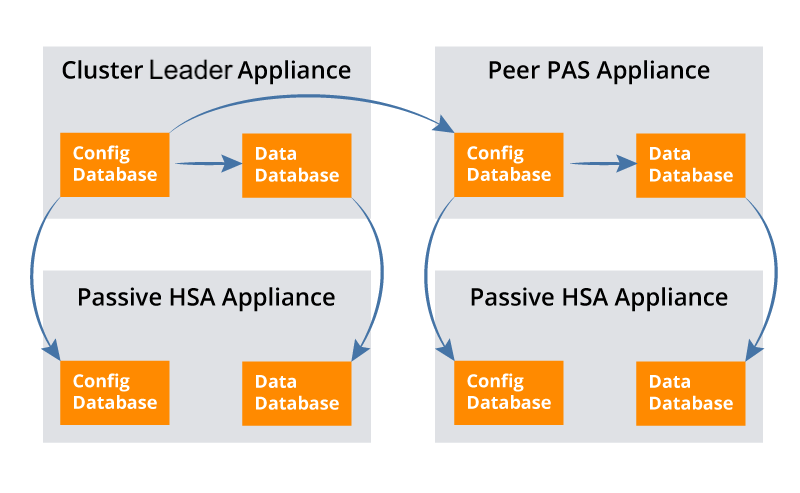
Appliance Level Actions
A  appears above the right side on the Cluster Manager to perform appliance level actions. The options that appear are dependent on the appliance you select in the hierarchy on the left side.
Click
and select the following options.
-
Select Device Summary to display a link to the Device Summary and links to the report templates that are applicable for the device. For details, please refer to section Device Summary in SevOne NMS User Guide.
-
Select Fail Over to have the active appliance in a Hot Standby Appliance peer pair become the passive appliance in the peer pair. This option appears when you select the active appliance in a Hot Standby Appliance peer pair.
-
Select Take Over to have the passive appliance in a Hot Standby Appliance peer pair become the active appliance in the in the peer pair. This option appears when you select the passive appliance in a Hot Standby Appliance peer pair.
-
Select Resynchronize Data Database to have an active appliance pull the data from its own config database to its data database or to have the passive appliance in a Hot Standby Appliance peer pair pull the data from the active appliance's data database.
-
Select Resynchronize Config Database to have an active appliance pull the data from the cluster leader peer's config database to the active peer's config database or to have the passive appliance in a Hot Standby Appliance peer pair pull the data from the active appliance's config database.
-
Select Rectify Split Brain to rectify situations when both appliances in a Hot Standby Appliance peer pair think they are active or both appliances think they are passive. Both appliances in a Hot Standby Appliance peer pair can end up in an active state when the Internet connection between the appliances is interrupted.
-
When you logged on, you received an administrative message that stated either "Neither appliance in your Hot Standby Appliance peer pair with IP addresses <n> and <n> is in an active state." or "Both appliances in your Hot Standby Appliance peer pair with IP addresses <n> and <n> are either active or both appliances are passive."
-
When you select one of the affected appliances in the hierarchy on the left side of the Cluster Manager this option appears.
-
When both appliances think they are passive and you select this option, the appliance for which you select this option becomes the active appliance in the Hot Standby Appliance peer pair.
-
When both appliances think they are active and you select this option, the appliance for which you select this option becomes the passive appliance in the Hot Standby Appliance peer pair.
-
Appliance Overview
Click
next to a peer in the cluster hierarchy on the left side, click <appliance IP address>, and then select the Appliance Overview tab on the right to display appliance level information.
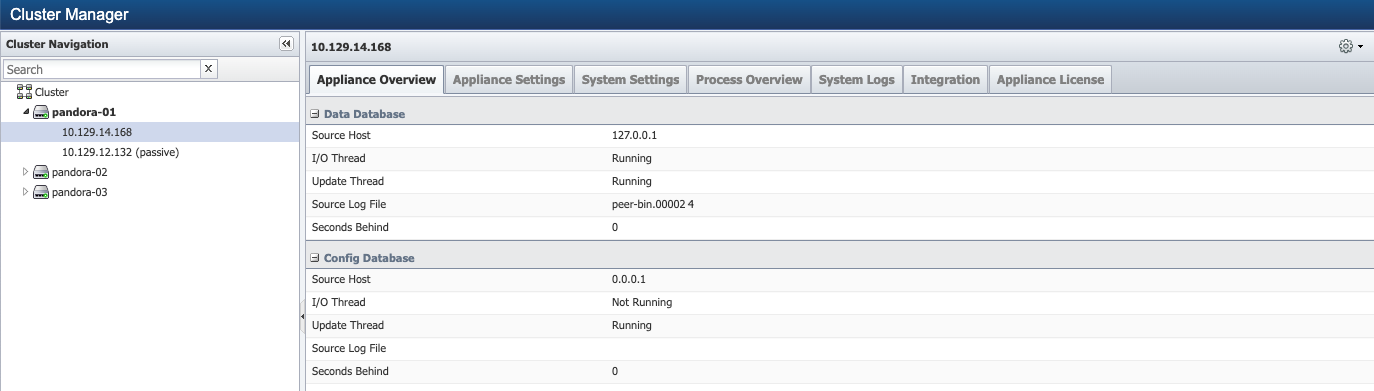
Data Database Information
-
Source Host - Displays the IP address of the source from where the appliance replicates the data database. In a single appliance implementation and on an active appliance, this is the IP address of the appliance itself. HSA passive appliance data database replicates from the active appliance data database.
-
I/O Thread - Displays Running when an active appliance is querying its config database for updates for the data database. Displays Not Running when the appliance is not querying the config database. HSA passive appliance data database queries the active appliance data database.
-
Update Thread - Displays Running when the appliance is in the process of replicating the config database to the data database. Displays Not Running when the appliance is not currently replicating to the data database.
-
Source Log File - Displays the name of the log file the appliance reads to determine if it needs to replicate the config database to the data database.
-
Seconds Behind - Displays 0 (zero) when the data database is in sync with the config database or displays the number of seconds that synchronization is behind.
Config Database Information
-
Source Host - Displays the IP address of the source from where the appliance replicates the config database. In a single appliance implementation and on the cluster leader peer active appliance, this is the IP address of the appliance itself. HSA passive appliance config database replicates from the active appliance config database.
-
I/O Thread - Displays Running when an active appliance is querying the cluster leader peer config database for updates. Displays Not Running when the appliance is not querying the cluster leader peer config database. HSA passive appliance config database queries the active appliance config database.
-
Update Thread - Displays Running when the appliance is in the process of replicating the config database. Displays Not Running when the appliance is not replicating the config database.
-
Source Log File - Displays the name of the log file the appliance reads to determine if it needs to replicate the config database.
-
Seconds Behind - Displays 0 (zero) when the config database is in sync with the cluster leader peer config database or displays the number of seconds that the synchronization is behind.
Appliance Settings
Click
next to a peer in the cluster hierarchy on the left, click <appliance IP address>, and then select the Appliance Settings tab on the right side to define the settings that enable the appliance to meet Common Criteria security standards.
Common Criteria
Prerequisites:
-
The peer cannot be a part of a cluster.
-
The peer cannot have a Hot Standby Appliance.
-
You must log on to the appliance via HTTPS.
-
xStats adapter configuration is not available.
-
Group aggregated indicator features are not available.
Perform the following steps to enable the appliance to meet Common Criteria security standards.
-
Select the Enable Common Criteria check box.
-
Click Save to display a confirmation message pop-up.
-
Click OK on the pop-up to display another confirmation pop-up that informs you that a restart is required to enable Common Criteria mode.
-
Click OK on the second confirmation pop-up to start the Common Criteria enable process and to restart the appliance. If you click Cancel, the common Criteria enable process starts but remains incomplete until after the appliance is restarted.
-
Watch the status messages as the system checks and adjusts settings to meet Common Criteria standards. The page displays nine green check marks to display the success of the Common Criteria mode success.
If you did not click OK to restart the appliance, you must restart the appliance before the Common Criteria mode is enabled.
-
Click Save. A Date and Time subtab appears to enable you to define the appliance system date and time for Common Criteria.
Date and Time
The Appliance Settings tab displays a Date and Time subtab when you implement the Common Criteria mode to enable you to define the system time for the appliance.
-
In the Date and Time field, enter the system time for the appliance.
-
Click Save to save the Date and Time settings.
System Settings
Kernel does not support the FIPS Mode.
Click
next to a peer in the cluster hierarchy on the left side, click <appliance IP address>, and then select the System Settings tab on the right to read/write the various SevOne-select settings, available from the Command Line Interface, the appliance is using.
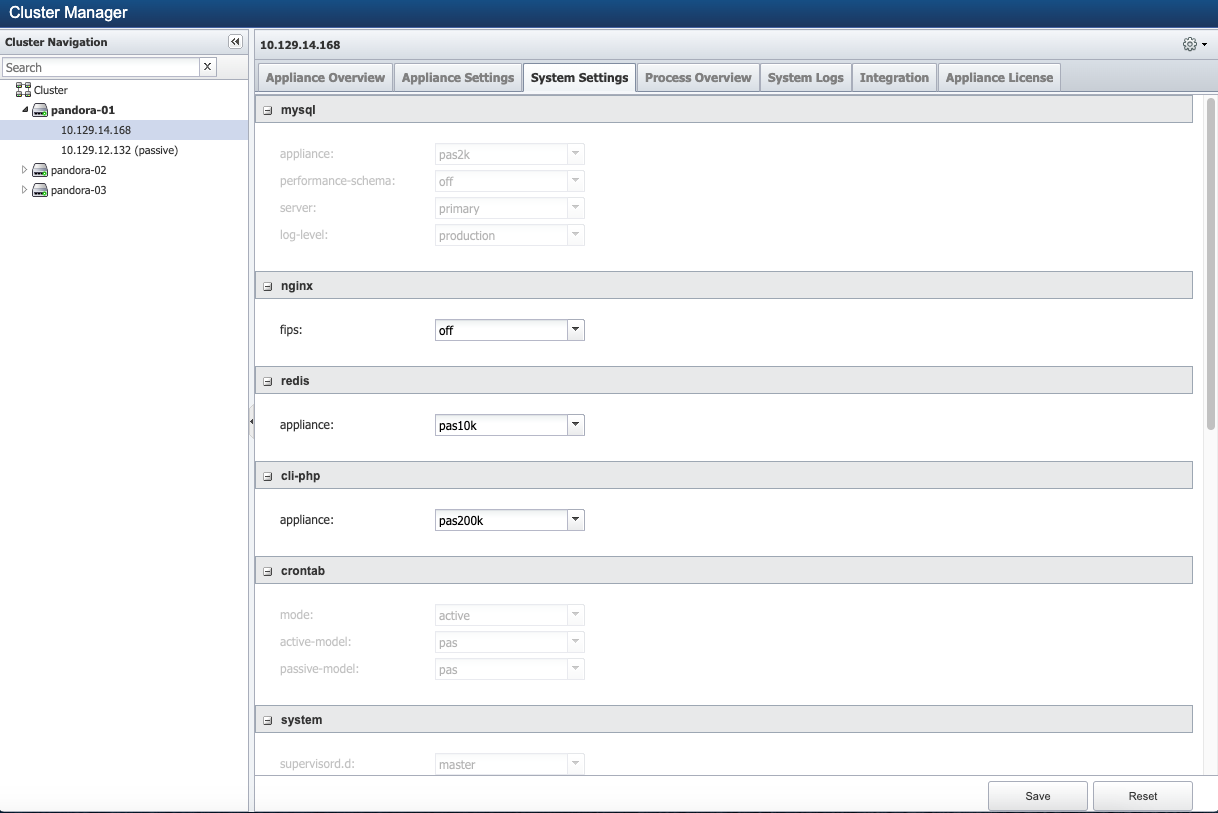
The following modules are available.
-
mysql - Configure the MySQL config files.
-
appliance: Configure the appliance type. Value can be pas2k, pas10k, pas20k, pas40k, pas60k, pas200k, or pas300k.
-
performance-schema: Toggle the PERFORMANCE SCHEMA (optional). Value can be on or off.
-
server: Configure whether or not this is the Primary or Secondary appliance. Value can be primary or secondary.
-
log-level: Configure whether or not to log warnings to the MySQL error logs. Value can be debug or production.
-
-
nginx - Configure the nginx config files. NOTE: When nginx setting is changed, it will cause the server to reboot and a refresh will be required.
-
fips: Configure nginx to be fips compliant. Value can be on or off.
-
-
redis - Configure the Redis config files.
-
appliance: Configure the appliance type. Value can be pas10k, pas20k, pas40k, pas60k, pas200k, or pas300k.
-
-
cli-php - Configure the CLI PHP config files.
-
appliance: Configure the appliance type. Value can be pas10k, pas20k, pas40k, pas60k, pas200k, or pas300k.
-
-
crontab - Configure the crontab files.
-
mode: Configure the 'mode' to use. Value can be active or passive.
-
active-model: Configure the active model to use. Value can be dnc or pas.
-
passive-model: Configure the passive model to use. Value can be dnc or pas.
-
-
system - Configure the system files.
-
supervisord.d: Configure the 'supervisord.d' directory to use. Value can be dnc, fips, master, or slave.
-
-
openldap - Configure the ldap files.
-
ldap.conf: Configure the LDAP config to use. Value can be cert or nocert.
-
-
ssh - Configure the ssh config files. NOTE: This module is disabled because changing ssh mode will result in the failure of the current ssh cipher.
-
config: Configure ssh to be fips compliant. Value can be fips or default.
-
-
sshd - Configure the sshd config files. NOTE: This module is disabled because changing sshd mode will result in the failure of the current ssh cipher.
-
config: Configure sshd to be fips compliant. Value can be fips or default.
-
-
kafka - Configure the kafka config files.
-
appliance: Configure the appliance type. Value can be dnc, pas2k, pas4k, pas10k, pas20k, pas40k, pas60k, pas200k, or pas300k.
-
-
zookeeper - Configure the kafka config files.
-
appliance: Configure the appliance type. Value can be dnc, pas2k, pas4k, pas10k, pas20k, pas40k, pas60k, pas200k, or pas300k.
-
-
php-fpm - Configure the PHP-FPM config files. NOTE: Changing the mode of php-fpm will cause the server to restart. You are required to refresh the page after changing this value.
-
process-manager: Configure the Pool Process Manager (pm). Value can be dnc100, dnc1000, dnc1000hf, dnc1500, dnc1500hf, dnc200, dnc400, dnc600, pas5k, pas10k, pas20k, pas40k, pas60k, pas200k, or pas300k.
-
-
cookie - Configure the cookies. Web browsers such as Chrome, Firefox, etc. are enforcing privacy-preserving defaults. Samesite is a cookie attribute which allows developers to explicitly declare the intent of a cookie’s scope.
-
samesite: Value can be lax or strict. By default, it is set to lax.
-
lax - allows the user to maintain a logged in status while arriving from an external link.
-
strict - allows first-party cookies to be sent.
-
-
Click on Reset button to set the values to current settings.
Click on Save button to apply the changes.
Process Overview
Click
next to a peer in the cluster hierarchy on the left, click <appliance IP address>, and then select the Process Overview tab on the right side to display a list of processes.
-
 - Click to refresh the process information or to refresh the information at the frequency you select.
-
Shutdown Appliance - Click to shut down the appliance
-
Restart Appliance - Click to restart the appliance.
Processes appear grouped in subsections. Process information includes the process name, the path to the process file, the number of instances of the process, the percentage of CPU the process is using, and the amount of RAM the process uses.
Stop, Start, and Restart buttons enable you to stop and start some processes. You should not click these buttons without strong cause.
See the Processes and Logs chapter for a list of processes.
System Logs
Click
next to a peer in the cluster hierarchy on the left, click <appliance IP address>, and then select the System Logs tab to view appliance level logs. SevOne NMS is a Linux application with various daemons and background utilities that run at all times. Most of these record their activities in logs on the appliance.
The upper section of the tab enables you to select the log to view. Log data refreshes upon each selection from the drop-down menus. Logs display the newest data at the bottom. When you view a log, the display scrolls to the bottom of the log.
Please refer to Processes and Logs chapter for a list of log files.
-
Click the Select log... drop-down and select the log to view.
-
Click the Last <n> Lines drop-down and select how many lines at the end of the log file to display.
-
Click Download Full Log File to export the log to a .log file.
-
Click Refresh to update the System Logs display.
Integration
For a new appliance or when you want to move a peer to a different SevOne NMS cluster in a multi-cluster environment, the Integration tab enables you to add this appliance as a new peer to your SevOne NMS cluster or to move this peer to a different SevOne NMS cluster in your network when you have a multi-cluster environment.
From the Cluster Manager, click
in the cluster hierarchy on the left side next to the peer to add/move to display the peer's IP address. Click on the IP address and then select the Integration tab on the right side.
-
All data on this appliance will be deleted.
-
You need the name of this appliance.
-
You need the IP address of this appliance.
-
You need to be able to access the Cluster Manager on a SevOne NMS peer that is already in the cluster to which you intend to add this appliance.
-
If you do not complete the steps within ten minutes, you must start again at step 1) Click Allow Peering... to queue this appliance for peering within the following ten minutes.
After you click Allow Peering on this tab, you will have ten minutes to perform the following steps from a peer that is already in the cluster to which you intend to add this peer/appliance.
-
Click Allow Peering here on this tab.
This invokes a pre-health check to be performed. Only if the pre-health check completes successfully, you are allowed to proceed to the next step. The pre-health checks include:
-
Services - ensures all required services are running on the peer. For example, Kafka, mysqld, REST API, etc.
-
Ports - all required ports are open. For example, TCP 22, TCP 443, TCP 3306, TCP 3307, TCP 9092, TCP 60007, etc.
The following are some examples of possible pre-health check failure error messages.
-
ERROR_PORTS_CLOSED, port check failed.
-
ERROR_SERVICES_UNHEALTHY, service check failed.
-
ERROR_SSH_FAILED, ssh check failed.
-
-
Log on to the peer in the destination cluster.
-
Go to the Cluster Manager (Administration > Cluster Manager).
-
At the
Cluster level select the Peers tab.
-
Click Add Peer to display a pop-up.
-
Enter the Peer Name and the IP Address of this peer/appliance.
-
On the pop-up, click Add Peer.
-
All data on the peer/appliance you are adding is deleted.
-
Do not do anything on the peer you are adding until a Success message appears on the peer on which you click Add Peer.
-
You can continue working and performing business as usual on all peers that are already in the cluster.
-
The new peer appears on the Peers tab in the destination cluster with a status message. Click
 to update the status.
-
The new peer appears in the cluster hierarchy on the left.
At this point, pre-health check is performed on the Cluster Leader to which the peer is being added to. You are allowed to proceed to the next step only if the pre-health check completes successfully. The pre-health check include:
-
Services - ensures all required services are running on the peer. For example, Kafka, mysqld, REST API, etc.
-
Ports - ensures that all the required ports open on the Cluster Leader are also open on the target peer. For example, TCP 22, TCP 443, TCP 3306, TCP 3307, TCP 9092, TCP 60007, etc.
-
SSH - ensures that Cluster Leader can access or communicate with the target peer.
The following are some examples of possible pre-health check failure error messages.
-
ERROR_PORTS_CLOSED, port check failed.
-
ERROR_SERVICES_UNHEALTHY, service check failed.
-
ERROR_SSH_FAILED, ssh check failed.
-
-
After the Success message appears on the peer in the destination cluster, you can go to the peer you just added and the entire cluster hierarchy to which you added the peer should appear on the left in the Cluster Manager.
-
You can use the Device Mover to move devices to the new peer.
If the integration fails, click View Cluster Logs on the Peers tab on the peer that is in the destination cluster to display a log of the integration messages.
Click Clear Failed to remove failed attempts from the list. Failed attempts are not automatically removed from the list which enables you to navigate away from the Peers tab during the integration.
Appliance License
Provides the following SevOne NMS details for the appliance you are logged into.
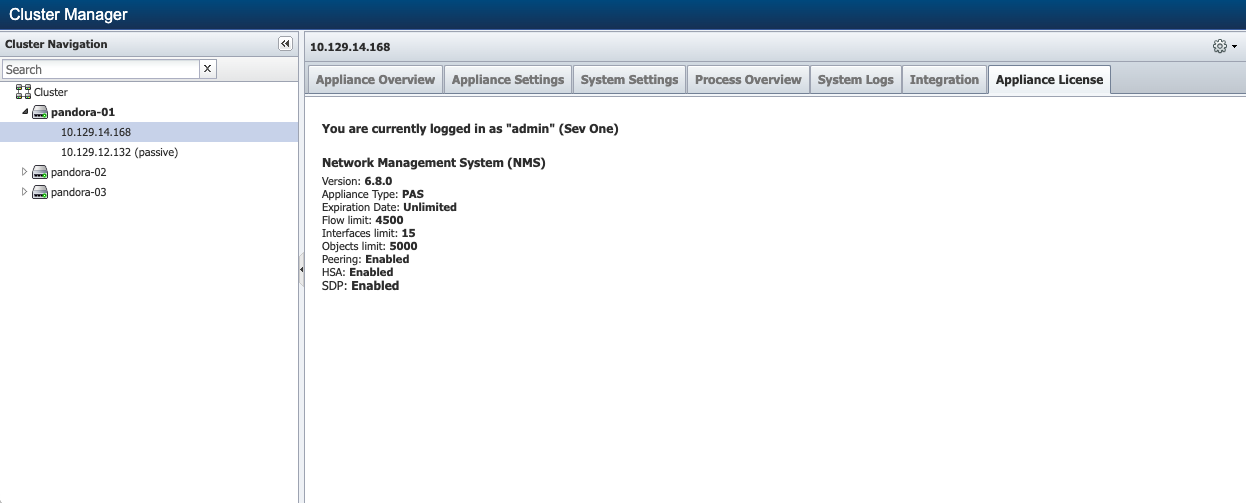
When a peer exceeds the object capacity, that peer does not discover any objects that go beyond the peer capacity. This prevents a peer from being overloaded which impacts the integrity of the peer. No metrics are collected from objects that are not discovered. However, for existing devices, new objects can be discovered well above its capacity.
Admin receives the following message at login:
Peer <peer name> is at <n> capacity.
This message indicates that a peer in your cluster exceeds its object capacity. A peer does not discover any new devices or poll additional objects when a peer reaches its object capacity.
As of SevOne NMS 6.1 or above releases, license file is no longer needed.