Table of Contents (Start)
- Topics
- Introducing SevOne
- Login
- Startup Wizard
- Dashboard
- Global Search - Advanced Search
- Report Manager
- Report Attachment Wizard
- Report Properties
- Report Interactions
- Instant Graphs
- TopN Reports
- Alerts
- Alert Archives
- Alert Summary
- Instant Status
- Status Map Manager
- Edit Maps
- View Maps
- FlowFalcon Reports
- NBAR Reports
- Logged Traps
- Unknown Traps
- Trap Event Editor
- Trap Destinations
- Trap Destination Associations
- Policy Browser
- Create and Edit Policies
- Webhook Definition Manager
- Threshold Browser
- Create and Edit Thresholds
- Probe Manager
- Discovery Manager
- Device Manager
- New Device
- Edit Device
- Object Manager
- High Frequency Poller
- Device Summary
- Device Mover
- Device Groups
- Object Groups
- Object Summary
- Object Rules
- VMware Browser
- AWS Plugin
- Azure Plugin (Public Preview)
- Calculation Plugin
- Database Manager
- Deferred Data Plugin
- DNS Plugin
- HTTP Plugin
- ICMP Plugin
- IP SLA Plugin
- JMX Plugin
- NAM
- NBAR Plugin
- Portshaker Plugin
- Process Plugin
- Proxy Ping Plugin
- SDWAN Plugin
- SNMP Plugin
- VMware Plugin
- Web Status Plugin
- WMI Plugin
- xStats Plugin
- Indicator Type Maps
- Device Types
- Object Types
- Object Subtype Manager
- Calculation Editor
- xStats Source Manager
- User Role Manager
- User Manager
- Session Manager
- Authentication Settings
- Preferences
- Cluster Manager
- Maintenance Windows
- Processes and Logs
- Metadata Schema
- Baseline Manager
- FlowFalcon View Editor
- Map Flow Objects
- FlowFalcon Views
- Flow Rules
- Flow Interface Manager
- MPLS Flow Mapping
- Network Segment Manager
- Flow Protocols and Services
- xStats Log Viewer
- SNMP Walk
- SNMP OID Browser
- MIB Manager
- Work Hours
- Administrative Messages
- Enable Flow Technologies
- Enable JMX
- Enable NBAR
- Enable SNMP
- Enable Web Status
- Enable WMI
- IP SLA
- SNMP
- SevOne Data Publisher
- Quality of Service
- Perl Regular Expressions
- Trap Revisions
- Integrate SevOne NMS With Other Applications
- Email Tips and Tricks
- SevOne NMS PHP Statistics
- SevOne NMS Usage Statistics
- Glossary and Concepts
- Map Flow Devices
- Trap v3 Receiver
- Guides
- Quick Start Guides
- AWS Quick Start Guide
- Azure Quick Start Guide (Public Preview)
- Data Miner Quick Start Guide
- Flow Quick Start Guide
- Group Aggregated Indicators Quick Start Guide
- IP SLA Quick Start Guide
- JMX Quick Start Guide
- Metadata Quick Start Guide
- RESTful API Quick Start Guide
- Self-monitoring Quick Start Guide
- SevOne NMS Admin Notifications Quick Start Guide
- SNMP Quick Start Guide
- Synthetic Indicator Types Quick Start Guide
- Topology Quick Start Guide
- VMware Quick Start Guide
- Web Status Quick Start Guide
- WMI Quick Start Guide
- xStats Quick Start Guide
- xStats Adapter - Accedian Vision EMS (TM) Quick Start Guide
- Deployment Guides
- Automated Build / Rebuild (Customer) Instructions
- Generate a Self-Signed Certificate or a Certificate Signing Request
- SevOne Best Practices Guide - Cluster, Peer, and HSA
- SevOne Data Platform Security Guide
- SevOne NMS Implementation Guide
- SevOne NMS Installation Guide - Virtual Appliance
- SevOne NMS Advanced Network Configuration Guide
- SevOne NMS Installation Guide
- SevOne NMS Port Number Requirements Guide
- SevOne NMS Upgrade Process Guide
- SevOne Physical Appliance Pre-Build BIOS and RAID Configuration Guide
- SevOne SAML Single Sign-On Setup Guide
- Cloud Platforms
- Other Guides
- Quick Start Guides
IP SLA Quick Start Guide
SevOne Documentation
All documentation is available from the IBM SevOne Support customer portal.
© Copyright International Business Machines Corporation 2024 .
All right, title, and interest in and to the software and documentation are and shall remain the exclusive property of IBM and its respective licensors. No part of this document may be reproduced by any means nor modified, decompiled, disassembled, published or distributed, in whole or in part, or translated to any electronic medium or other means without the written consent of IBM.
IN NO EVENT SHALL IBM, ITS SUPPLIERS, NOR ITS LICENSORS BE LIABLE FOR ANY DAMAGES, WHETHER ARISING IN TORT, CONTRACT OR ANY OTHER LEGAL THEORY EVEN IF IBM HAS BEEN ADVISED OF THE POSSIBILITY OF SUCH DAMAGES, AND IBM DISCLAIMS ALL WARRANTIES, CONDITIONS OR OTHER TERMS, EXPRESS OR IMPLIED, STATUTORY OR OTHERWISE, ON SOFTWARE AND DOCUMENTATION FURNISHED HEREUNDER INCLUDING WITHOUT LIMITATION THE WARRANTIES OF DESIGN, MERCHANTABILITY OR FITNESS FOR A PARTICULAR PURPOSE, AND NONINFRINGEMENT.
IBM, the IBM logo, and SevOne are trademarks or registered trademarks of International Business Machines Corporation, in the United States and/or other countries. Other product and service names might be trademarks of IBM or other companies. A current list of IBM trademarks is available on ibm.com/trademark.
About
Cisco Internet Protocol Service Level Agreements (IP SLAs) allow you to monitor several different metrics by performing tests between two Cisco routers. One router acts as the testing router, while the other router–designated as the IP SLA responder–responds to the tests. The IP SLA feature is embedded in the Cisco IOS software. SevOne's IP SLA plugin monitors this software to provide Cisco customers network performance metrics information. IP SLA technology accommodates remote configuration over SNMP. This means that you can create IP SLAs in SevOne NMS without having to log in to the router and run commands. The IP SLA plugin detects and monitors all IP SLAs on the router, including the IP SLAs that you create.
SevOne NMS provides a Cisco IP SLA Compliance Revision page that applies to the Cisco IP SLA MIB CISCO-RTTMON-MIB. The page displays a list of the various compliance revisions for the MIB. Cisco devices that support IP SLA also support one of these revisions. SevOne NMS checks for the existence of certain values (ofrttMonSupportedProtocolsValid and rttMonSupportedRttTypesValid) to detect the compliance revision for a device.
IP SLA Identity
Unlike interfaces, IP SLAs are not physical. This can pose a challenge for performance monitors. For example, when a device reboots there is no rule to preserve the IDs of the IP SLAs or even to preserve an IP SLA. In order to avoid duplicate IP SLAs, SevOne NMS uses the following three criteria to determine whether an IP SLA has previously been encountered by SevOne NMS.
-
IP SLA Type - SevOne NMS compares the IP SLA type to see if it matches the type of an existing IP SLA.
-
Owner - SevOne NMS compares the owner to see if it matches the owner of an existing IP SLA. The owner is the string that the creator of the IP SLA uses to identify itself.
-
Tag - SevOne NMS compares the tag to see if it matches the tag of an existing IP SLA. The tag is the unique identifier that the creator uses to distinguish the IP SLA.
If the IP SLA type, owner, and tag are the same, then SevOne NMS assumes that the two IP SLAs refer to the same thing and does notcreate a duplicate IP SLA. While the router can use the IP SLA identifier number to distinguish between IP SLAs (because the router does not need to track the IP SLAs it created before the reboot), SevOne NMS does not rely on the IP SLA numeric identifier.
IP SLA Monitoring
IP SLAs actively monitor network traffic by generating and analyzing traffic. This enables continuous and proactive performance monitoring of several metrics, including the following:
-
UDP Jitter
-
UDP Echo
-
Ethernet Jitter
-
ICMP Jitter
-
TCP Connect
-
HTTP
-
Video
-
VoIP
These are only a few of the metrics supported. For detailed information on supported IP SLAs and available metrics, please refer to section Supported IP SLAs.
Configuration Steps
This section provides steps to configure the IP SLA settings in SevOne NMS.
-
Cluster-level settings
-
Configuring the IP SLA plugin
-
Adding and importing probes using the Probe Manager
For a complete list of the IP SLAs supported by SevOne NMS and related information, please see section, Supported IP SLAs. For a list of Ethernet Jitter OIDs that SevOne NMS gets, see the section Ethernet Jitter OIDs.
Cluster-level Settings
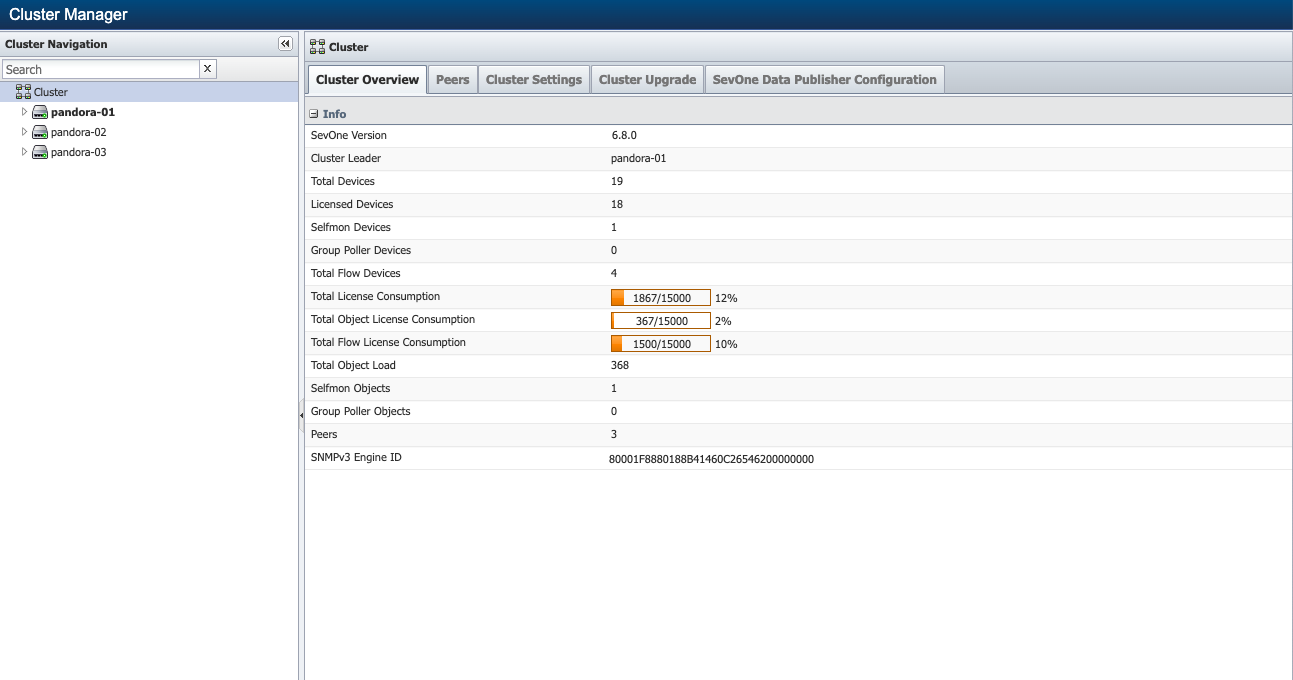
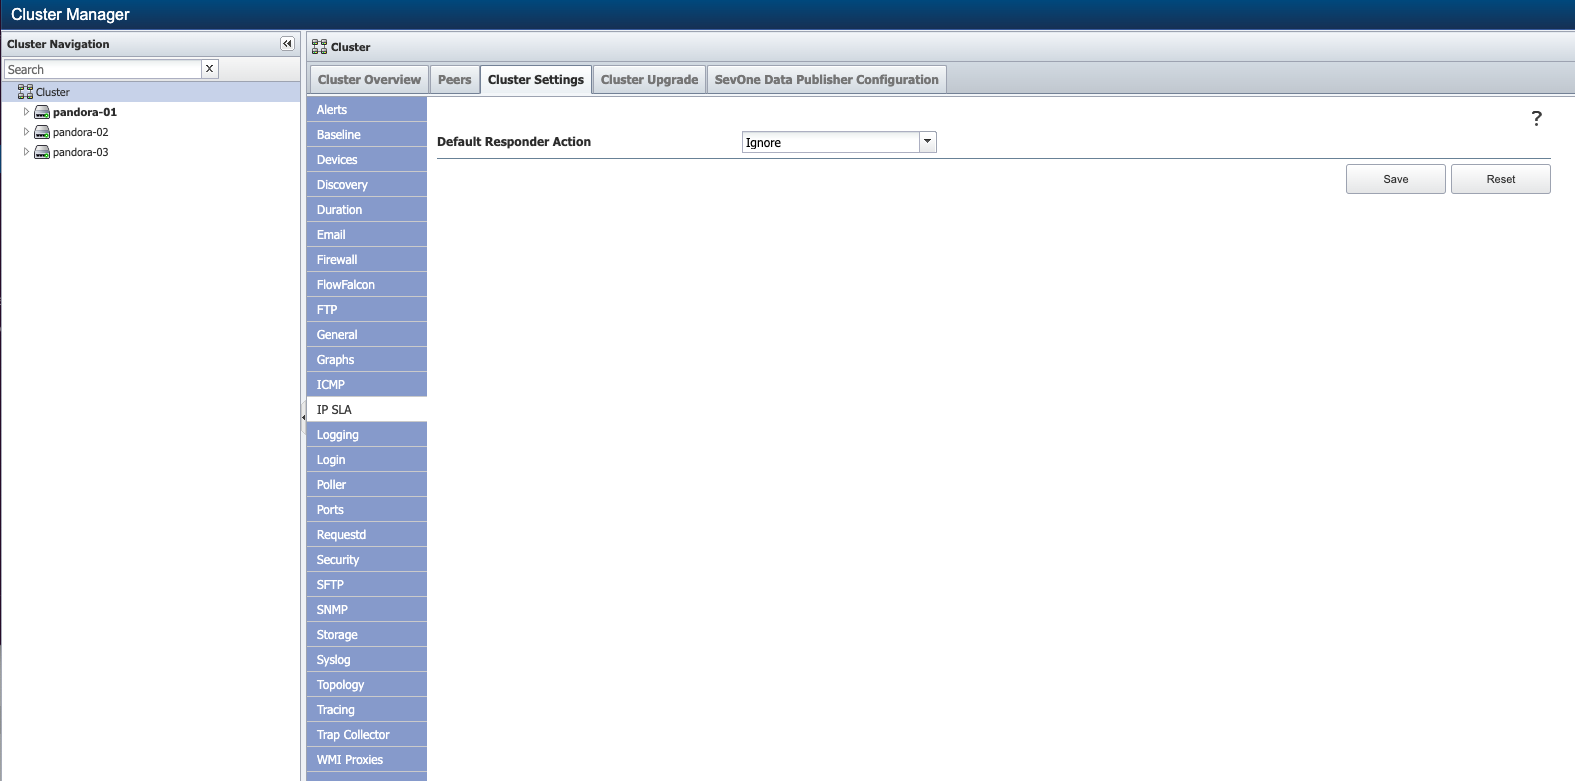
The Cluster Manager lets you specify how SevOne NMS handles the IP SLA responder setting on devices. Perform the following steps to configure the cluster-level IP SLA responder action.
-
From the navigation bar, click Administration and select Cluster Manager.
-
On the right side of the page, select the Cluster Settings tab.
-
On the Cluster Settings tab, scroll down and select the IP SLA subtab.
-
Click the Default Responder Action drop-down and select one of the following:
-
Ignore - to have SevOne NMS not change the IP SLA responder setting on devices.
-
Yes - to turn on the IP SLA responder on devices upon discovery, when possible.
-
No - to turn off the IP SLA responder on devices upon discovery, when possible.
-
Configure IP SLA Plugin
The IP SLA plugin is automatically enabled for new devices added to SevOne NMS. This section includes steps for configuring the IP SLA plugin. First, enable and configure the SNMP plugin for devices. Ensure that the SNMP plugin is enabled on any devices that you enable the IP SLA plugin on.
SNMP Plugin
Perform the following steps to configure the SNMP plugin for a device. For detailed information about SNMP, see our documentation on the topic.
-
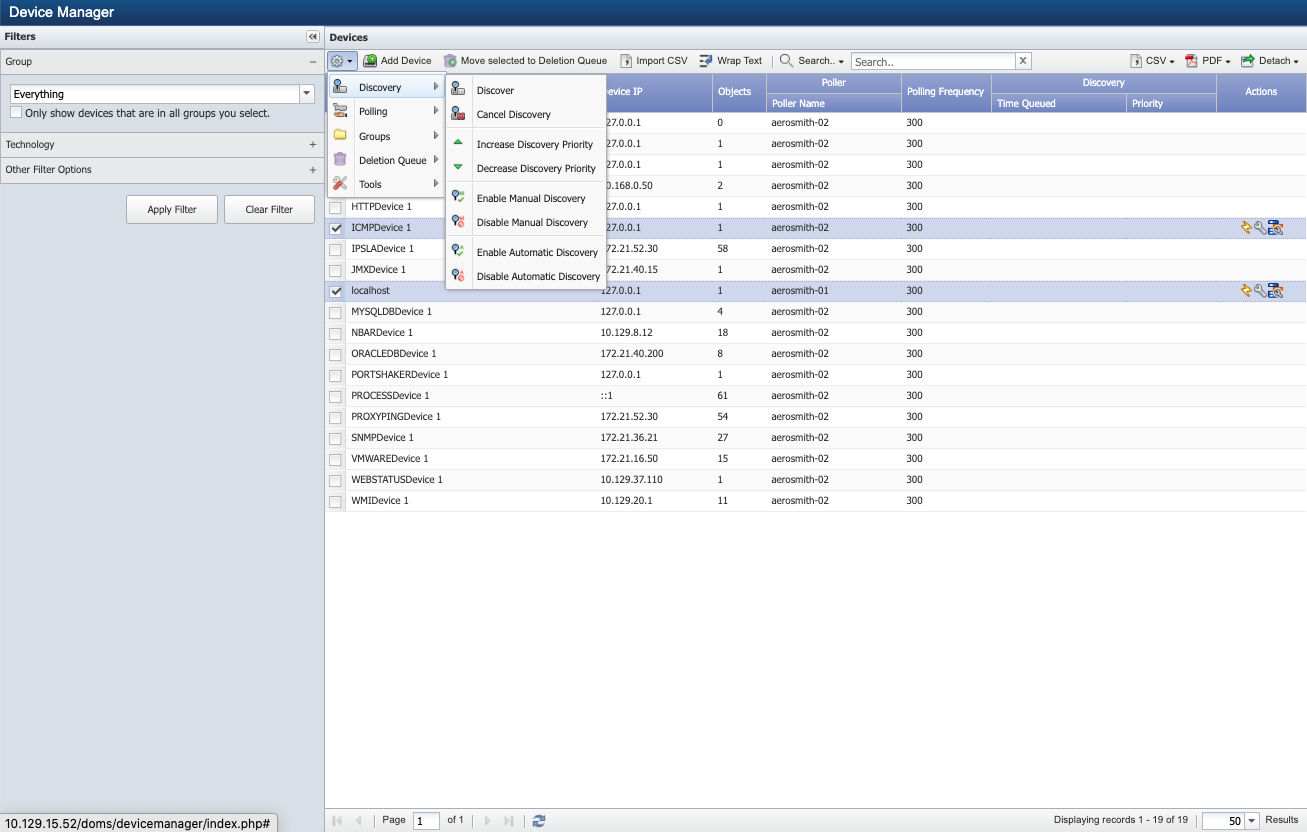
From the navigation bar, click Devices and select Device Manager.
-
Locate the device that you would like to enable the IP SLA plugin on and click
 to display the Edit Device page.
-
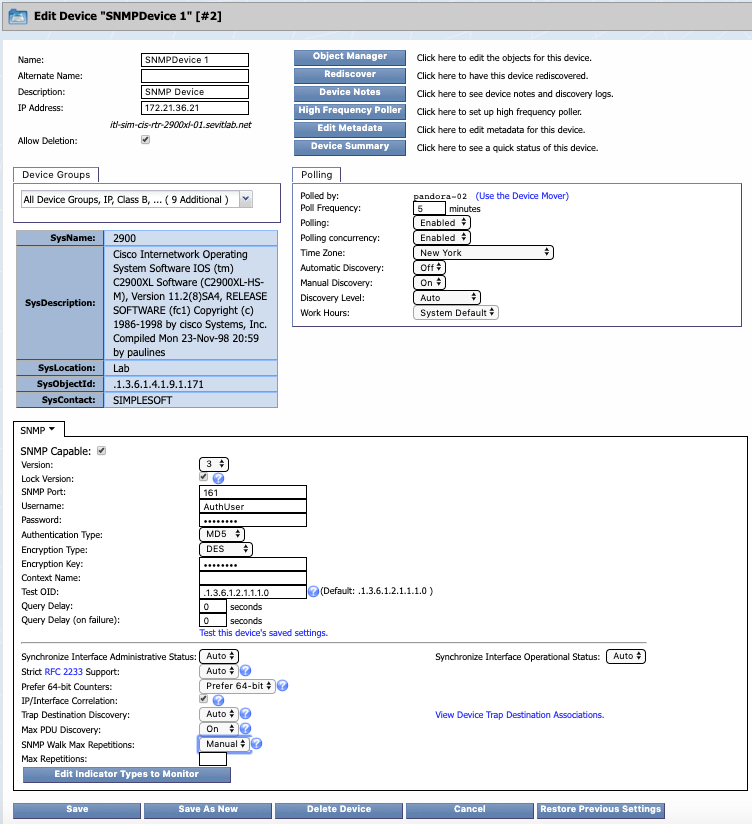
The plugin section appears in the lower half of the Edit Device page. It should be set to SNMP by default. If not, click the drop-down and select SNMP.
-
If the the SNMP Capable check box is not already selected, select it to enable the discovery of SNMP data.
-
Click the Version drop-down and select an SNMP version.
-
Select the Lock Version check box to use the SNMP version that you specified in the previous step.
-
In the SNMP Port field, enter the port number on the device for SevOne NMS to poll SNMP data. The default is 161.
-
If you selected version 1 or version 2c above, provide input for the Read Community String and Write Community String fields. Then skip the next step. If you selected Version 3, proceed to the next step.
-
If you selected version 3 above, provide input for the Username, Password, and Authentication Type fields. If you select an Authentication Type other than NONE, you will be able to provide input for the Encryption Type field (and Encryption Key if applicable).
-
In the Test OID field, enter the OID to use to verify the SNMP settings.
-
In the Query Delay field, enter the number of seconds to wait after each SNMP command or query during discovery.
-
In the Query Delay (on failure) field, enter the number of seconds to wait after a failure of an SNMP command or query.
-
Click the Test this device's saved settings link if you would to display the SNMP Walk page. For more information on SNMP walks, please see SevOne's documentation on SNMP.
-
Click the Synchronize Interface Administrative Status drop-down and select an option.
-
On the right, click the Synchronize Interface Operational Status drop-down and select an option.
-
Click the Strict RFC 2233 Support drop-down and select an option.
-
Click the Prefer 64-bit Counters drop-down and select an option.
-
Select the IP/Interface Correlation check box to walk the ipAdEntAddr-like entries for IP address information.
-
Click the Trap Destination Discovery drop-down and select an option.
-
On the right, click the View Device Trap Destination Associations link to view the trap destinations available for the device.
-
Click the Max PDU Discovery drop-down and select an option.
-
Click the SNMP Walk Max Repetitions drop-down to choose either Default or Manual. If you choose the Manual option, Max Repetitions field becomes available which allows you to specify the maximum number of iterations over the repeating variables. Max Repetitions must be a positive integer between 1 and 30.
-
Click Edit Indicator Types to Monitor to display the SNMP Poller Indicator Type Mapping page if you would like to enable or disable the SNMP indicator types to poll on the device.
-
Once you are done, return to the Edit Device page.
IP SLA Plugin
-
Click the plugin drop-down and select IP SLA.
-
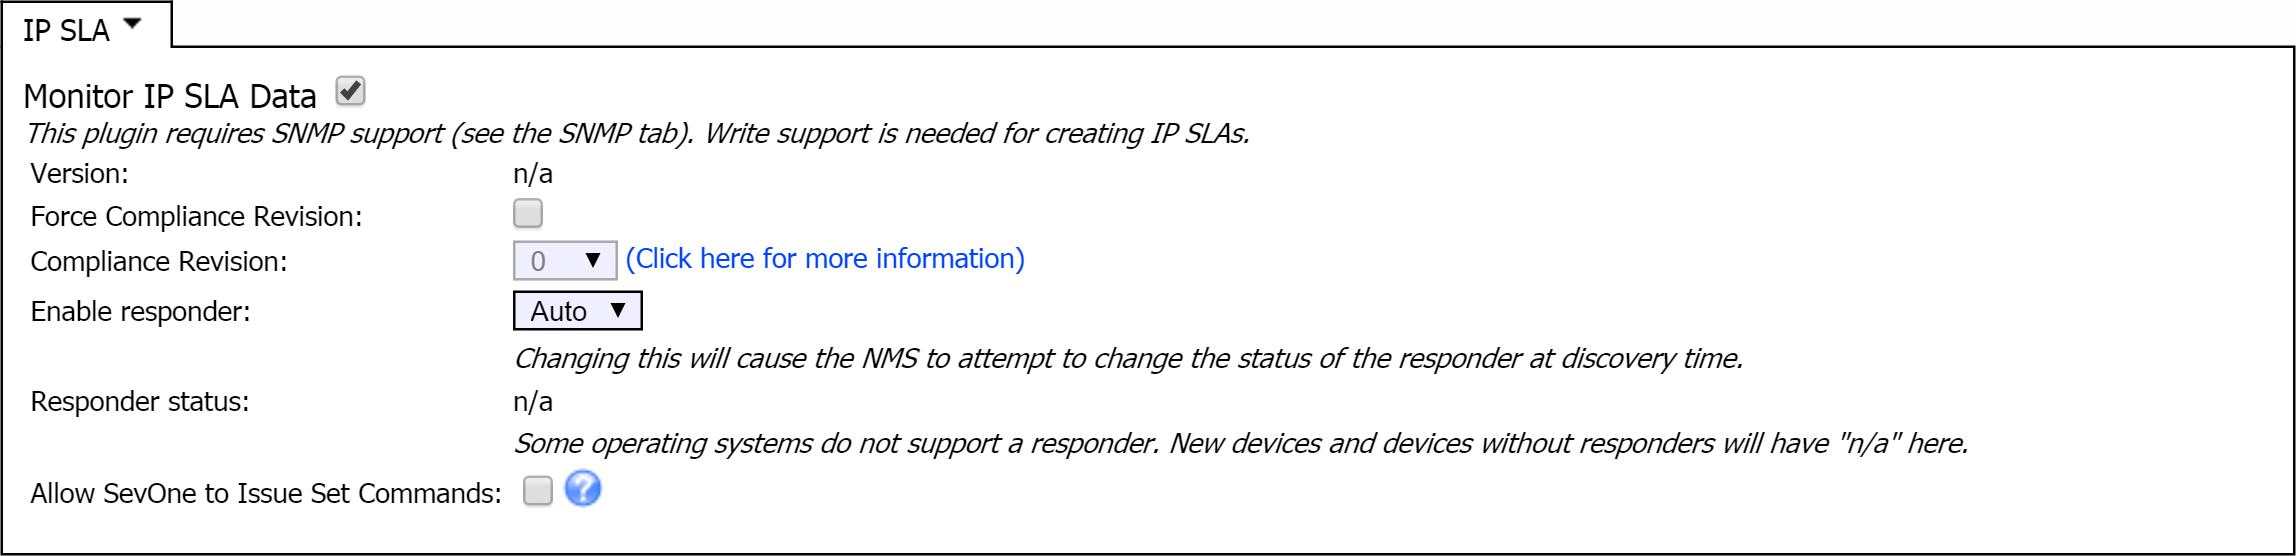
Select the Monitor IP SLA Data check box to enable discovery of IP SLA objects and to poll IP SLA data on the device.
-
The Version field cannot be edited. This is the round trip time monitoring application version string. The IP SLA plugin detects the version.
-
Select the Force Compliance Revision check box for the ability to change the Compliance Revision in the next step. The IP SLA plugin detects and enters the compliance revision for you. However, you can change the compliance revision for experimental purposes. If you select this check box, the IP SLA plugin uses the agent/OS you select and does not try to determine the proper agent/OS if the agent/OS you select fails.
-
Click the Compliance Revision drop-down and select an IP SLA revision. This step only applies if you selected the check box in the previous step. Click the Click here for more information link for the list of Cisco IP SLA Compliance Revisions.
-
Click the Enable responder drop-down and select one of the following options.
-
Auto - to use the setting from the Cluster Manager.
-
Yes - to turn on the IP SLA responder on the device, when possible.
-
No - to turn off the IP SLA responder on the device, when possible.
-
-
Responder status provides information about the status of the responder, either On, Off, or n/a. n/a indicates that a device is either new or has an operating system that does not support a responder.
-
Select the Allow SevOne to Issue Set Commands check box to allow SevOne NMS to automatically submit snmpset commands to the router in order to provision new IP SLAs.
-
Click Save to save changes.
Probe Manager
The Probe Manager enables you to manage IP SLA data from the devices that you enable the IP SLA plugin for. SevOne NMS supports the following Cisco IP SLA probes: DHCP, DLSw, DNS, Echo, Ethernet Jitter, Ethernet Ping, FTP, HTTP, ICMP Jitter, RTP, TCP Connect, UDP Echo, UDP Jitter, Video, VoIP, etc. This section provides the following details.
-
Adding probes
-
Importing probes from a .csv file
-
Managing probe messages
Probe List
Perform the following steps to add and import probes.
-
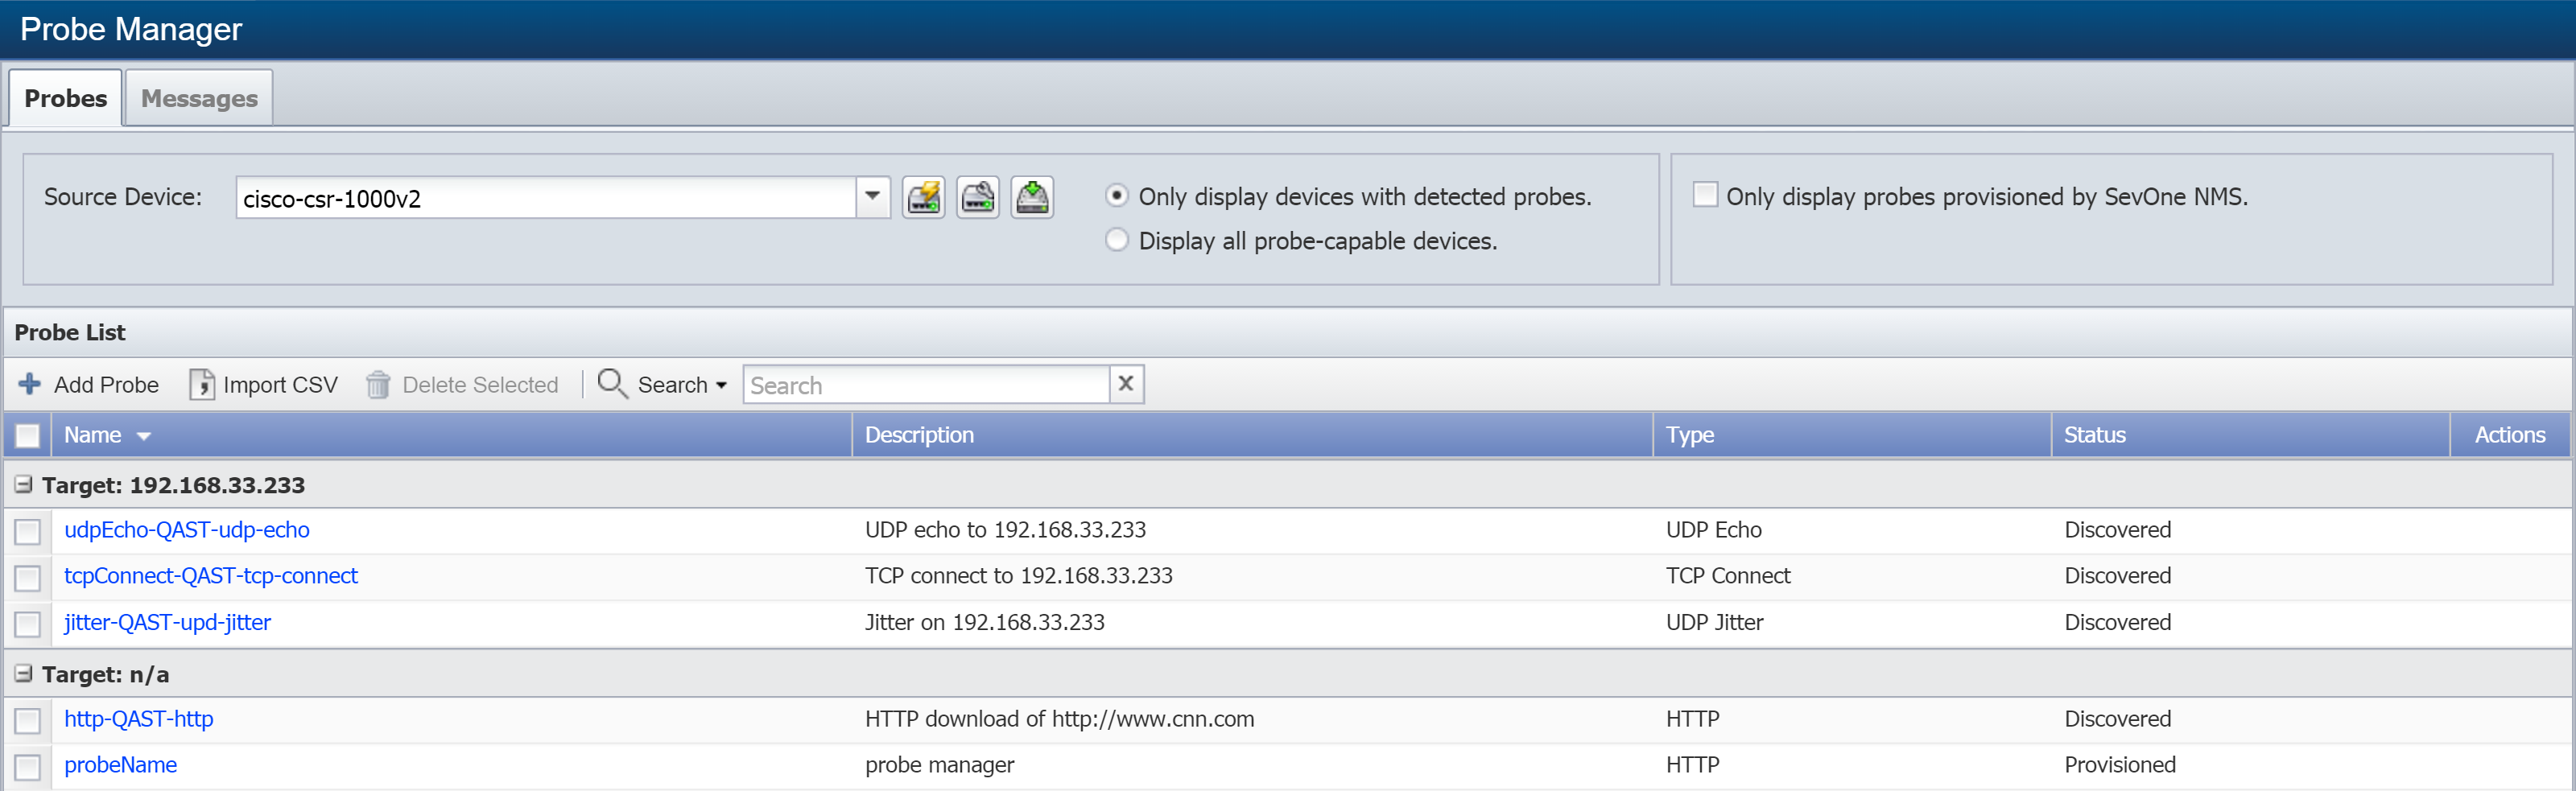
From the navigation bar, click Applications and select Probe Manager.
-
On the Probes tab, click the Source Device drop-down and select a device. The devices displayed here have the IP SLA plugin enabled.
-
To the right of your selected device, you will see three icons. Click on an icon to perform one of the following actions.
-
 - displays the the Device Summary for the selected source device.
-
 - displays the Edit Device page for the selected source device.
-
 - provisions the IP SLA test on the router.
-
-
Select one of the following options to specify which devices are displayed from the Source Device drop-down.
-
Only display devices with detected probes - displays only devices that SevOne NMS discovers at least one probe on.
-
Display all probe-capable devices - displays all devices that you enable the IP SLA plugin on.
-
-
On the right side of the tab, select the Only display probes provisioned by SevOne NMS check box to display only the probes that SevOne NMS provisions. Leave it clear to display all the probes for the selected source device.
The Probe List appears on the lower half of the Probe tab and provides the following information for the probes that meet your filter criteria. Each probe has a target device whose name or IP address displays in the Target separator bars in the probe list.
-
Name - displays the name of the probe. Click on the name to display the Object Summary. The IP SLAs that SevOne NMS discovers use the following naming convention: SLA Type-Owner-Tag. For example, in the screenshot above, the name udpEcho-QAST-udp-echo is made up of three parts: udpEcho (SLA Type), QAST (Owner), and udp-echo (Tag).
-
Description - displays the description of the probe. The probes that SevOne NMS discovers have descriptions based on the probes themselves.
-
Type - displays the type of the probe as the enumeration form from the CISCO-RTT-MON MIB.
-
Status - displays one of the following:
-
Discovered - when SevOne NMS runs the test and finds the result on devices that you enable the IP SLA plugin for.
-
Provisioned - when the device runs the test and sends the result back to SevOne NMS.
-
To Be Deleted - if you select to delete the probe.
-
-
Actions - select one of the following:
-
 - displays the IP SLA configuration for a probe.
-
 - sets a probe to be deleted. When you delete a probe, it is removed from both SevOne NMS and the router.
This option is not available for probes that SevOne NMS discovers–those probes cannot be deleted.
-
Add Probes
Perform the following actions to add a new probe.
The Import CSV button lets you import multiple probes from a .csv file.
-
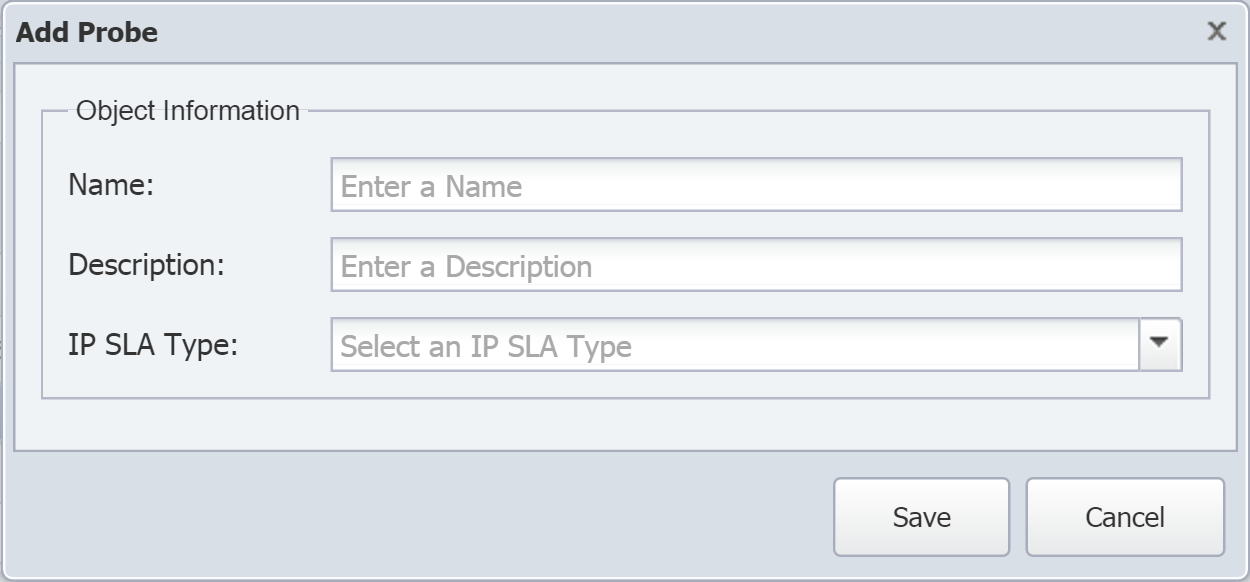
Click Add Probe to display the Add Probe pop-up.
-
In the Name field, enter a name for the probe. Make sure that the name is unique for the selected device.
-
In the Description field, enter a description of the probe. This is for user information only and explains the purpose of the probe.
-
Click the IP SLA Type drop-down and select an IP SLA type from the following options. The type you select determines the specific configuration steps, which are listed below under each IP SLA type.
IP SLA types that are not applicable for the selected device appear in light text and are not available for selection.
-
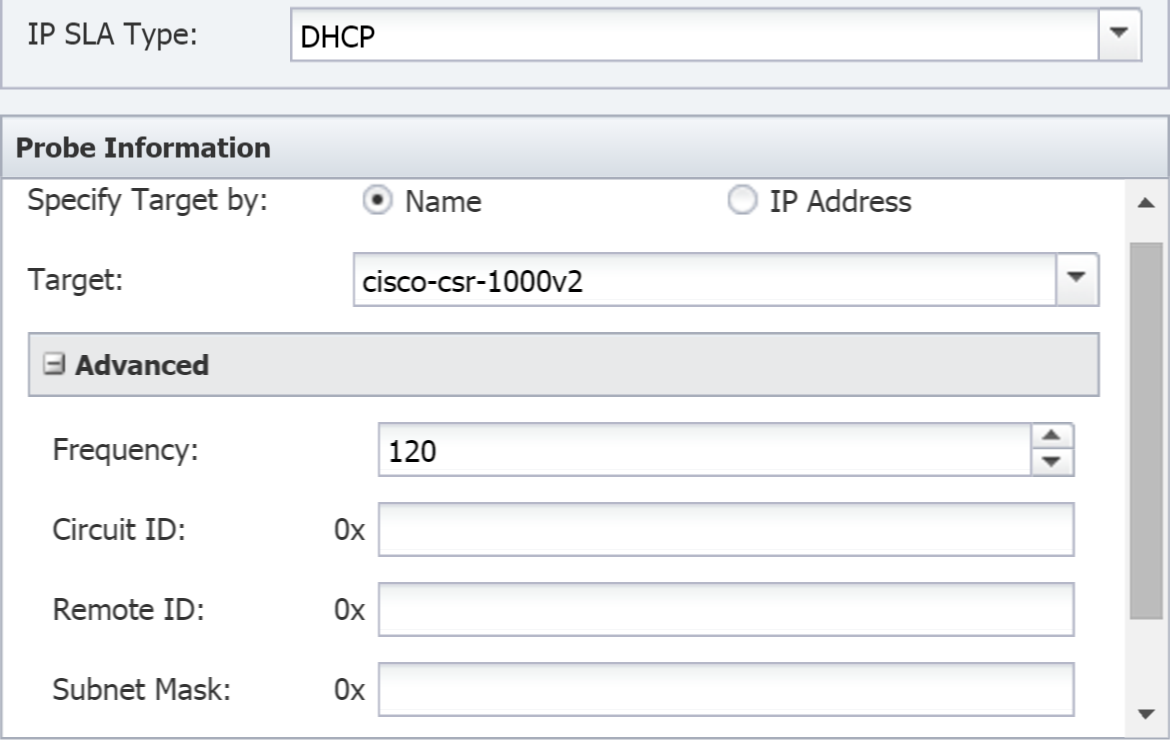
DHCP
-
For Specify Target by, select one of the following:
-
Name - to select the name of the target device from a drop-down list in the next step.
-
IP Address - to enter the IP address of the target device in the next step.
-
-
In the Target field, either click the drop-down and select the target device by name or enter the target device IP address in the text field, depending on your selection in the previous step.
-
Click + to expand the Advanced section.
-
In the Frequency field, enter the number of seconds indicating how often the router should perform the test. This needs to be greater than 0 and should be slightly less than the poll frequency of the device.
-
In the Circuit ID field, enter the Cisco circuit ID as specified through the CLI. This is a hexadecimal value.
-
In the Remote ID field, enter the remote ID. This is a hexadecimal value.
-
In the Subnet Mask field, enter the Cisco extension to DHCP Option 82 that allows the specification of a subnet. This is a hexadecimal value.
-
Click the Source IP drop-down and select the IP address of the source device.
-
-
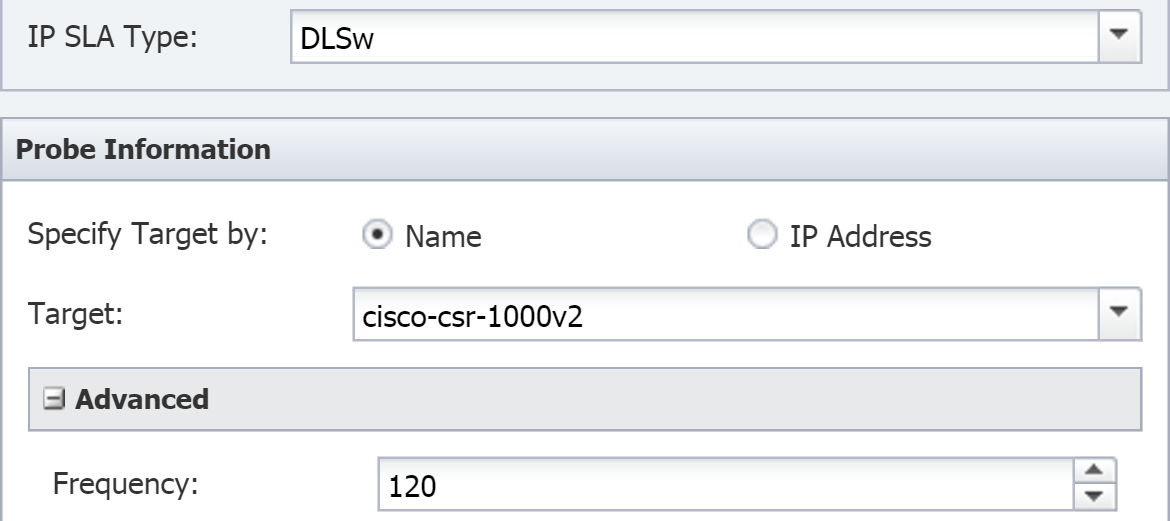
DLSw
-
For Specify Target by, select one of the following:
-
Name - to select the name of the target device from a drop-down list in the next step.
-
IP Address - to enter the IP address of the target device in the next step.
-
-
In the Target field, either click the drop-down and select the target device by name or enter the target device IP address in the text field, depending on your selection in the previous step.
-
Click + to expand the Advanced section.
-
In the Frequency field, enter the number of seconds indicating how often the router should perform the test. This needs to be greater than 0 and should be slightly less than the poll frequency of the device.
-
-
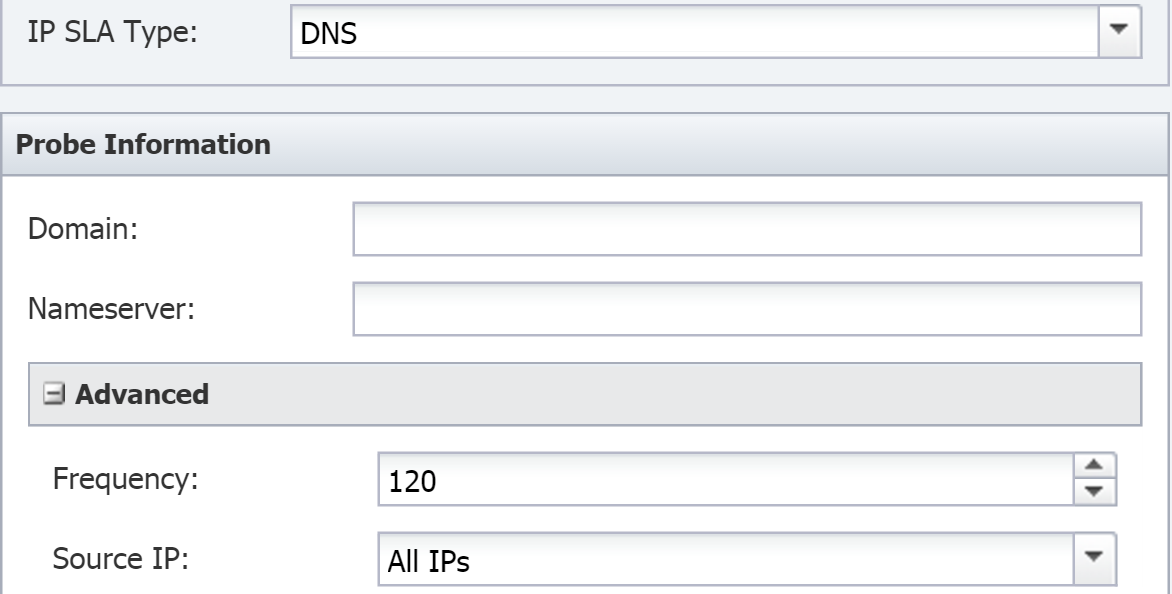
DNS
-
In the Domain field, enter the complete valid URL of the DNS domain.
-
In the Nameserver field, enter the IP address of the name server.
-
Click + to expand the Advanced section.
-
In the Frequency field, enter the number of seconds indicating how often the router should perform the test. This needs to be greater than 0 and should be slightly less than the poll frequency of the device.
-
Click the Source IP drop-down and select the IP address of the source device.
-
-
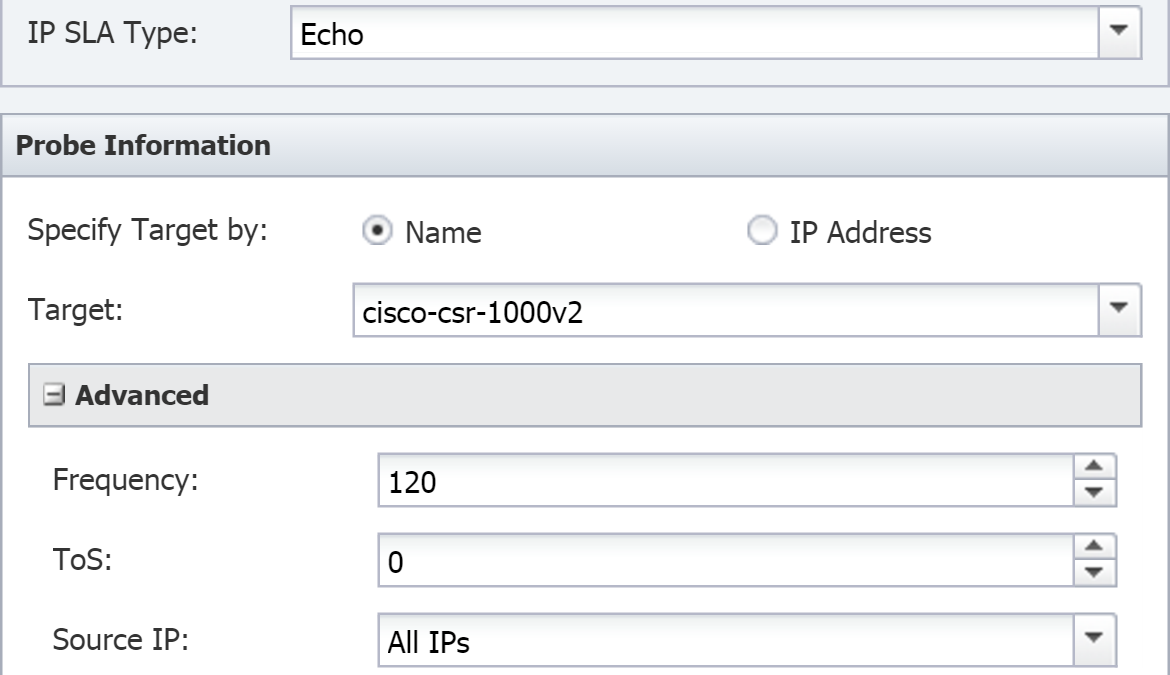
Echo
-
For Specify Target by, select one of the following:
-
Name - to select the name of the target device from a drop-down list in the next step.
-
IP Address - to enter the IP address of the target device in the next step.
-
-
In the Target field, either click the drop-down and select the target device by name or enter the target device IP address in the text field, depending on your selection in the previous step.
-
Click + to expand the Advanced section.
-
In the Frequency field, enter the number of seconds indicating how often the router should perform the test. This needs to be greater than 0 and should be slightly less than the poll frequency of the device.
-
In the ToS field, enter the type of service (ToS) byte number in the IP header of an IP SLA's operation. This should be a number between 0 and 255.
-
Click the Source IP drop-down and select the IP address of the source device.
-
-
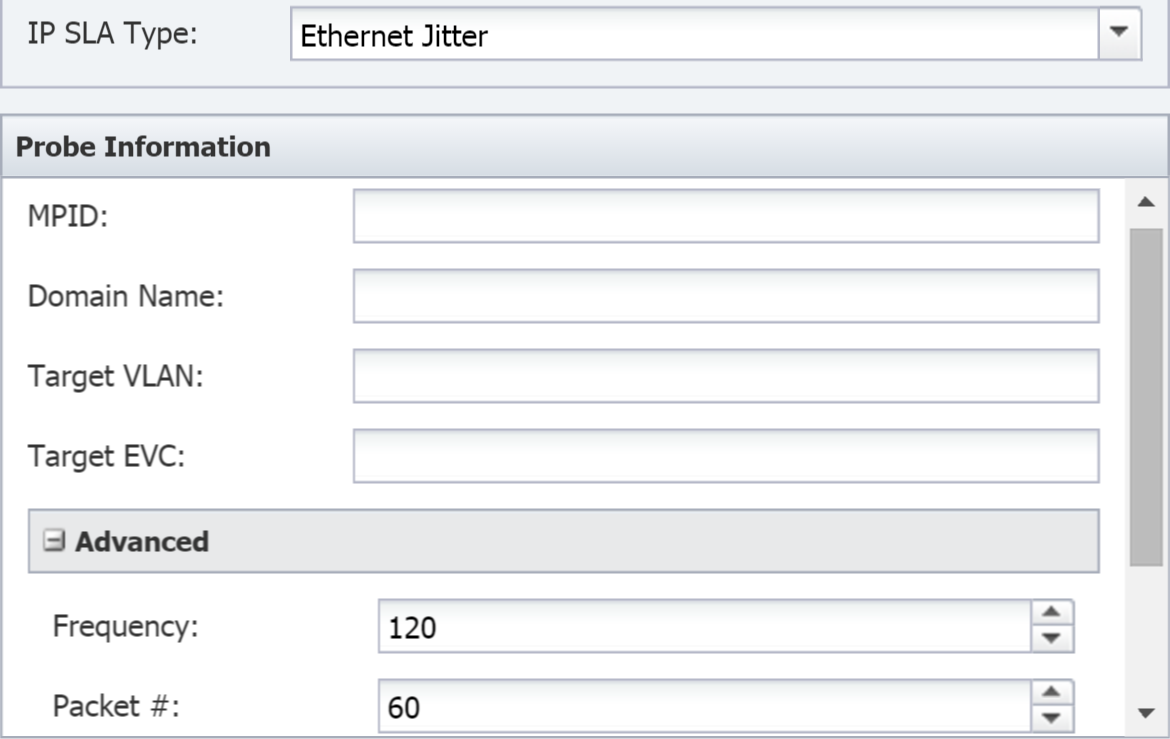
Ethernet Jitter or Ethernet Ping
-
In the MPID field, enter the destination maintenance point identifier (MPID) to test.
-
In the Domain Name field, enter the domain where the destination maintenance point resides.
-
In the Target VLAN field, enter identifier of the VLAN where the destination maintenance point resides.
-
In the Target EVC field, enter the Ethernet Virtual Connection (EVC) where the maintenance point resides.
-
Click + to expand the Advanced section.
-
In the Frequency field, enter the number of seconds indicating how often the router should perform the test. This needs to be greater than 0 and should be slightly less than the poll frequency of the device.
-
Ethernet Jitter only: In the Packet # field, enter the number of packets to send.
-
Ethernet Jitter only: In the Interval field, specify in milliseconds the interval between packets.
-
In the CoS field, enter the Ethernet class of service (CoS).
-
-
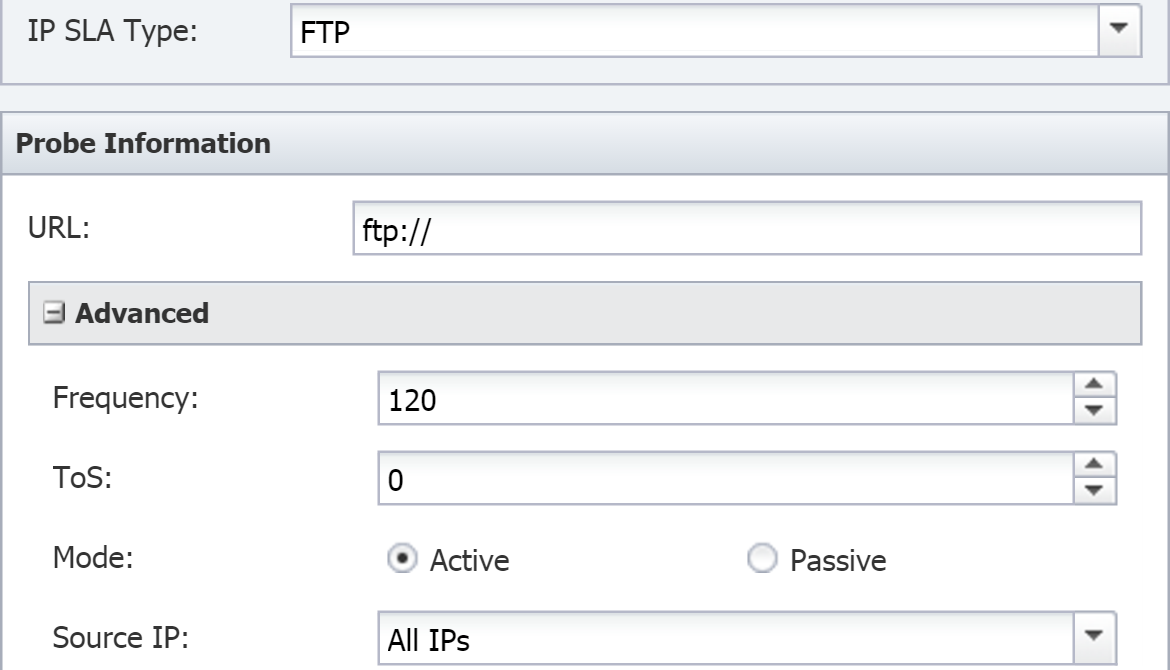
FTP
-
In the URL field, enter the complete valid URL of the file to fetch. The beginning portion, ftp://, needs to be included. If a user name and password are required, use the format <username>:<password>@<webaddress>, for example:
ftp://jerry:password@www.test.com/membersarea
-
Click + to expand the Advanced section.
-
In the Frequency field, enter the number of seconds indicating how often the router should perform the test. This needs to be greater than 0 and should be slightly less than the poll frequency of the device.
-
In the ToS field, enter the type of service (ToS) for the FTP packets that are sent. This should be a number between 0 and 255.
-
For Mode, select either Active or Passive.
-
Click the Source IP drop-down and select the IP address to issue the request from. If a router has multiple interfaces and some interfaces do not have access to the FTP server, you will need to select the IP address of the interface that will issue the request. If you leave this blank, the router attempts to choose the best/closest interface–which may not be the interface you want.
-
-
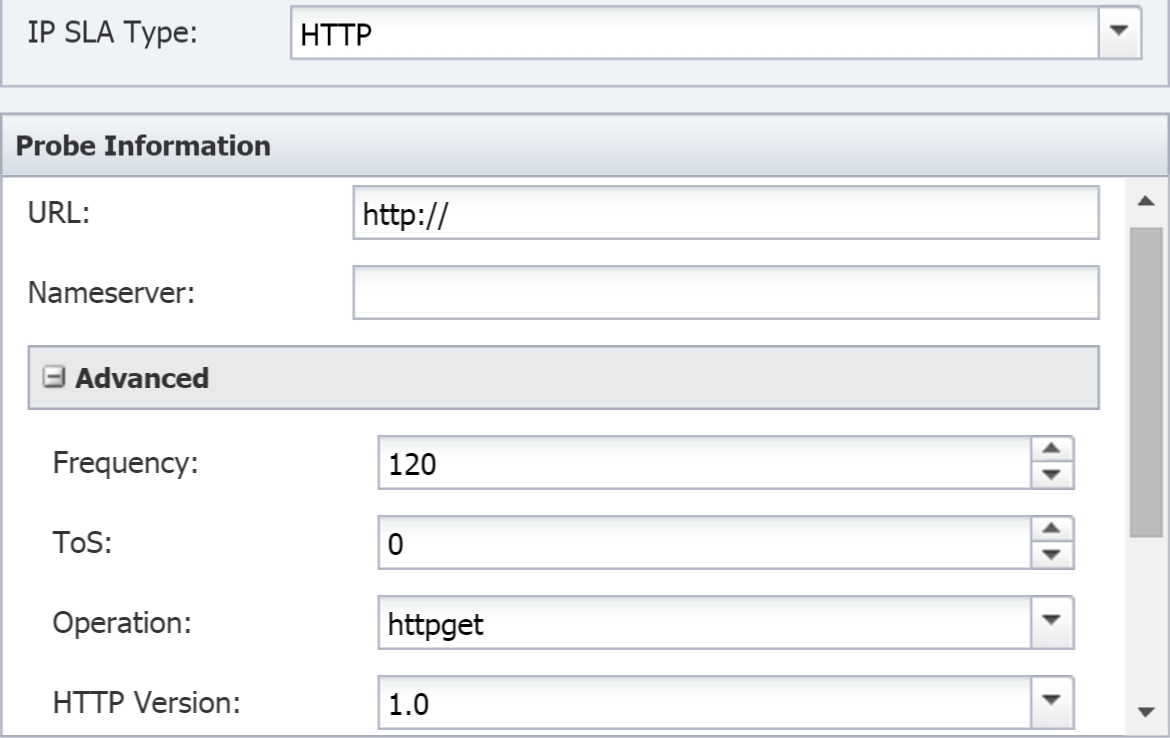
HTTP
-
In the URL field, enter the complete valid URL of the HTTP server.
-
In the Nameserver field, enter the IP address of the name server.
-
Click + to expand the Advanced section.
-
In the Frequency field, enter the number of seconds indicating how often the router should perform the test. This needs to be greater than 0 and should be slightly less than the poll frequency of the device.
-
In the ToS field, enter the type of service (ToS) byte number in the IP header of an IP SLA's operation. This should be a number between 0 and 255.
-
Click the Operation drop-down and select an operation.
-
Click the HTTP Version drop-down and select the HTTP version.
-
In the Proxy field, enter the IP address of the proxy.
-
Select the Cache check box to cache the IP SLA.
-
Click the Source IP drop-down and select the IP address of the source device.
-
-
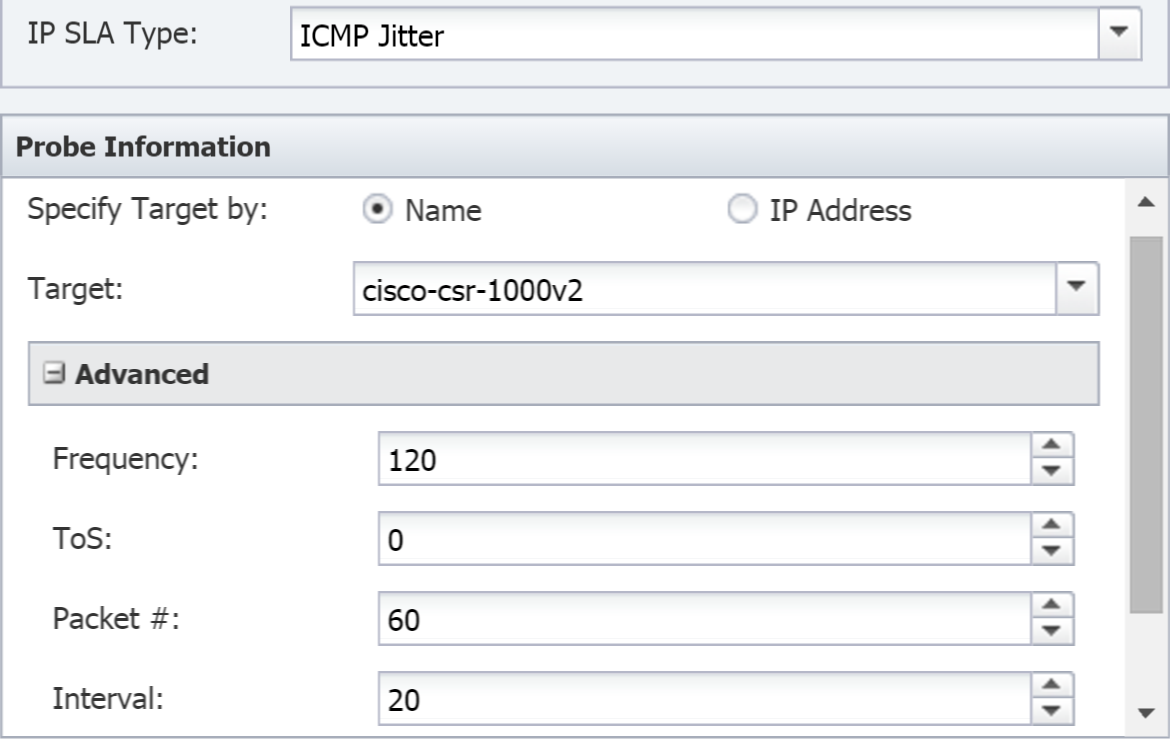
ICMP Jitter
-
For Specify Target by, select one of the following:
-
Name - to select the name of the target device from a drop-down list in the next step.
-
IP Address - to enter the IP address of the target device in the next step.
-
-
In the Target field, either click the drop-down and select the target device by name or enter the target device IP address in the text field, depending on your selection in the previous step.
-
Click + to expand the Advanced section.
-
In the Frequency field, enter the number of seconds indicating how often the router should perform the test. This needs to be greater than 0 and should be slightly less than the poll frequency of the device.
-
In the ToS field, enter the type of service (ToS) byte number in the IP header of an IP SLA's operation. This should be a number between 0 and 255.
-
In the Packet # field, enter the number of packets to send.
-
In the Interval field, specify in milliseconds the interval between packets.
-
Click the Source IP drop-down and select the IP address of the source device.
-
-
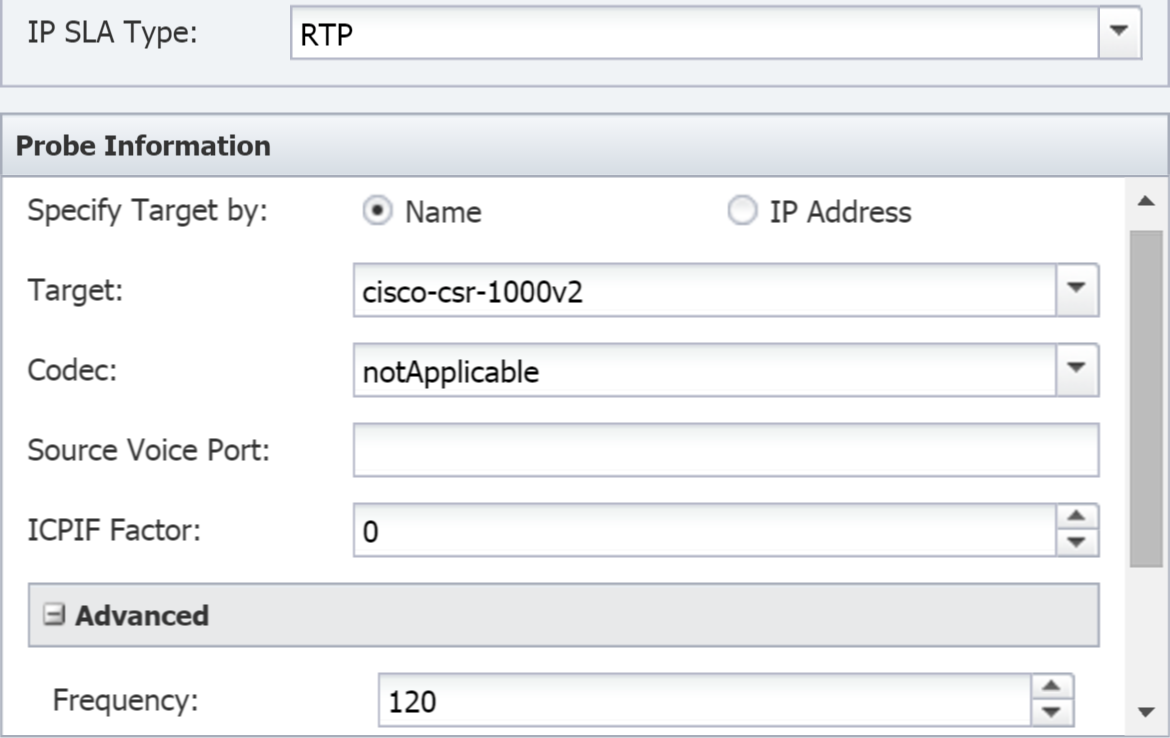
RTP
-
For Specify Target by, select one of the following:
-
Name - to select the name of the target device from a drop-down list in the next step.
-
IP Address - to enter the IP address of the target device in the next step.
-
-
In the Target field, either click the drop-down and select the target device by name or enter the target device IP address in the text field, depending on your selection in the previous step.
-
Click the Codec drop-down and select the codec to use for the mean opinion score (MOS) and the impairment/calculated planning impairment factor (ICPIF) score.
-
In the Source Voice Port field, enter the voice port name (for example, 0/1/1). This is not a TCP/UDP port number.
-
In the ICPIF Factor field, enter the ICPIF factor number that determines the type of access and how the service is to be used. The following are ICPIF factor numbers.
-
0 = Conventional Wire Line
-
5 = Mobility within Building
-
10 = Mobility within Geographic Area
-
20 = Access to Hard-to-Reach Location
-
-
Click + to expand the Advanced section.
-
In the Frequency field, enter the number of seconds indicating how often the router should perform the test. This needs to be greater than 0 and should be slightly less than the poll frequency of the device.
-
In the Duration field, enter the IP SLA duration.
-
Click the Source IP drop-down and select the IP address of the source device.
-
-
TCP Connect or UDP Echo
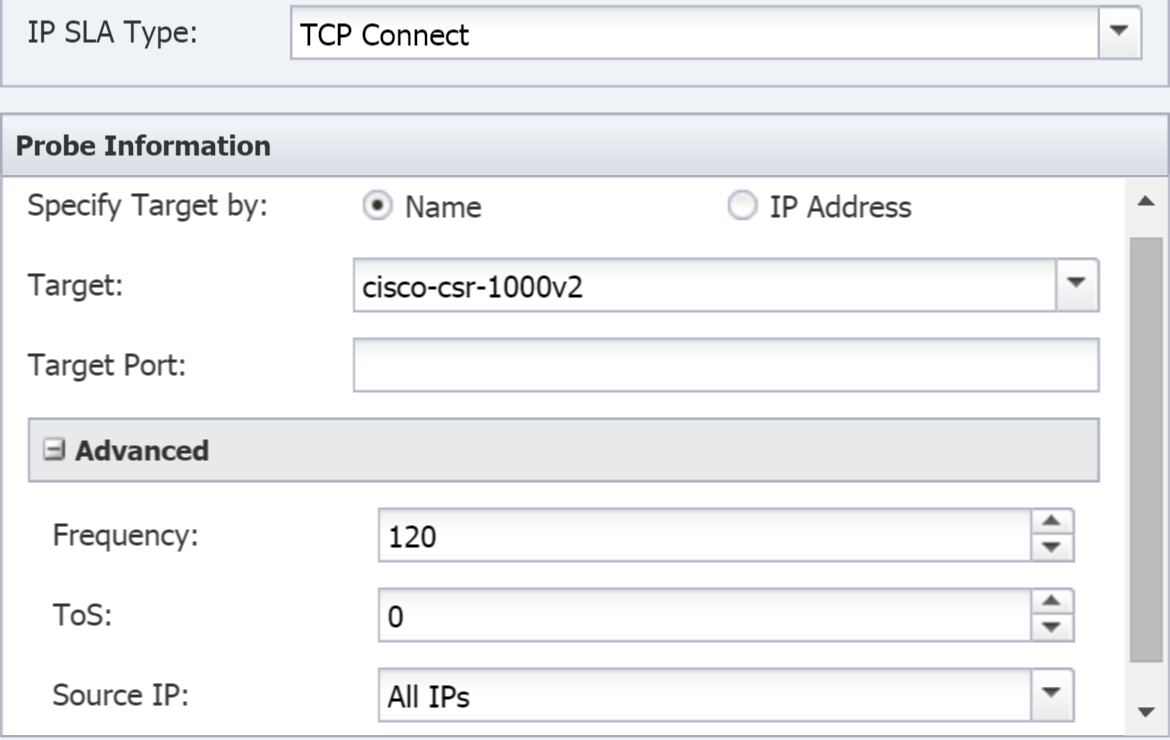
-
For Specify Target by, select one of the following:
-
Name - to select the name of the target device from a drop-down list in the next step.
-
IP Address - to enter the IP address of the target device in the next step.
-
-
In the Target field, either click the drop-down and select the target device by name or enter the target device IP address in the text field, depending on your selection in the previous step.
-
In the Target Port field, enter the port number (between 0 and 65535) to connect to.
-
Click + to expand the Advanced section.
-
In the Frequency field, enter the number of seconds indicating how often the router should perform the test. This needs to be greater than 0 and should be slightly less than the poll frequency of the device.
-
In the ToS field, enter the type of service (ToS) byte number in the IP header of an IP SLA's operation. This should be a number between 0 and 255.
-
Click the Source IP drop-down and select the IP address of the source device.
-
-
UDP Jitter
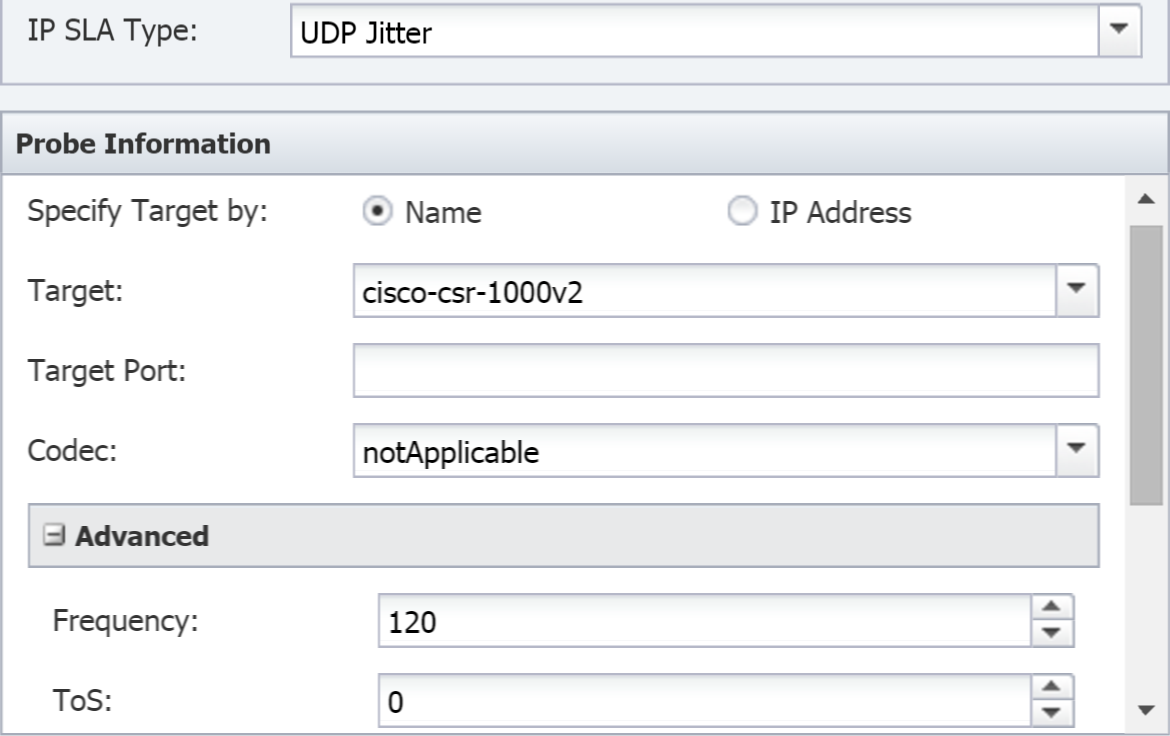
-
For Specify Target by, select one of the following:
-
Name - to select the name of the target device from a drop-down list in the next step.
-
IP Address - to enter the IP address of the target device in the next step.
-
-
In the Target field, either click the drop-down and select the target device by name or enter the target device IP address in the text field, depending on your selection in the previous step.
-
In the Target Port field, enter the port number (between 0 and 65535) to connect to.
-
Click the Codec drop-down and select the codec to use for the mean opinion score (MOS) and the impairment/calculated planning impairment factor (ICPIF) score.
-
Click + to expand the Advanced section.
-
In the Frequency field, enter the number of seconds indicating how often the router should perform the test. This needs to be greater than 0 and should be slightly less than the poll frequency of the device.
-
In the ToS field, enter the type of service (ToS) byte number in the IP header of an IP SLA's operation. This should be a number between 0 and 255.
-
In the Packet # field, enter the number of packets to send.
-
In the Interval field, specify in milliseconds the interval between packets.
-
Click the Precision drop-down and select the level of precision to measure at. The precision level that you select must be supported by the compliance revision (Revision 9 or later) of the sender and target IP SLA.
-
Click the Source IP drop-down and select the IP address of the source device.
-
-
Video
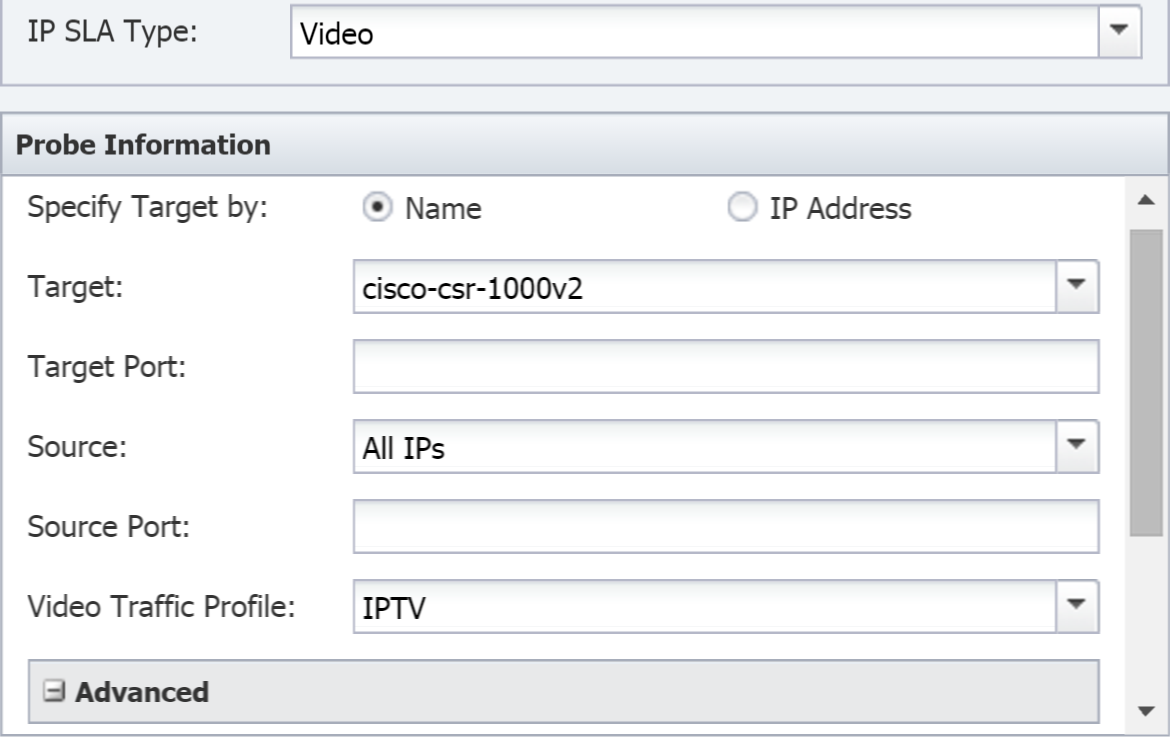
-
For Specify Target by, select one of the following:
-
Name - to select the name of the target device from a drop-down list in the next step.
-
IP Address - to enter the IP address of the target device in the next step.
-
-
In the Target field, either click the drop-down and select the target device by name or enter the target device IP address in the text field, depending on your selection in the previous step.
-
In the Target Port field, enter the port number (between 0 and 65535) to connect to.
-
Click the Source drop-down and select the IP address of the source device.
-
In the Source Port field, enter the port number of the source device.
-
Click the Video Traffic Profile drop-down and select one of the following:
-
IPTV - indicates that the profile is for Internet Protocol television (IPTV), a system that uses the Internet Protocol suite to deliver television services over a packet-switched network, such as the Internet. This is opposed to traditional means of delivering television services–for example, over a terrestrial cable or via satellite signal.
-
IPVSC - indicates that the profile is for an IP surveillance camera
-
TELEPRESENCE - indicates that the profile is used for telepresence technologies, which enable people to feel as if they are present somewhere other than their actual location. Examples of telepresence technologies include video conferencing and telerobotics.
-
-
Click + to expand the Advanced section.
-
In the Frequency field, enter the number of seconds indicating how often the router should perform the test. This needs to be greater than 0 and should be slightly less than the poll frequency of the device.
-
In the Duration field, enter the IP SLA duration.
-
In the ToS field, enter the type of service (ToS) byte number in the IP header of an IP SLA's operation. This should be a number between 0 and 255.
-
-
VoIP
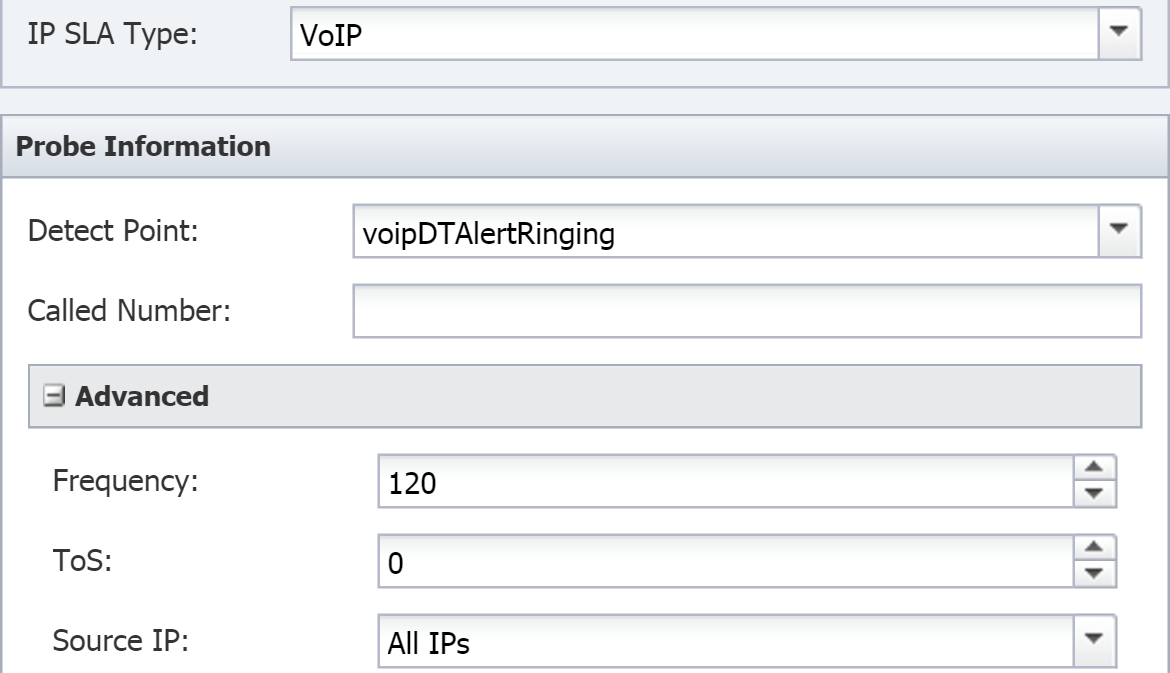
-
Click the Detect Point drop-down and select the detect point.
-
In the Called Number field, enter the telephone number called.
-
Click + to expand the Advanced section.
-
In the Frequency field, enter the number of seconds indicating often the router should perform the test. This needs to be greater than 0 and should be slightly less than the poll frequency of the device.
-
In the ToS field, enter the type of service (ToS) byte number in the IP header of an IP SLA's operation. This should be a number between 0 and 255.
-
Click the Source IP drop-down and select the IP address of the source device.
-
-
-
Click Save.
Import CSV
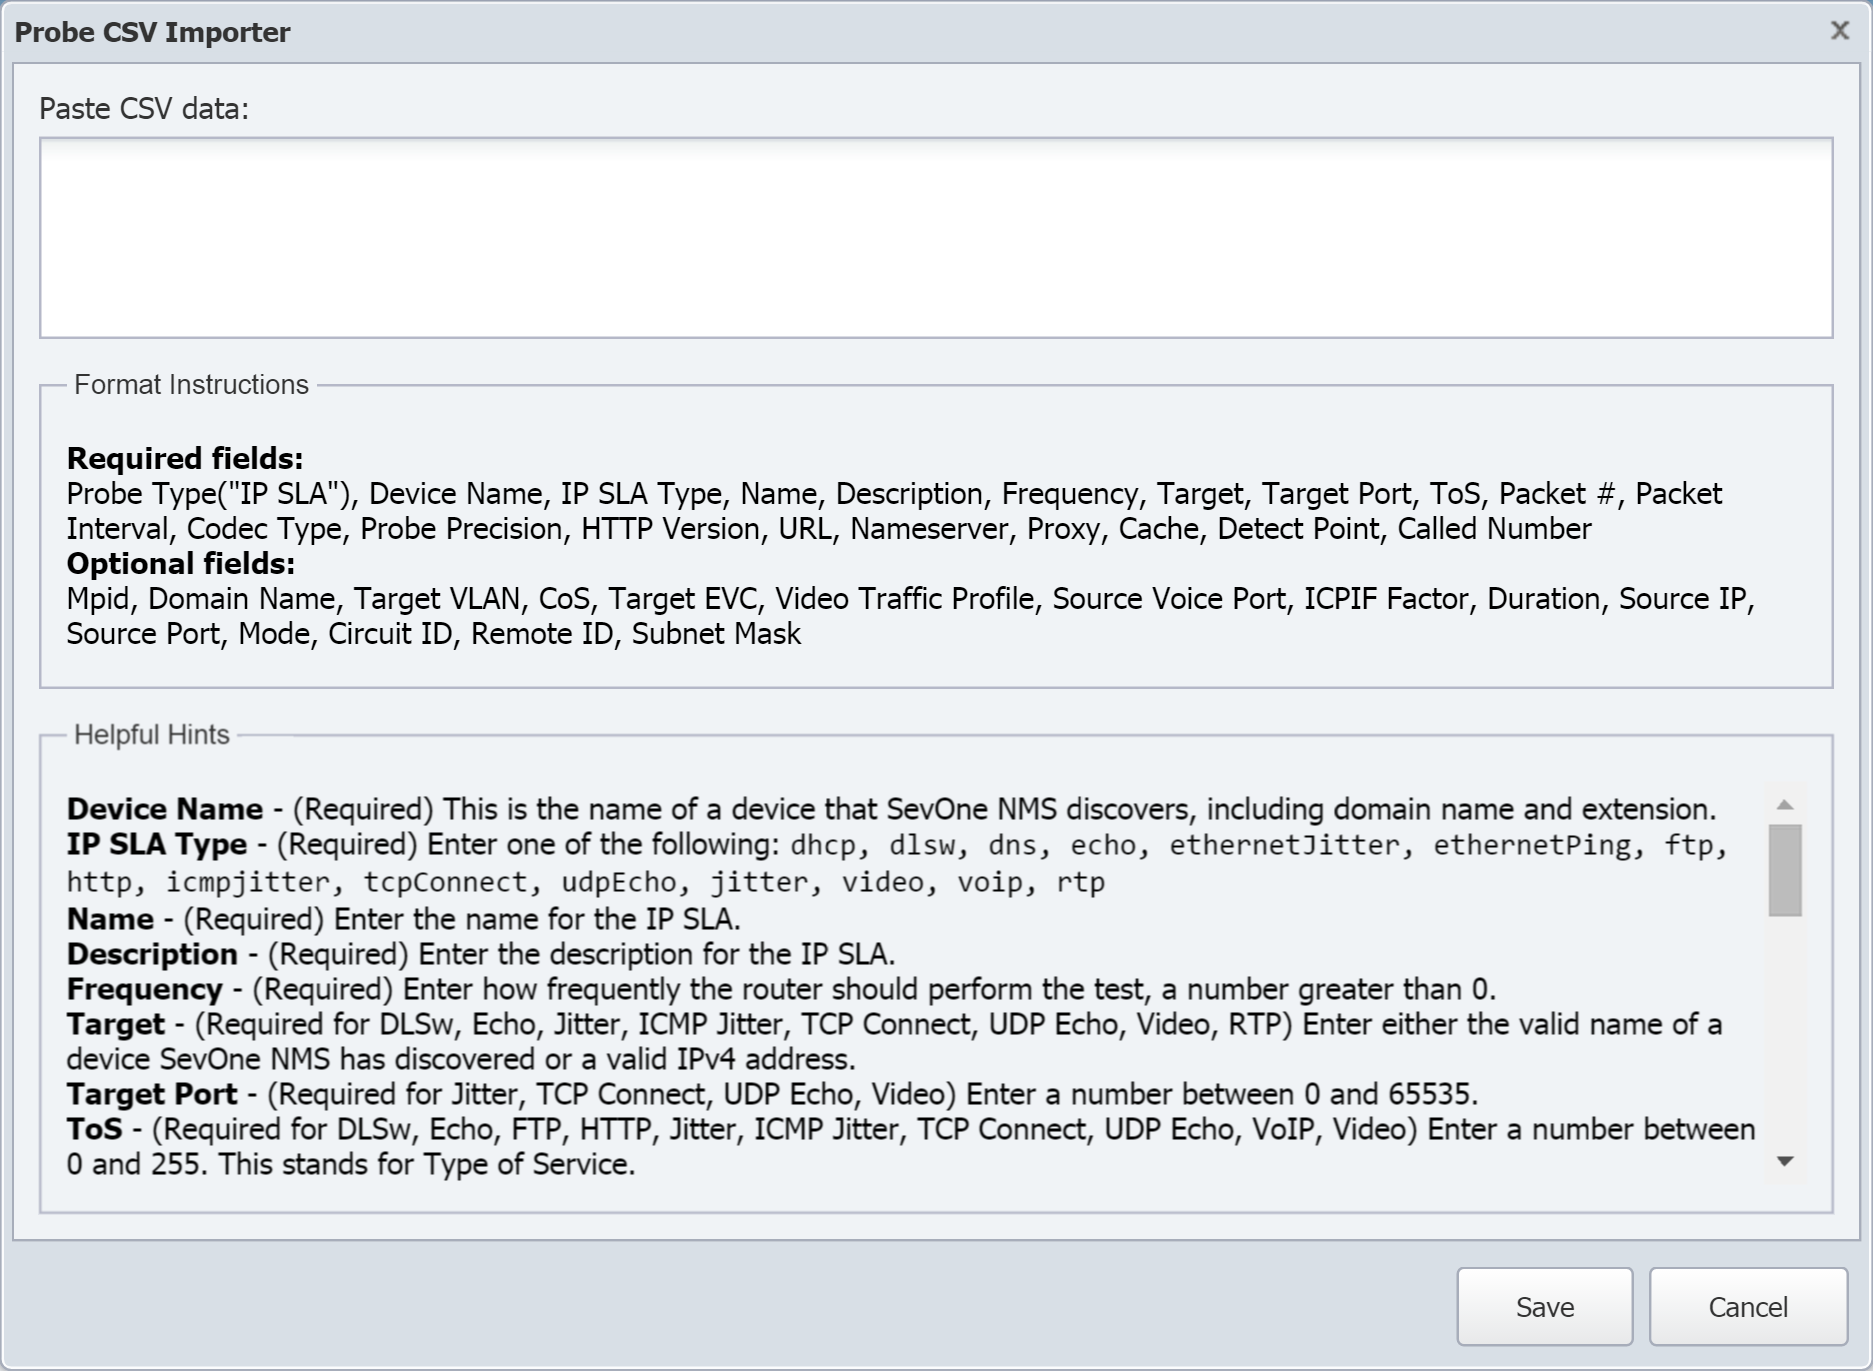
You can use the Probe CSV Importer to import probes into SevOne NMS. The steps for importing probes into SevOne NMS are below.
Before getting started, you will need to prepare a comma delimited file using the application of your choice. The .csv file(s) must be encoded in UTF-8. Make sure to complete all required fields. The IP SLA type entry determines which fields are required. Leave the fields that relate to other IP SLA types blank and delimited by the applicable number of commas. The following is a rundown of the required information for the .csv file, including:
-
File format for required fields
-
Conditionally required fields for specific probe types
-
Fields required in the .csv file
-
Fields that may be required in the .csv file
File format for the required fields:
Probe Type, Device Name, IP SLA Type, Name, Description, Frequency, Target, Target Port, ToS, Packet #, Packet Interval, Codec Type, Probe Precision, HTTP Version, URL, Nameserver, Proxy, Cache, Detect Point, Called Number
Format of conditionally required fields for specific probe types:
MPID, Domain Name, Target VLAN, CoS, Target EVC, Video Traffic Profile, Source Voice Port, ICPIF Factor, Duration, Source IP, Source Port, Mode, Circuit ID, Remote ID, Subnet Mask
The following lists provide descriptions of fields required for all IP SLA types, fields required by specific IP SLA types, and optional fields.
Fields required for all IP SLA types:
-
Probe Type - (Required) Enter IP SLA.
-
Device Name - (Required) Enter the name of a device that SevOne NMS discovers, including domain name and extension.
-
IP SLA Type - (Required) Enter one of the following: dhcp, dlsw, dns, echo, ethernetJitter, ethernetPing, ftp, http, icmpjitter, rtp, tcpConnect, udpEcho, udpJitter, video, voip.
-
Name - (Required) Enter the name for the probe.
-
Description - (Required) Enter the description for the probe.
-
Frequency - (Required) Enter a number greater than 0 to indicate how frequently the router should perform the test.
Fields required for specific SLA types:
Enter commas to account for all fields up to the last field required for each specific IP SLA type. Leave non-applicable fields empty when they are not required for the protocol.
Example: Video needs five comma delimited empty fields (for MPID, Domain Name, Target VLAN, CoS, and Target EVC) before the four required Video fields. You do not need to enter commas for any subsequent fields.
-
Target - (Required for DHCP, DLSw, Echo, ICMP Jitter, RTP, TCP Connect, UDP Echo, UDP Jitter, Video) Enter either the valid name of a device in SevOne NMS or a valid IPv4 address for the device.
-
Target Port - (Required for TCP Connect, UDP Echo, UDP Jitter, Video) Enter a number between 0 and 65535.
-
ToS - (Required for DLSw, Echo, FTP, HTTP, ICMP Jitter, TCP Connect, UDP Echo, UDP Jitter, Video, VoIP) Enter a number between 0 and 255.
-
Packet # - (Required for Ethernet Jitter, ICMP Jitter, UDP Jitter) Enter a number.
-
Packet Interval - (Required for Ethernet Jitter, ICMP Jitter, UDP Jitter) Enter a number.
-
Codec Type - (Required for RTP, UDP Jitter) Enter one of the following: notApplicable, g711ulaw, g711alaw, g729a.
-
Probe Precision - (Required for UDP Jitter) Enter one of the following: milliseconds, microseconds.
-
HTTP Version - (Required for HTTP) Enter one of the following: 0.9, 1.0, 1.1.
-
Target URL - (Required for FTP, HTTP) Enter a valid URL.
-
Nameserver IP - (Required for DNS, HTTP) Enter a valid IPv4 address.
-
Proxy - (Required for HTTP) Enter a valid IPv4 address.
-
Cache - (Required for HTTP) Enter either On for enabled or Off for disabled.
-
Detect Point - (Required for VoIP) Enter one of the following: voipDTAlertRinging, voipDTConnectOK.
-
Called Number - (Required for VoIP) Enter a valid phone number.
-
MPID - (Required for Ethernet Jitter, Ethernet Ping) Enter a number.
-
Domain Name - (Required for DNS, Ethernet Jitter, Ethernet Ping) Enter a valid domain.
-
Target VLAN - (Required for Ethernet Jitter, Ethernet Ping) Enter a number between 1 and 4095 (inclusive).
-
CoS - (Required for Ethernet Jitter, Ethernet Ping) Enter a number between 0 and 255.
-
Target EVC - (Required for Ethernet Jitter, Ethernet Ping) Enter a valid number.
-
Video Traffic Profile - (Required for Video) Enter one of the following: IPTV, IPVSC, TELEPRESENCE.
-
Source Voice Port - (Required for RTP) Enter a text string (for example, 0/1/1).
-
ICPIF Factor - (Required for RTP) Enter a number between 0 and 20.
-
Duration - (Required for RTP, Video) Enter a number.
-
Source IP - (Required for DNS, Echo, FTP, HTTP, ICMP Jitter, RTP, TCP Connect, UDP Echo, UDP Jitter, Video, VoIP, DHCP) Enter a valid IPv4 address.
-
Source Port - (Required for Video) Enter a number between 0 and 65535.
Optional fields
-
Mode - (Optional for FTP) Enter Active or Passive. If left blank, this defaults to Passive.
-
Circuit ID - (Optional for DHCP) Enter a hexadecimal number between 000000 and ffffff.
-
Remote ID - (Optional for DHCP) Enter a hexadecimal number between 000000 and ffffff.
-
Subnet Mask - (Optional for DHCP) Enter a hexadecimal number between 000000 and ffffff.
Once you have your comma delimited file ready, perform the following steps to import probes.
-
Under Probe List, click Import CSV to display the Probe CSV Importer pop-up.
-
Open your .csv file. Then copy and paste its contents into the Paste CSV data text field.
-
In the Paste CSV data text field, edit the information from the .csv file.
-
Click Save.
-
A message will appear below the Paste CSV data text field indicating whether or not the import was successful. If the import fails, the Error log field will appear, listing any error messages with the corresponding lines from the text field. SevOne NMS imports all probes that do not have errors. Fix any errors in the import file and repeat the steps above.
Messages
The Messages tab lets you view the messages that SevOne NMS generates during the discovery of probes. These messages occur each time SevOne NMS issues an snmpset command. They display the command and the result of any errors.
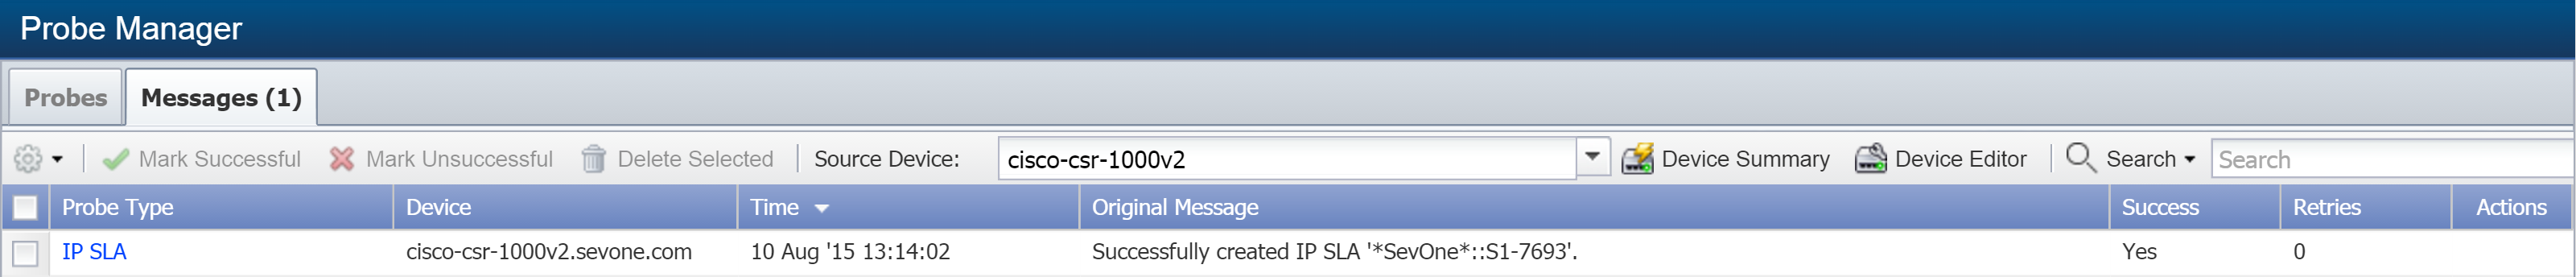
The following probe message data displays in the list.
-
Probe Type - displays the probe type. Currently IP SLA is the only supported probe type.
-
Device - displays the name of the source device.
-
Time - displays the time when SevOne NMS sent the command.
-
Original Message - displays the probe message.
-
Success - displays Yes when the command is successful or No when the command is unsuccessful. Yes appears only for the first successful discovery of each probe.
-
Retries - displays the number of retries.
Perform the following steps to view and manage messages.
-
Select the Messages tab.
-
Click the Source Device drop-down and select a device to view messages for it.
-
Select the check box for a message and do one of the following:
-
Click
 and select Retry Commands to retry the probe command.
-
Select Mark Successful to force the success to be marked as Yes.
-
Select Mark Unsuccessful to force the success to be marked as No.
-
Select Delete Selected to delete the probe message (you can select more than one message).
-
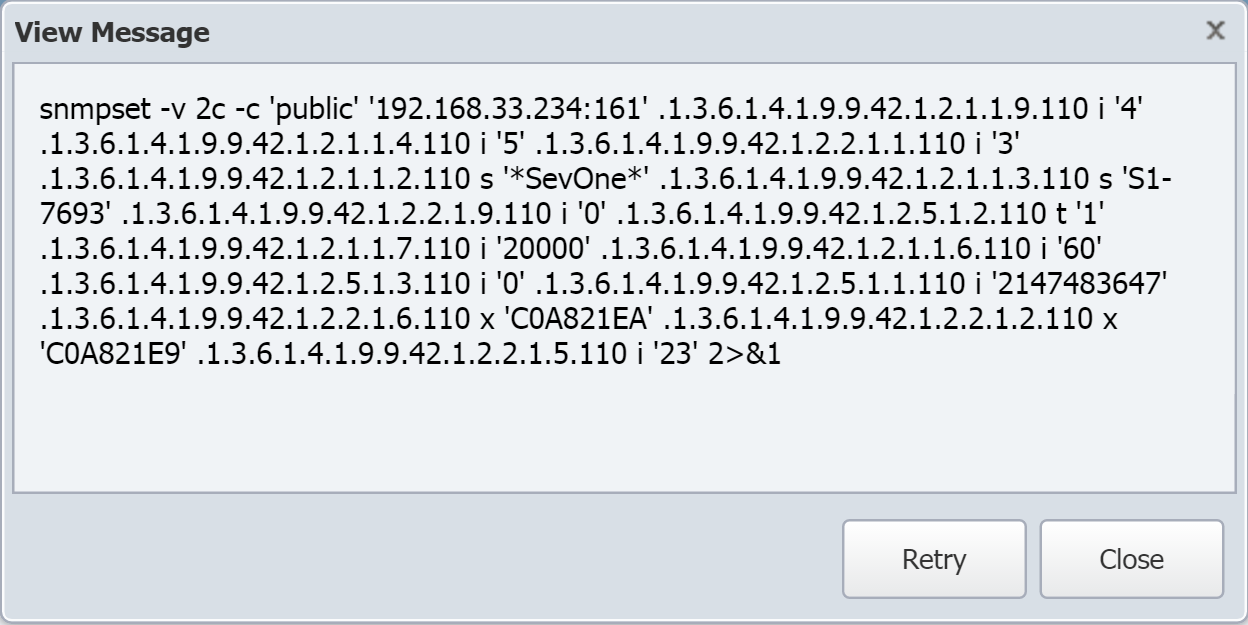
-
You can also retry the command by clicking on the Probe Type link. When you do this, the command displays in a pop-up. Click Retry to retry the command.
Supported IP SLAs
SevOne NMS supports the following IP SLAs.
-
DHCP - has the router perform an IP address lease request/tear down operation. The IP SLA plugin collects the following DHCP data.
-
Availability - whether or not the IP SLA succeeded.
-
Average Time - how long the operation took.
-
-
DLSw - has the router perform a keep alive operation to measure the response time of a DLSw peer. The IP SLA plugin collects the following DLSw data.
-
Availability - whether or not the IP SLA succeeded.
-
Response Time - how long the operation took.
-
-
DNS - has the router perform a name lookup of an IP address or host name. The IP SLA plugin collects the following DNS data.
-
Availability - whether or not the IP SLA succeeded.
-
Response Time - how long the operation took.
-
-
Echo - has the router perform a timed echo request/response operation. The IP SLA plugin collects the following Echo data.
-
Availability - whether or not the IP SLA succeeded.
-
Ping Time - how long the operation took.
-
-
Ethernet Jitter - has the router send and receive Ethernet data frames between Ethernet Connectivity Fault Management (CFM) maintenance end points (MEPs) to measure the latency, jitter, and frame loss between two MEPs. See the Ethernet Jitter OIDs section for a list of Ethernet Jitter IP SLA OIDs. The IP SLA plugin performs the following calculations for Ethernet Jitter data.
-
Lost Frames calculations:
-
Lost frames (source -> destination) OID: 1.6.1.4.1.9.9.585.1.3.1.1.26
-
Lost frames = ipslaEtherJitterLatestFrmMIA
-
Sent frames = ipslaEtherJitterLatestNumRTT
-
Lost frames ratio = 100 * lost frames / sent frames
-
-
The IP SLA plugin collects the following Ethernet Jitter data.
-
Availability - whether or not the IP SLA succeeded.
-
Average Delay DS - the average delay from the destination to the source.
-
Average Delay SD - the average delay from the source to the destination.
-
Average Jitter - the average jitter.
-
Average Jitter SD - the average jitter from the source to the destination.
-
Average Jitter DS - the average jitter from the destination to the source.
-
Average RTT - the average round trip time.
-
Frames Unprocessed - the number of frames that were not processed due to high CPU load.
-
Interarrival Jitter In - the mean deviation (smoothed absolute value) of the difference in frame spacing for a pair of packets from the destination to the source.
-
Interarrival Jitter Out - the mean deviation (smoothed absolute value) of the difference in frame spacing for a pair of packets from the source to the destination.
-
Late Frames - the number of frames that arrived late.
-
Lost Frames - the number of frames that did not arrive.
-
Frames Skipped - the number of frames skipped.
-
Negative Jitter Average - the number of frames that reduced jitter.
-
Negative Jitter Percent - the percentage of frames that reduced jitter.
-
Lost Frames DS - the number of frames lost from the destination to the source.
-
Frame Loss Ratio - the ratio of lost frames to total frames.
-
Lost Frames SD - the number of frames lost from the source to the destination.
-
Frames Out of Sequence - the number of frames received out of sequence.
-
Positive Jitter Average - the number of frames that it takes to compensate for jitter.
-
Positive Jitter Percent - the percentage of frames that introduced jitter.
-
Sent Frames - the number of frames sent.
-
-
Ethernet Ping - has the router send and receive Ethernet data frames between Ethernet Connectivity Fault Management (CFM) maintenance end points (MEPs) to measure the latency between two MEPs. The IP SLA plugin collects the following Ethernet Ping data.
-
Availability - whether or not the IP SLA succeeded.
-
Response Time - how long the operation took.
-
-
FTP - has the router download an FTP file and record how long it takes. This is a good way to determine if an important FTP site/file is available at a remote location. The IP SLA plugin collects the following FTP data.
-
Availability - whether or not the IP SLA succeeded.
-
Response Time - how long the operation took.
-
-
HTTP - has the router perform a round-trip time to get a web page. The IP SLA plugin collects the following HTTP data.
-
Availability - whether or not the IP SLA succeeded.
-
Response Time - how long the operation took.
-
-
ICMP jitter - has the router perform delay variance analysis. The IP SLA plugin collects the following ICMP jitter data.
-
Availability - whether or not the IP SLA succeeded.
-
Average Delay DS - the average delay from the destination to the source.
-
Average Delay SD - the average delay from the source to the destination.
-
Average Jitter - the average jitter.
-
Average RTT - the average round-trip time.
-
Interarrival Jitter In - the mean deviation (smoothed absolute value) of the difference in packet spacing for a pair of packets from the destination to the source.
-
Interarrival Jitter Out - the mean deviation (smoothed absolute value) of the difference in packet spacing for a pair of packets form the source to the destination.
-
Late Packets - the number of packets that arrived late.
-
Lost Packets - the number of packets that did not arrive.
-
Negative Jitter Average - the number of packets that introduced jitter.
-
Negative Jitter Percent - the percentage of packets that introduced jitter.
-
Packet Loss Ratio - the ratio of lost packets to total packets.
-
Packets Out of Sequence - the number of packets received out of sequence.
-
Positive Jitter Average - the number of packets that it takes to compensate for jitter.
-
Sent Packets - the number of packets sent.
-
-
RTP - has the router gather network performance related statistics for a call. Available statistical measurements for VoIP networks include jitter, frame loss, Mean Opinion Score for Conversational Quality (MOS-CQ), and Mean Opinion Score for Listening Quality (MOS-LQ). The IP SLA plugin collects the following RTP data.
-
Availability - whether or not the IP SLA succeeded.
-
Connection Time - how long the operation took.
-
-
tcpConnect - has the router perform a timed TCP connect operation. The IP SLA plugin collects the following tcpConnect data.
-
Availability - whether or not the IP SLA succeeded.
-
Connection Time - how long the operation took.
-
-
udpEcho - has the router perform a timed UDP packet send/receive operation. The IP SLA plugin collects the following udpEcho data.
-
Availability - whether or not the IP SLA succeeded.
-
Echo Time - how long the operation took.
-
-
UDP Jitter - has the router perform a delay variance analysis over UDP, usually to simulate voice traffic. The IP SLA plugin collects the following UDP Jitter data.
-
Availability - whether or not the IP SLA succeeded.
-
Average Delay DS - the average delay from the destination to the source.
-
Average Delay SD - the average delay from the source to the destination.
-
Average Jitter - the average jitter.
-
Average RTT - the average round-trip time.
-
Bandwidth - the bandwidth used for the operation.
-
Calculated Planning Impairment Factor (ICPIF) - attempts to quantify, for comparison and planning purposes, the key impairments to voice quality that are encountered in the network.
-
Interarrival Jitter In - the mean deviation (smoothed absolute value) of the difference in packet spacing for a pair of packets from the destination to the source.
-
Interarrival Jitter Out - the mean deviation (smoothed absolute value) of the difference in packet spacing for a pair of packets from the source to the destination.
-
Late Packets - the number of packets that arrived late.
-
Lost Packets - the number of packets that did not arrive.
-
Mean Opinion Score (MOS) - a common benchmark used to determine the quality of sound produced by specific codes rated on a scale of 1 (poor quality) to 5 (excellent quality).
-
Negative Jitter Average - the number of packets that reduced jitter.
-
Negative Jitter Percent - the percentage of packets that reduced jitter.
-
NTP State - the NTP state of the operation.
-
Packet Loss DS - the packets lost from the destination to the source.
-
Packet Loss Ratio - the ratio of lost packets to total packets.
-
Packet Loss SD - the packets lost form the source to the destination.
-
Packets Out of Sequence - the number of packets received out of sequence.
-
Positive Jitter Average - the number of packets that introduced jitter.
-
Positive Jitter Percent - the percentage of packets that introduced jitter.
-
Sent Packets - the number of packets sent.
-
Sigma Delay DS - standard deviation of the destination-to-source delay.
-
Sigma Delay SD - standard deviation of the source-to-destination delay.
-
Sigma Jitter DS - standard deviation of the destination-to-source jitter.
-
Sigma Jitter SD - standard deviation of the source-to-destination jitter.
-
Sigma RTT - standard deviation of the round-trip time.
-
UnSync RTTs - the number of probes received that were out of sync with NTP.
-
-
Video - has the router perform a one way video operation, streamed from the source to the destination. The IP SLA plugin collects the following Video data.
-
Availability - whether or not the IP SLA succeeded.
-
Average Delay DS - the average delay from the destination to the source.
-
Average Delay SD - the average delay from the source to the destination.
-
Interarrival Jitter Out - the mean deviation (smoothed absolute value) of the difference in packet spacing for a pair of packets from source to destination.
-
IPDV Average Jitter - the instantaneous packet delay variation.
-
Late Packets - the number of packets that arrived late.
-
Lost Packets - the number of packets that did not arrive.
-
Negative Jitter Average - the number of packets that reduced jitter.
-
Negative Jitter Percent - the percentage of packets that reduced jitter.
-
NTP State - the NTP state of the operation.
-
Packet Loss Ratio - the ratio of lost packets to total packets.
-
Packet Loss SD - the packets lost form the source to the destination.
-
Packets Out of Sequence - the number of packets received out of sequence.
-
Positive Jitter Average - the number of packets that introduced jitter.
-
Positive Jitter Percent - the percentage of packets that introduced jitter.
-
Sent Packets - the number of packets sent.
-
UnSync RTTs - the number of probes received that were out of sync with NTP.
-
-
VoIP - has the router measure your network's response time for setting up a VoIP call. The IP SLA plugin collects the following VoIP data.
-
Availability - whether or not the IP SLA succeeded.
-
Time Until Ring - Hhow long it takes the sender to ring the receiver.
-
IP SLA Jitter Operation
SevOne NMS calculates the following metrics for IP SLA jitter tests.
Average RTT = rttMonLatestJitterOperRTTSum / rttMonLatestJitterOperNumOfRTT
For compliance revision 10 or higher:
Average Jitter = rttMonLatestJitterOperAvgJitter
For compliance revision 9 or lower:
Average Jitter =
rttMonLatestJitterOperSumOfPositivesDS + rttMonLatestJitterOperSumOfNegativesDS +
rttMonLatestJitterOperSumOfPositivesSD + rttMonLatestJitterOperSumOfNegativesSD
---------------------------------------------------------------------------------
rttMonLatestJitterOperNumOfPositivesDS + rttMonLatestJitterOperNumOfNegativesDS +
rttMonLatestJitterOperNumOfPositivesSD + rttMonLatestJitterOperNumOfNegativesSD
Ethernet Jitter OIDs
The following are the Ethernet Jitter OIDs SevOne NMS that gets.
-
ipslaEtherJitterLatestNumRTT
-
ipslaEtherJitterLatestRTTSum
-
ipslaEtherJitterLatestRTTSum2
-
ipslaEtherJitterLatestRTTMin
-
ipslaEtherJitterLatestRTTMax
-
ipslaEtherJitterLatestMinPosSD
-
ipslaEtherJitterLatestMaxPosSD
-
ipslaEtherJitterLatestNumPosSD
-
ipslaEtherJitterLatestSumPosSD
-
ipslaEtherJitterLatestMinNegSD
-
ipslaEtherJitterLatestMaxNegSD
-
ipslaEtherJitterLatestNumNegSD
-
ipslaEtherJitterLatestSumNegSD
-
ipslaEtherJitterLatestMinPosDS
-
ipslaEtherJitterLatestMaxPosDS
-
ipslaEtherJitterLatestNumPosDS
-
ipslaEtherJitterLatestSumPosDS
-
ipslaEtherJitterLatestMinNegDS
-
ipslaEtherJitterLatestMaxNegDS
-
ipslaEtherJitterLatestNumNegDS
-
ipslaEtherJitterLatestSumNegDS
-
ipslaEtherJitterLatestFrmLossSD
-
ipslaEtherJitterLatestFrmLossDS
-
ipslaEtherJitterLatestFrmOutSeq
-
ipslaEtherJitterLatestFrmMIA
-
ipslaEtherJitterLatestFrmSkipped
-
ipslaEtherJitterLatestSense
-
ipslaEtherJitterLatestFrmLateA
-
ipslaEtherJitterLatestMinSucFrmL
-
ipslaEtherJitterLatestMaxSucFrmL
-
ipslaEtherJitterLatestOWSumSD
-
ipslaEtherJitterLatestOWSum2SD
-
ipslaEtherJitterLatestOWMinSD
-
ipslaEtherJitterLatestOWMaxSD
-
ipslaEtherJitterLatestOWSumDS
-
ipslaEtherJitterLatestOWSum2DS
-
ipslaEtherJitterLatestOWMinDS
-
ipslaEtherJitterLatestOWMaxDS
-
ipslaEtherJitterLatestNumOW
-
ipslaEtherJitterLatestAvgJitter
-
ipslaEtherJitterLatestAvgSDJ
-
ipslaEtherJitterLatestAvgDSJ
-
ipslaEtherJitterLatestOWAvgSD
-
ipslaEtherJitterLatestOWAvgDS
-
ipslaEtherJitterLatestIAJOut
-
ipslaEtherJitterLatestIAJIn
-
ipslaEtherJLatestFrmUnProcessed
Terms
|
Internet Protocol Service Level Agreement (IP SLA) |
A Cisco feature that enables performance monitoring between two Cisco routers. |
|
IP SLA Responder |
A Cisco router that responds to IP SLA tests performed by another Cisco router. |