Table of Contents (Start)
- Topics
- Introducing SevOne
- Login
- Startup Wizard
- Dashboard
- Global Search - Advanced Search
- Report Manager
- Report Attachment Wizard
- Report Properties
- Report Interactions
- Instant Graphs
- TopN Reports
- Alerts
- Alert Archives
- Alert Summary
- Instant Status
- Status Map Manager
- Edit Maps
- View Maps
- FlowFalcon Reports
- NBAR Reports
- Logged Traps
- Unknown Traps
- Trap Event Editor
- Trap Destinations
- Trap Destination Associations
- Policy Browser
- Create and Edit Policies
- Webhook Definition Manager
- Threshold Browser
- Create and Edit Thresholds
- Probe Manager
- Discovery Manager
- Device Manager
- New Device
- Edit Device
- Object Manager
- High Frequency Poller
- Device Summary
- Device Mover
- Device Groups
- Object Groups
- Object Summary
- Object Rules
- VMware Browser
- AWS Plugin
- Azure Plugin (Public Preview)
- Calculation Plugin
- Database Manager
- Deferred Data Plugin
- DNS Plugin
- HTTP Plugin
- ICMP Plugin
- IP SLA Plugin
- JMX Plugin
- NAM
- NBAR Plugin
- Portshaker Plugin
- Process Plugin
- Proxy Ping Plugin
- SDWAN Plugin
- SNMP Plugin
- VMware Plugin
- Web Status Plugin
- WMI Plugin
- xStats Plugin
- Indicator Type Maps
- Device Types
- Object Types
- Object Subtype Manager
- Calculation Editor
- xStats Source Manager
- User Role Manager
- User Manager
- Session Manager
- Authentication Settings
- Preferences
- Cluster Manager
- Maintenance Windows
- Processes and Logs
- Metadata Schema
- Baseline Manager
- FlowFalcon View Editor
- Map Flow Objects
- FlowFalcon Views
- Flow Rules
- Flow Interface Manager
- MPLS Flow Mapping
- Network Segment Manager
- Flow Protocols and Services
- xStats Log Viewer
- SNMP Walk
- SNMP OID Browser
- MIB Manager
- Work Hours
- Administrative Messages
- Enable Flow Technologies
- Enable JMX
- Enable NBAR
- Enable SNMP
- Enable Web Status
- Enable WMI
- IP SLA
- SNMP
- SevOne Data Publisher
- Quality of Service
- Perl Regular Expressions
- Trap Revisions
- Integrate SevOne NMS With Other Applications
- Email Tips and Tricks
- SevOne NMS PHP Statistics
- SevOne NMS Usage Statistics
- Glossary and Concepts
- Map Flow Devices
- Trap v3 Receiver
- Guides
- Quick Start Guides
- AWS Quick Start Guide
- Azure Quick Start Guide (Public Preview)
- Data Miner Quick Start Guide
- Flow Quick Start Guide
- Group Aggregated Indicators Quick Start Guide
- IP SLA Quick Start Guide
- JMX Quick Start Guide
- Metadata Quick Start Guide
- RESTful API Quick Start Guide
- Self-monitoring Quick Start Guide
- SevOne NMS Admin Notifications Quick Start Guide
- SNMP Quick Start Guide
- Synthetic Indicator Types Quick Start Guide
- Topology Quick Start Guide
- VMware Quick Start Guide
- Web Status Quick Start Guide
- WMI Quick Start Guide
- xStats Quick Start Guide
- xStats Adapter - Accedian Vision EMS (TM) Quick Start Guide
- Deployment Guides
- Automated Build / Rebuild (Customer) Instructions
- Generate a Self-Signed Certificate or a Certificate Signing Request
- SevOne Best Practices Guide - Cluster, Peer, and HSA
- SevOne Data Platform Security Guide
- SevOne NMS Implementation Guide
- SevOne NMS Installation Guide - Virtual Appliance
- SevOne NMS Advanced Network Configuration Guide
- SevOne NMS Installation Guide
- SevOne NMS Port Number Requirements Guide
- SevOne NMS Upgrade Process Guide
- SevOne Physical Appliance Pre-Build BIOS and RAID Configuration Guide
- SevOne SAML Single Sign-On Setup Guide
- Cloud Platforms
- Other Guides
- Quick Start Guides
Create and Edit Policies
The Policy Editor enables you to create and edit policies.
To access the Policy Editor from the navigation bar, click the Events menu, select Configuration, and then select Policy Browser to display the Policy Browser. On the Policy Browser, click Create Policy to create a new policy or click a policy name in the list to modify it.
The Policy Editor enables you to define a policy. When you finish the policy definition, click one of the following buttons.
-
When you edit a policy, click Save to save the policy changes.
-
Click Save as New to create a copy of the policy.
Tab 'General Settings'
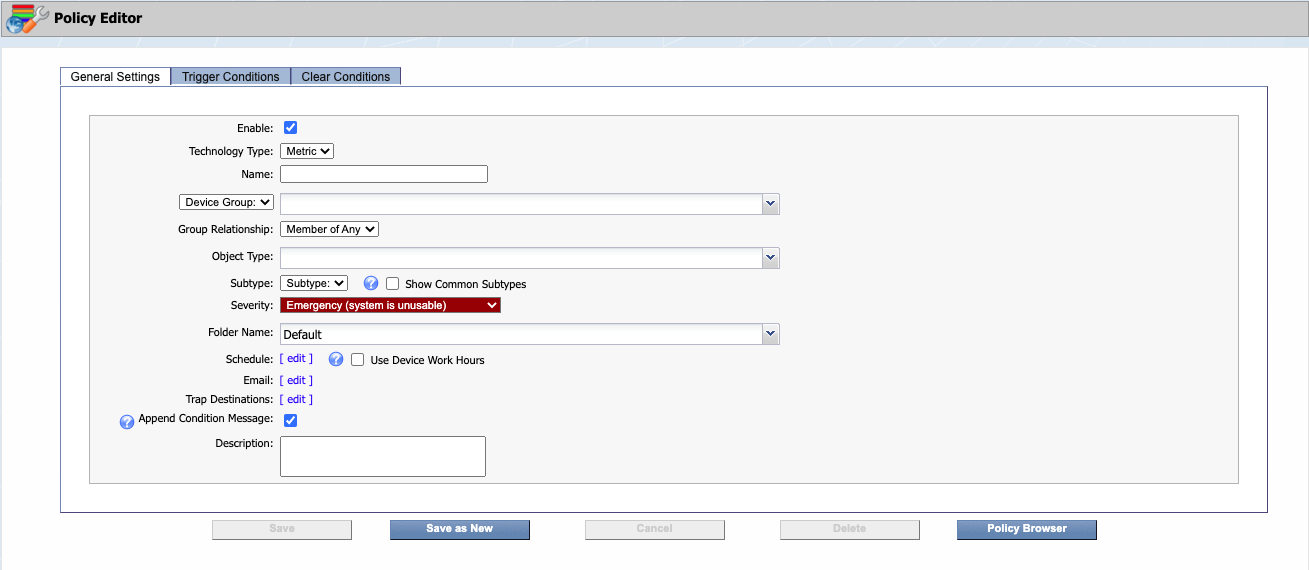
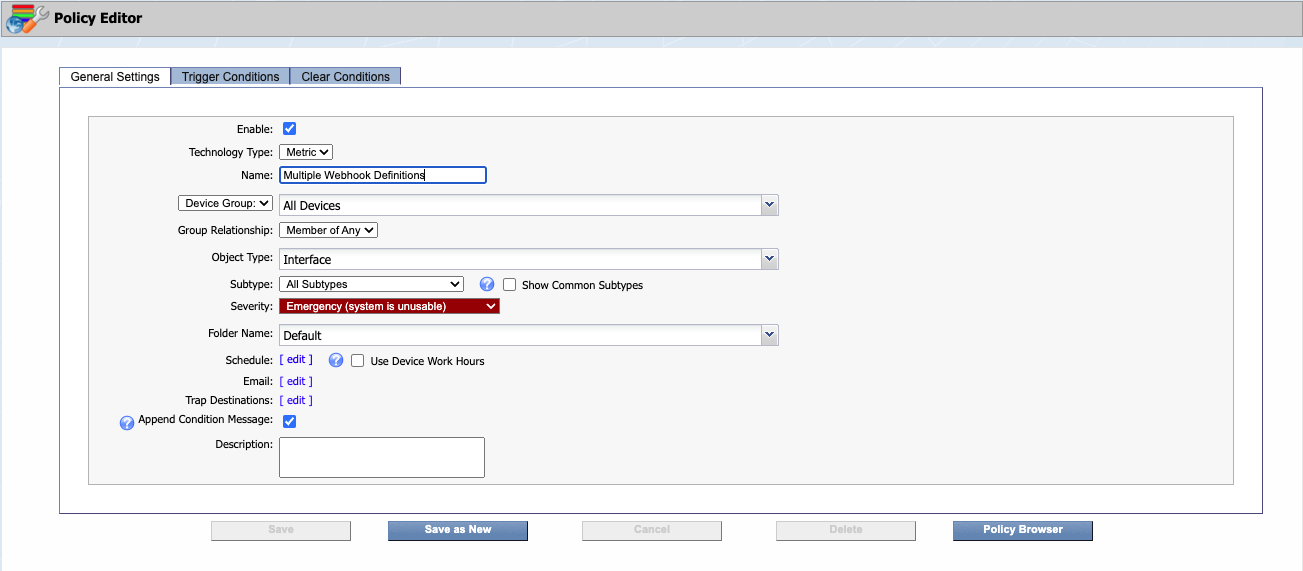
The General Settings tab enables you to define the basic policy settings.
-
Select the Enable check box to make the policy and all of its thresholds active. Disabled policies appear in light text on the Policy Browser.
-
Click the Technology Type drop-down and choose from technology types, Flow or Metric.
-
Flow - select technology type, Flow, to create a policy that triggers based on flow data.
for Technology Type, Flow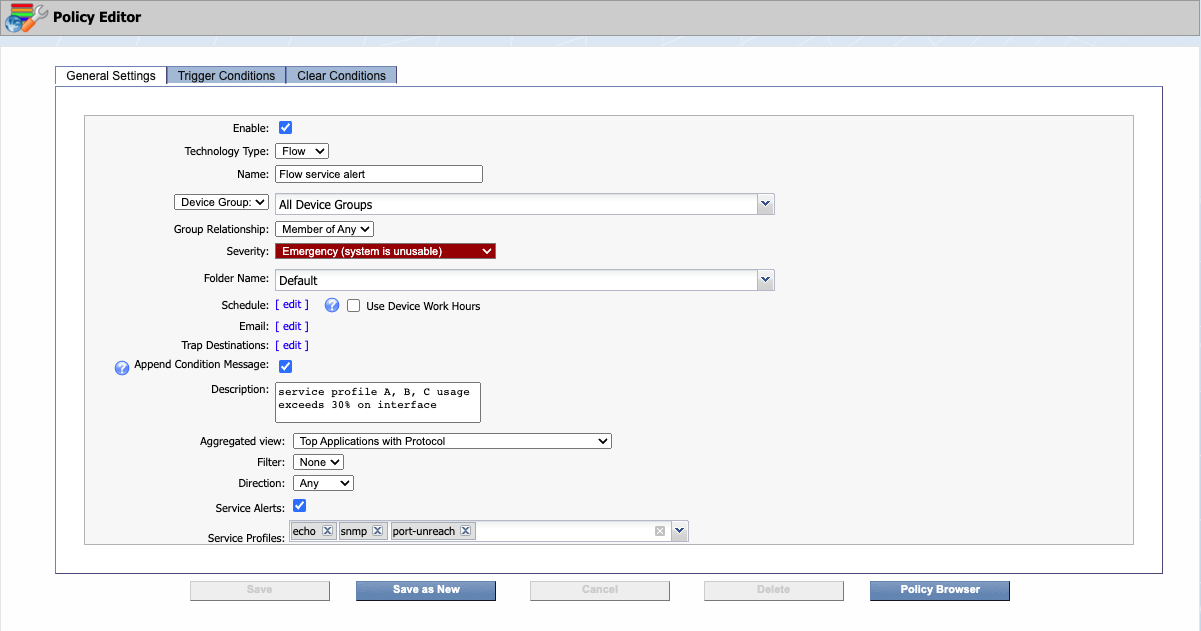
-
In the Name field, enter a unique name for the policy.
-
Click the drop-down and choose from one of the following options.
-
Select Device Group, then click the corresponding drop-down and select one or more device group/device type to trigger the policy.
-
Select Object Group, then click the corresponding drop-down and select one or more object group to trigger the policy.
-
-
Group Relationship field allows you to associate multiple device or object groups to a policy. Click the drop-down to choose one of the following options.
-
Member of Any - if the device or object is in any of the selected group(s) then the device or object will be used in the policy. It includes devices or objects as an OR operator. For example, devices or objects that are either in Group 1 OR in Group 2 OR in Group 3.
-
Member of All - if the device or object belongs to all the groups then the device or group will be used in the policy. It includes devices or objects as an AND operator. For example, devices or objects that are in Group 1 AND in Group 2 AND in Group 3.
-
-
Click the Severity drop-down and select the severity to display on the Alerts page when the policy triggers an alert.
-
Click the Folder Name drop-down and select a folder from the folder hierarchy. A policy cannot be added to All Policies or Selfmon Alerts folders as these folders are non-editable.
-
Click the Schedule [ edit ] link to display a pop-up that enables you define the times and/or dates for the policy to run. Please refer to section Schedule below.
-
When Use Device Work Hours check box is selected, thresholds outside of the selected/configured work hours will be ignored. Also, it will not create new alerts or increment the existing alerts outside of the work hour policy based on the device's local time.
-
If a NetFlow device is not mapped to a SevOne device for a threshold, the threshold will not be restricted to alert at any time.
-
If an error occurs in obtaining the device Work Hours, no time restrictions are put on the threshold by system. i.e., if the system is unable to apply the device Work Hours successfully, alerts are not suppressed. Alert(s) will be generated at any time.
-
At present, use of device Work Hours does not apply to alerts generated via traps and/or the API. It only applies to threshold-based alerts .
-
-
Click the Email [ edit ] link to display a pop-up that enables you to define email options. You can email the alerts that a policy generates to any valid email address. Please refer to section Email below.
-
Click the Trap Destinations [ edit ] link to display a pop-up that enables you to select where to send traps from the policy.
-
Select the System Default check box to associate all of the System Default Trap Destinations with this policy. To view the default Trap Destinations, go to Events > Configuration > Trap Destinations.
-
Select the Device Default check box to associate all Trap Destinations that have been assigned to the devices related to this policy. To assign trap destination associations to a device or device groups, go to Events > Configuration > Trap Destination Associations.
-
Select the Policy Specific check box above the list of trap destinations and then select the check box for each specific destination to which the policy is to send traps.
-
-
Select the Append Condition Message check box to append the custom messages defined for each condition in the trigger message from the Trigger Conditions tab and in the clear message from the Clear Conditions tab.
-
Define the Trigger Message for all trigger conditions on the Trigger Conditions tab. Please refer to section Tabs 'Trigger Conditions' & 'Clear Conditions' below.
-
Define the Clear Message for all clear conditions on the Clear Conditions tab. Please refer to section Tabs 'Trigger Conditions' & 'Clear Conditions' below.
-
Define a Custom Message for each individual trigger condition and for each individual clear condition when you define each individual condition. Please refer to section Create and Edit Conditions.
-
-
In the Description field, enter the description of the policy. This only appears when you define the policy.
-
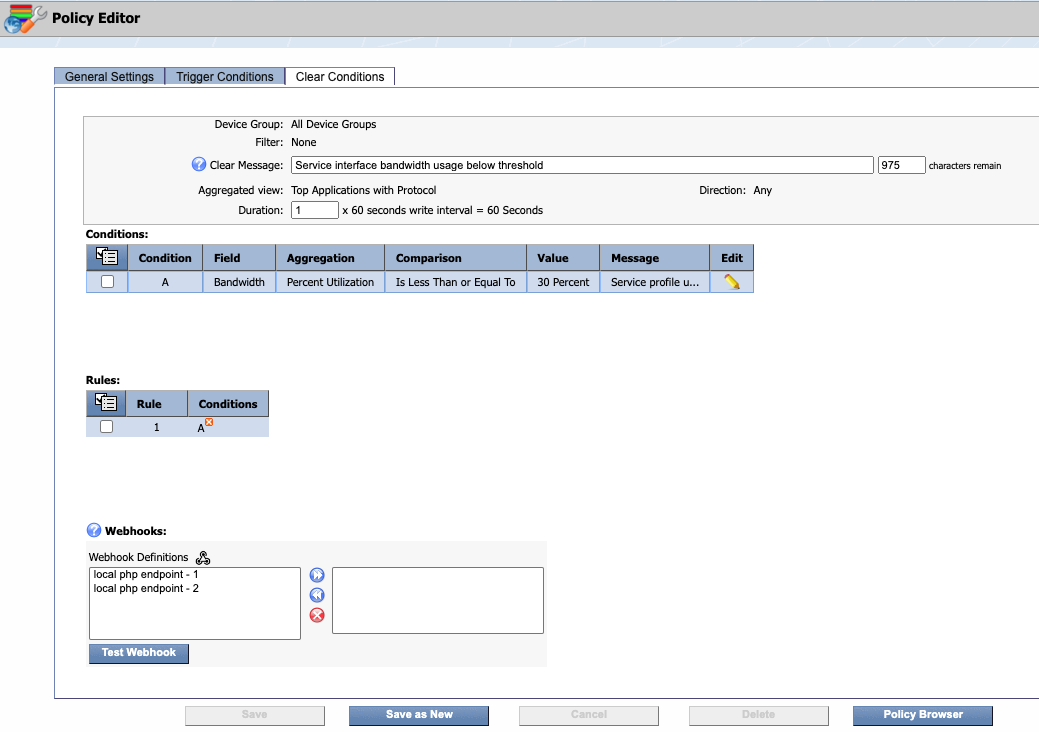
Click the Aggregated view drop-down and select the FlowFalcon view to use in FlowFalcon reports in which to display the data that triggered the threshold.
If Top Applications with Protocol is chosen for field Aggregated view, Service Alerts and Service Profiles fields become available.
Select Service Alerts check box to choose one or more Service Profiles from the drop-down list.
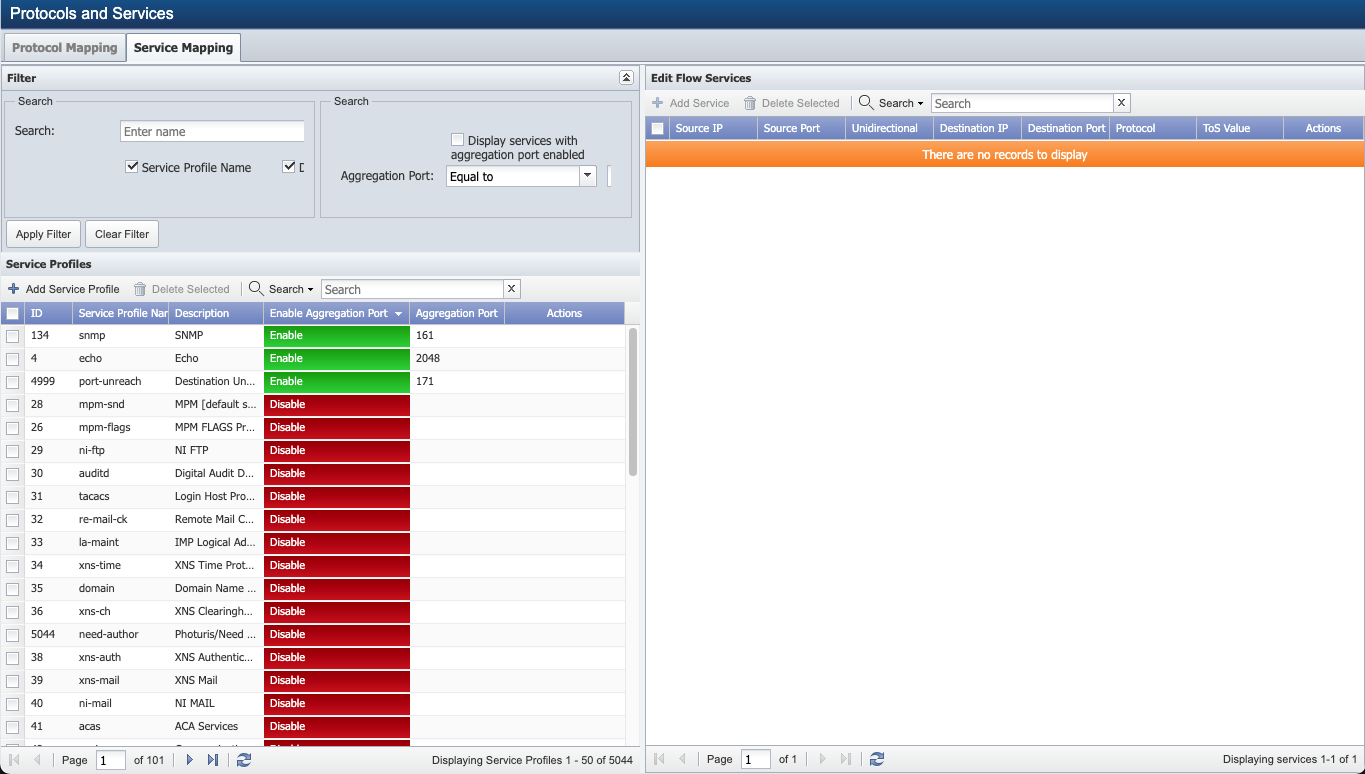
One policy can point to multiple service profiles. The service profiles can be found from Administration > Flow Configuration > Protocols and Services > tab Service Mapping.
 IMPORTANT
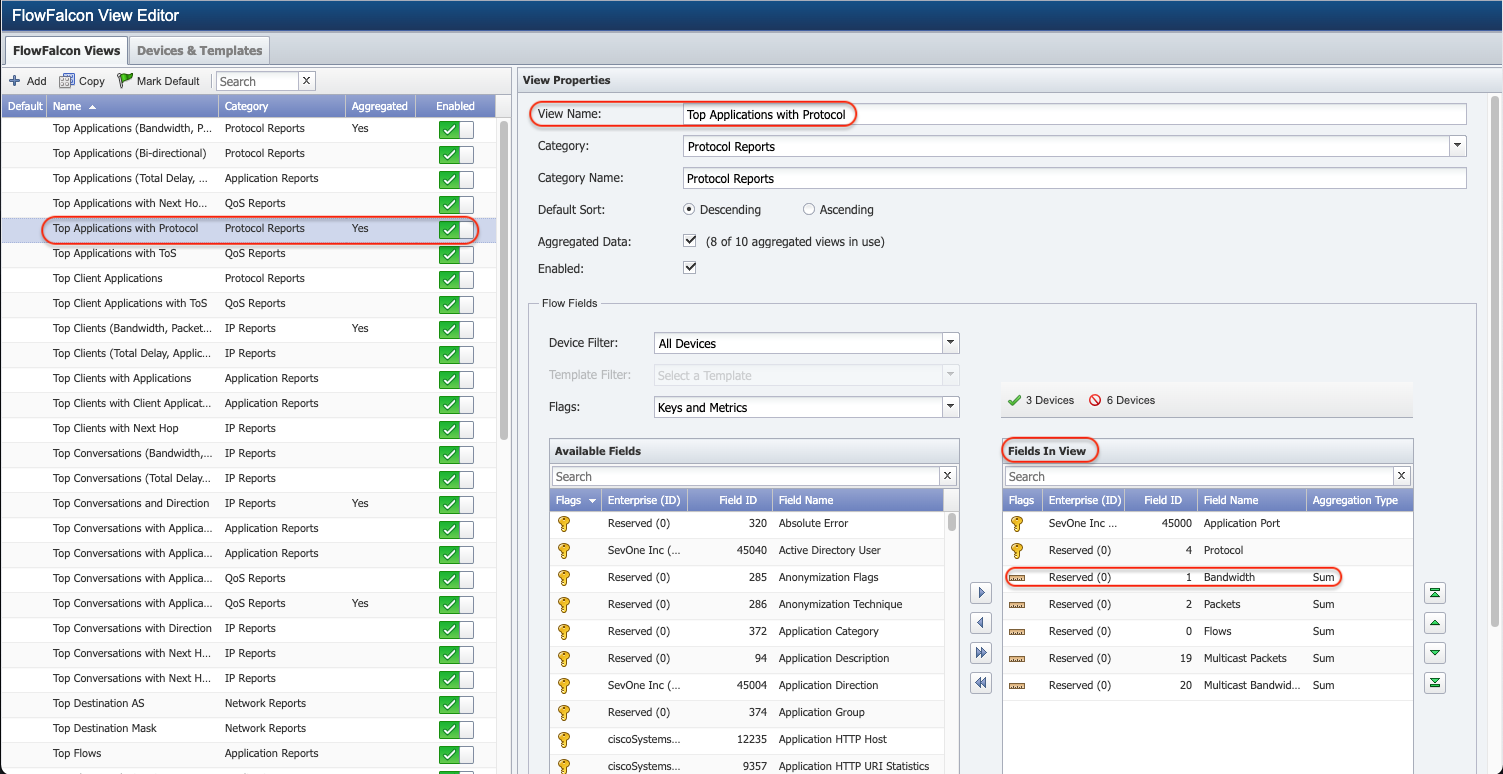
From Administration > Flow Configuration > FlowFalcon View Editor > tab FlowFalcon Views > select the row with Top Applications with Protocol in the Name column. In the right-panel, you will see:
-
field View Name contains Top Applications with Protocol. Do not change the view name as fields Service Alerts and Service Profiles will not be available when configuring the policy.
-
table Fields In View contains a row with Bandwidth in Field Name column. If Bandwidth is removed from Fields In View table for Top Applications with Protocol, fields Service Alerts and Service Profiles will not be available when configuring the policy.
-
-
Click the Filter drop-down and select the filter to use in the FlowFalcon report associated with the threshold.
-
Click the Direction drop-down and select the flow direction to trigger the threshold.
-
-
Metric - select technology type, Metric, to create a policy that triggers based on any data except flow data.
for Technology Type, Metric
-
In the Name field, enter a unique name for the policy.
-
Click the drop-down and choose from one of the following options.
-
Select Device Group, then click the corresponding drop-down and select one or more device group/device type to trigger the policy.
-
Select Object Group, then click the corresponding drop-down and select one or more object group to trigger the policy.
-
-
Group Relationship field allows you to associate multiple device or object groups to a policy. Click the drop-down to choose one of the following options.
-
Member of Any - if the device or object is in any of the selected group(s) then the device or object will be used in the policy. It includes devices or objects as an OR operator. For example, devices or objects that are either in Group 1 OR in Group 2 OR in Group 3.
-
Member of All - if the device or object belongs to all the groups then the device or group will be used in the policy. It includes devices or objects as an AND operator. For example, devices or objects that are in Group 1 AND in Group 2 AND in Group 3.
-
-
Click the Object Type drop-down and select an object type. You cannot edit the object type or object subtype after you save a policy.
-
Click the Subtype drop-down and select a subtype.
-
Select the Show Common Subtypes check box to display only the subtypes you mark as common on the Object Subtype Manager in the Subtype drop-down list in next step.
-
-
Click the Severity drop-down and select the severity to display on the Alerts page when the policy triggers an alert.
-
Click the Folder Name drop-down and select a folder from the folder hierarchy. A policy cannot be added to All Policies or Selfmon Alerts folders as these folders are non-editable.
-
Click the Schedule [ edit ] link to display a pop-up that enables you define the times and/or dates for the policy to run. Please refer to section Schedule below.
-
When Use Device Work Hours check box is selected, thresholds outside of the selected/configured work hours will be ignored. Also, it will not create new alerts or increment the existing alerts outside of the work hour policy based on the device's local time.
-
If an error occurs in obtaining the device Work Hours, no time restrictions are put on the threshold by system. i.e., if the system is unable to apply the device Work Hours successfully, alerts are not suppressed. Alert(s) will be generated at any time.
-
At present, use of device Work Hours does not apply to alerts generated via traps and/or the API. It only applies to threshold-based alerts .
-
-
Click the Email [ edit ] link to display a pop-up that enables you to define email options. You can email the alerts that a policy generates to any valid email address. Please refer to section Email below.
-
Click the Trap Destinations [ edit ] link to display a pop-up that enables you to select where to send traps from the policy.
-
Select the Append Condition Message check box to append the custom messages defined for each condition in the trigger message from the Trigger Conditions tab and in the clear message from the Clear Conditions tab.
-
Define the Trigger Message for all trigger conditions on the Trigger Conditions tab. Please refer to section Tabs 'Trigger Conditions' & 'Clear Conditions' below.
-
Define the Clear Message for all clear conditions on the Clear Conditions tab. Please refer to section Tabs 'Trigger Conditions' & 'Clear Conditions' below.
-
Define a Custom Message for each individual trigger condition and for each individual clear condition when you define each individual condition. Please refer to section Create and Edit Conditions.
-
-
In the Description field, enter the description of the policy. This only appears when you define the policy.
-
-
Schedule
The alert engine runs every three minutes to retest all policies. The Schedule pop-up enables you to define specific time spans for when you want to enable or disable the alert engine to test the policy. If you do not define a schedule, the alert engine tests the policy every three minutes until you disable the policy.
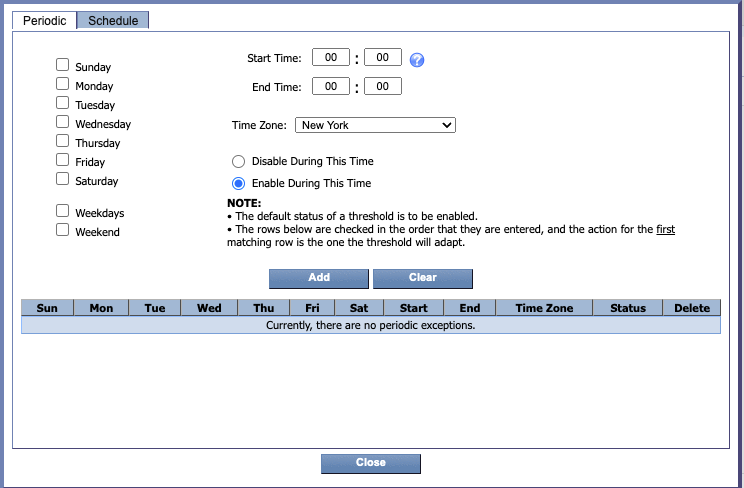
Tab 'Periodic'
The Periodic tab enables you to define a regularly occurring time span to either enable or disable the policy.
-
Select one of the following options.
-
Select Disable During This Time to disable the policy for the days and/or times you define on the Periodic tab.
-
Select Enable During This Time to enable the policy for the days and/or times you define on the Periodic tab.
-
-
Select the check box next to each day for the policy to be enabled/disabled (dependent on the option you select in the previous step).
-
In the Start Time fields, enter the start time.
-
In the End Time fields, enter the end time.
-
Click the Time Zone drop-down and select a time zone.
-
Click Add to add the periodic schedule to the list of schedules.
-
Repeat the steps on the Periodic tab to add additional schedules to the list. Schedules are checked in the sequence in which they appear in the list and the first applicable schedule is applied to the policy. If no schedule is applicable, the policy is enabled by default.
-
Click Close to save the periodic settings.
Tab 'Schedule'
The Schedule tab enables you to schedule a specific time span to either enable or disable the policy.
-
Select one of the following options.
-
Select Disable During This Time to disable the policy for the time span you define on the Schedule tab.
-
Select Enable During This Time to enable the policy for the time span you define on the Schedule tab.
-
-
Click in the Start Date field to display a calendar. Use the calendar to select the date to start the time span to enable/disable the policy (dependent on the option you select in the previous step).
-
Enter the start time.
-
Click in the End Date field to display a calendar. Use the calendar to select the date to end the time span to enable/disable the policy.
-
Enter the end time.
-
Click the Time Zone drop-down and select a time zone.
-
Click Add to add the schedule to the list of schedules.
-
Repeat the steps on the Schedule tab to add additional schedules to the list. Schedules are checked in the sequence in which they appear in the list and the first applicable schedule is applied to the policy. If no schedule is applicable, the policy is enabled by default.
-
Click Close to save the schedule settings.
The Email pop-up enables you to define who should receive emails when the policy triggers an alert. You can email policy alerts to valid email addresses and to the users and user roles you define in SevOne NMS. There is no limit to the number of email recipients.
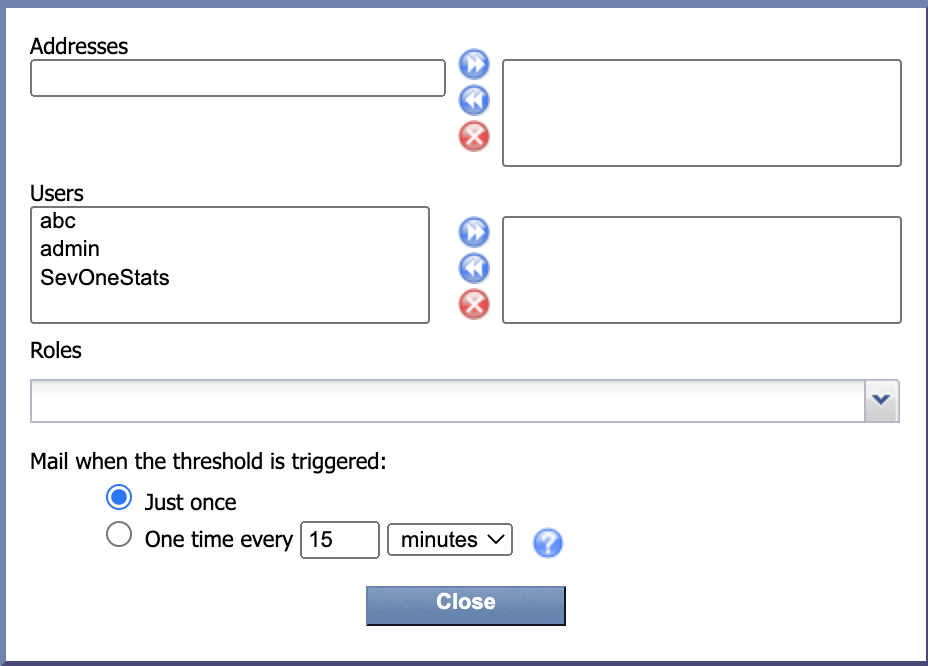
Addresses
-
In the left Addresses field, enter the email address for a recipient.
-
Move the address to the right Addresses field.
-
Repeat the previous steps to add additional email addresses. Email addresses that appear in the right field receive an email when the policy triggers an alert.
Users
-
In the left Users field, select the user to receive alert emails (use the Ctrl or Shift keys to multi-select).
-
Move the users you select to the right Users field. Users that appear in the right Users field receive an email when the policy triggers an alert.
Roles
Click the Roles drop-down and select the check box for each user role whose members are to receive an email when the policy triggers an alert.
Mail when the threshold is triggered
Select one of the following options.
-
Select Just Once to only send one email when the policy triggers the first occurrence of an alert. All subsequent occurrences (until the alert is cleared) are not emailed. This prevents an email from being sent every three minutes when a device is down.
-
Select One Time Every, enter a number in the text field, then click the drop-down and select minutes, hours, or days to send multiple emails when the policy triggers alerts.
Click Close to save the email settings.
Tabs 'Trigger Conditions' & 'Clear Conditions'
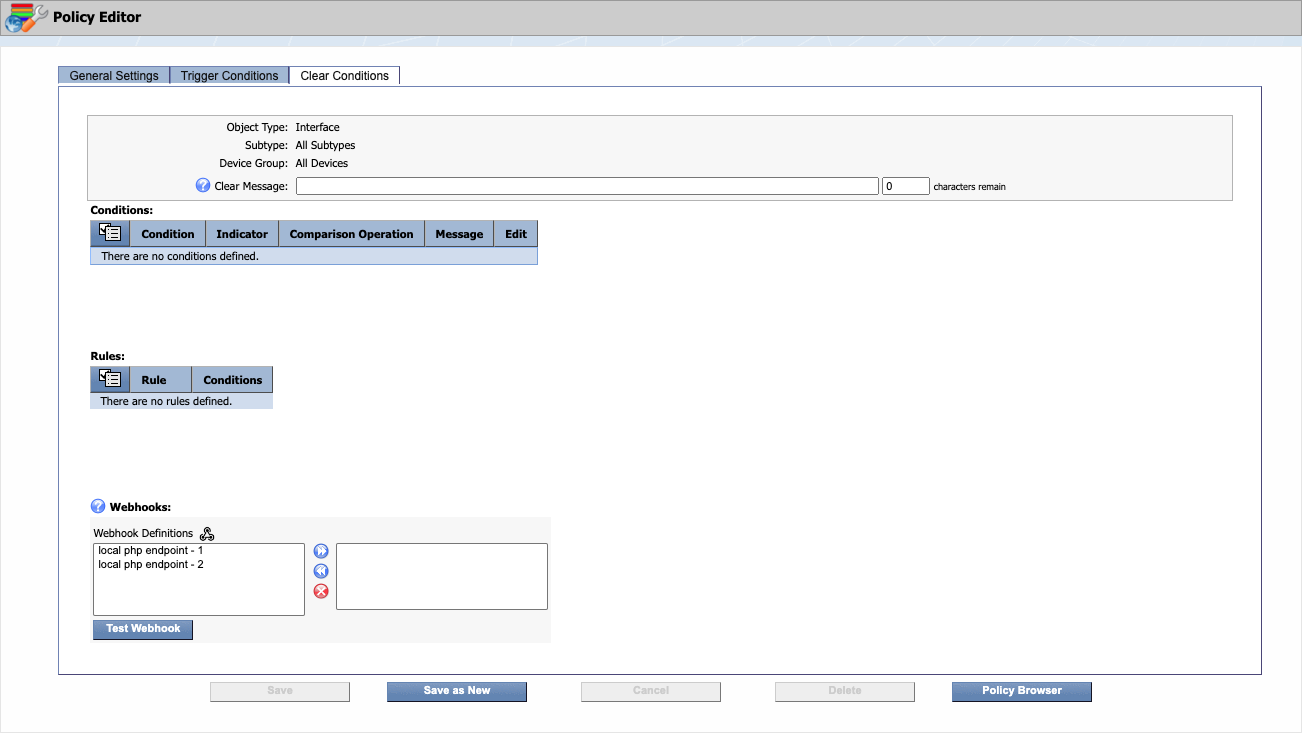
The Trigger / Clear Conditions tabs enable you to define the conditions to trigger / clear the policy and to define the trigger / clear messages respectively.
Should you choose to define a trigger condition, and then you choose to define a clear condition that is contradictory, the trigger condition takes precedence.
-
You define a trigger condition to trigger an alert when something is greater than 10.
-
You define a clear condition to clear the alert when the same thing is greater than 20.
If the thing is 25, the alert will trigger and the alert will not be cleared.
Fields Object Group or Device Group and Filter selected in the General Settings tab are displayed in the Object Group or Device Group and Filter fields in Trigger Conditions / Clear Conditions tab.
In the Trigger Message / Clear Message field, enter the message to display when this policy is triggered. Select the Append Condition Message check box on the General Settings tab to append the condition-specific Custom Message to this trigger condition message.
Custom Message Variables apply to Metric policies only. These variables are not available for Flow policies.
In the Duration field, enter the length of time for the condition to exist before the trigger condition triggers the policy. The value you enter here is multiplied by the length of time you enter as the Write Interval on the Cluster Manager > Cluster Settings tab > FlowFalcon subtab.
The Write Interval displays next to this field. The default write interval is 60 seconds. If you want the trigger condition to exist for five minutes before the policy is triggered, enter 5 in the duration field. If the write interval has been changed, you will need to do some math here.
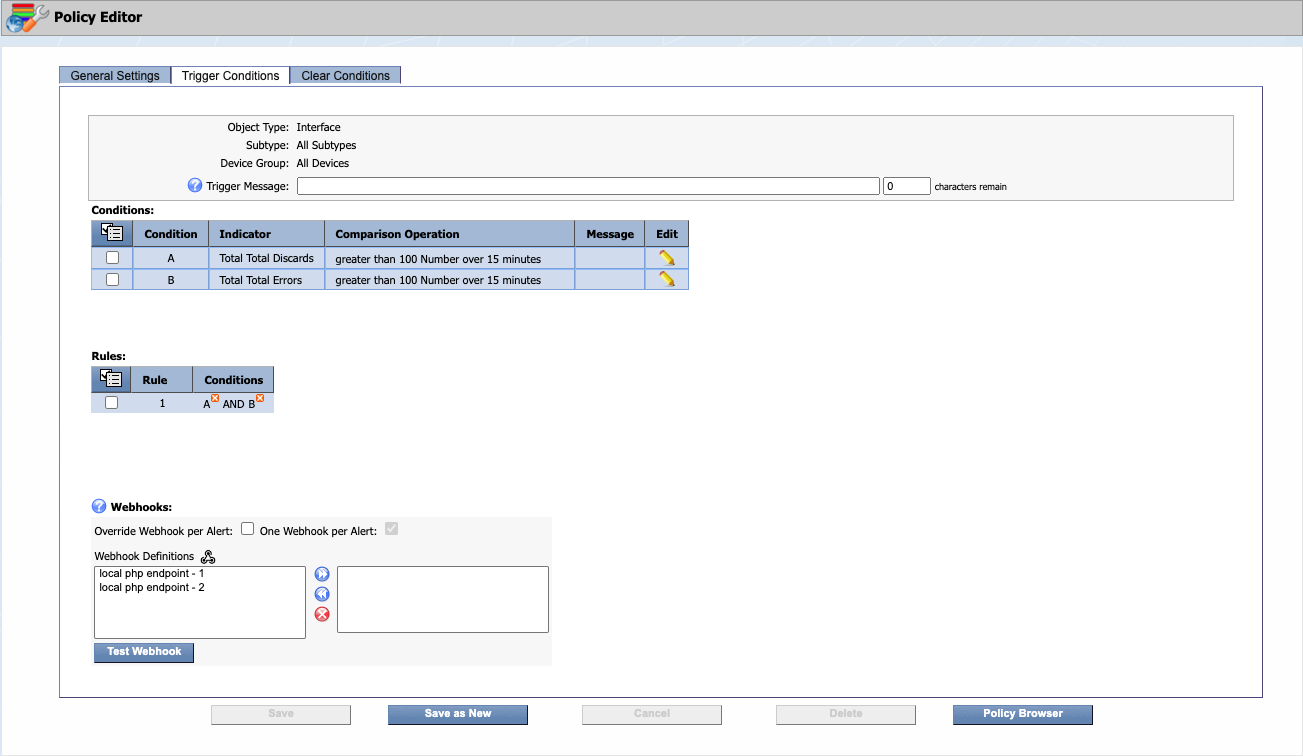
Fields Object Type, Subtype, and Device Group selected in the General Settings tab are displayed in the Object Type, Subtype, and Device Group fields in Trigger Conditions / Clear Conditions tab.
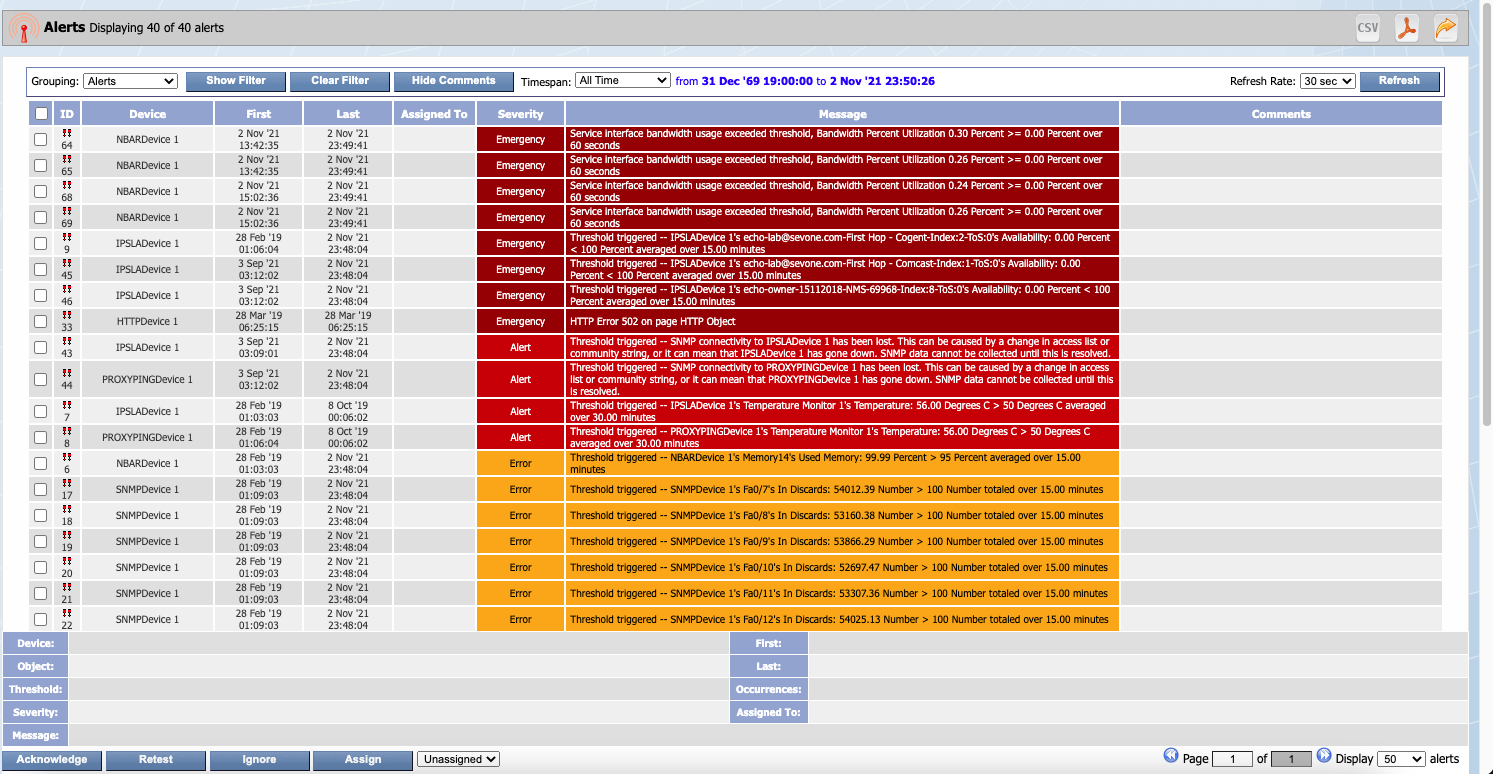
In the Trigger Message / Clear Message field, enter the message to display for the policy on the Alerts page. On the Alerts page, the trigger message appears as Threshold triggered - <trigger message you enter here>. The custom message for each trigger condition appends to this trigger message when you select the Append Condition Message check box on the General Settings tab and you enter a custom message for each trigger condition. Please refer to section Create and Edit Conditions. Trigger messages support a variety of variables that allow you to customize the alerts to be as detailed as possible. The following variables (listed in alphabetical order) are supported for Trigger Messages / Clear Messages.
-
$alertState displays the severity of the policy. For example, Emergency or Debug.
-
$alertType displays the technology type of the policy.
-
$clusterName displays SevOne NMS cluster name of the triggered alert.
-
$deviceAltName displays the alternate name of the device that triggered / cleared the policy.
-
$deviceId displays the ID of the device associated with this condition.
-
$deviceIp displays the IP address of the device associated with this condition.
-
$deviceName displays the name of the device that triggered / cleared the policy.
-
$groupName displays the device group or device type that contains the device that triggered the policy.
-
$policyId displays the ID of the policy.
-
$policyName displays the name of the policy triggered.
-
$thresholdId displays the ID of the threshold.
-
$thresholdName displays the name of the threshold.
-
$DIDataResources displays the part of SevOne Data Insight report URL for violating resources of the alert. Start the Data Insight report URL with the Data Insight host and report name in URL-encoded format, and append variable $DIDataResources at the end. The URL created, supports Webhooks and emails sent for Alerts.
Variable $DIDataResources can be used in trigger messages, clear messages, and webhook messages for metric policies.
To utilize variable $DIDataResources as expected, you must have flag FF_UI_REDIRECT set to true in SevOne Data Insight's /opt/SevOne/chartconfs/di_custom.yaml file.
CAUTIONAt present, FF_UI_REDIRECT is an early-access feature flag and is available for limited-use only. Please contact SevOne Support or your Technical Account Manager before you use this flag.
If /opt/SevOne/chartconfs/di_custom.yaml file does not exist, create it.
$sshsevone@<SevOne Data Insight IP address orhostname>Create /opt/SevOne/chartconfs/di_custom.yaml file$touch/opt/SevOne/chartconfs/di_custom.yamlUsing a text editor of your choice, edit /opt/SevOne/chartconfs/di_custom.yaml file to set the following environment variable and then, save it.
ui:env:FM_UI_REDIRECT:trueApply the changes made to /opt/SevOne/chartconfs/di_custom.yaml file.
$ sevone-cli playbook up --tags appsExample: Generic URLhttp://<SevOne Data Insight IP address or hostname>/redirect/v1/reports?<enter parameter>&$DIDataResources
Example# 1: Create URLLet's assume the following.
-
SevOne Data Insight IP address or hostname = localhost
-
reportName = Alert Details Report
Your URL will be,
http://localhost/redirect/v1/reports?reportName=Alert%Details%Report&$DIDataResources
Example# 2: Create URLLet's assume the following.
-
SevOne Data Insight IP address or hostname = 10.128.10.24
-
reportName = Alert Summary Report
Your URL will be,
http://10.128.10.24/redirect/v1/reports?reportName=Alert%Summary%Report&$DIDataResources
-
The following fields / sections apply to both technology types, Flow or Metric.
Conditions
-
Click
 in the Conditions section to manage the trigger / clear conditions.
 -
Select Create New to add a new condition to the policy. Please refer to section Create and Edit Conditions.
-
Select the check box for each condition to delete, then select Delete Selected to delete then click to delete the conditions you select.
-
Select the check box for each condition to add to a rule, then select Add to Rule <n> to add the conditions to a specific rule.
-
-
Click
 in the Edit column to display the Edit Conditions pop-up. Please refer to section Create and Edit Conditions.
Rules
-
Click
in the Rules section to manage the trigger / clear condition rules. -
Select Create New to add a new rule to the condition. Rule numbers are sequential. Each condition for a rule is treated as an AND Boolean operator. Add a new rule to create an OR Boolean operator. See the Boolean Operators section below.
-
Select the check box for each rule to delete, then select Delete Selected to delete the rules you select.
-
-
Click
 in the Conditions column to remove a condition from a rule.
 If you add a condition when no rule exists, the condition is assigned to Rule 1 using the AND Boolean operator.
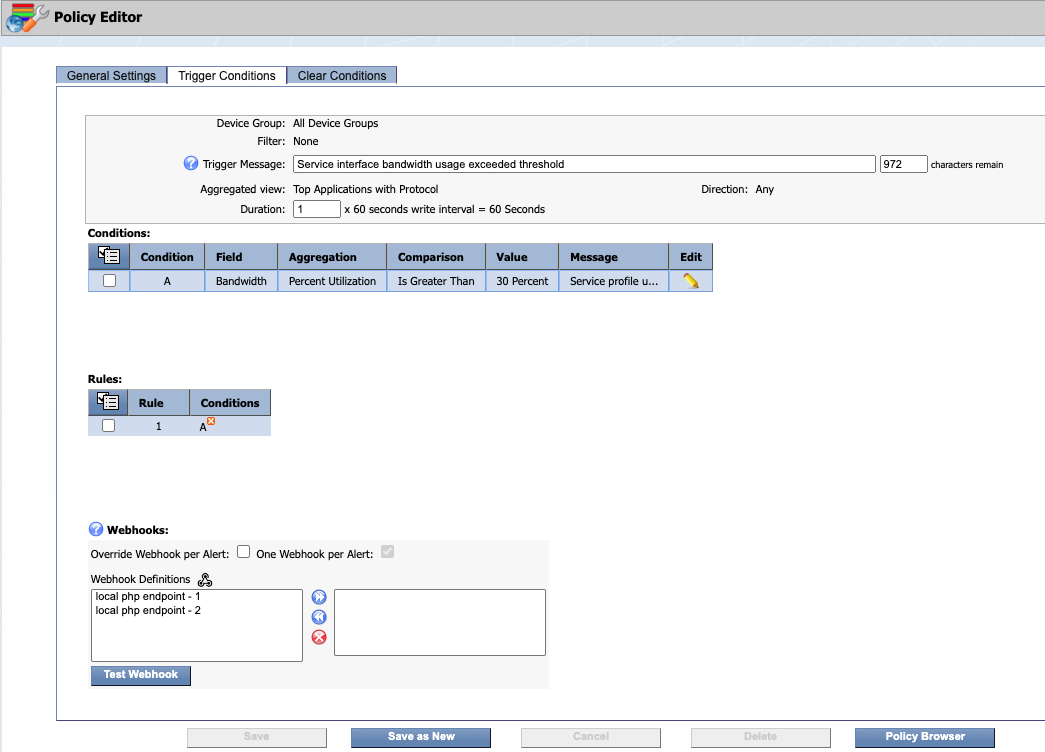
Webhooks
For Webhooks, an HTTP request can be invoked to webhook definition when an alert is triggered.
At present, Webhooks can only be configured on Policies. When adding Thresholds, although Webhooks are visible, they are disabled and cannot be configured.
Select the Override Webhook per Alert check box to override the setting set in Administration > Cluster Manager > Cluster Settings tab > Alerts subtab > field One Webhook per Alert. When enabled, it allows you to set the One Webhook per Alert check box. If One Webhook per Alert is enabled, it sends only one webhook per alert for the policy selected.
To create a webhook definition(s) for the policy, click  to create. Please refer to Webhook Definition Manager for details on how to create, edit, and delete webhook definitions.
If you have existing webhook definition(s), the list is available from the left box under field Webhook Definitions. To apply one or more of the webhook definitions in the list to the policy you are on, select webhook definitions(s) from the list in the left box and click  to move them to the right box. Only the webhook definition(s) in the right box are applied to the policy you are on. You can add multiple webhook definitions per policy.
If you want to remove webhook definition(s) applied to the policy i.e., webhook definition(s) in the right box, select the webhook definition(s) from the right box under field Webhook Definitions and click  to remove them. These will now be moved back to the left box.
Click  to move all webhook definition(s) from the right box to the left box.
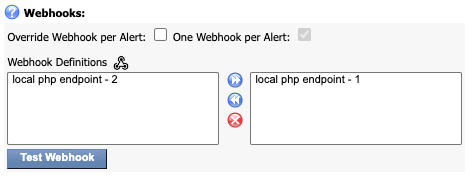
In this example, webhook definitions available are local php endpoint - 1 and local php endpoint - 2. Webhook definition chosen for this policy is local php endpoint - 1. If the policy generates an alert, the chosen webhook definition, local php endpoint - 1, will be notified.
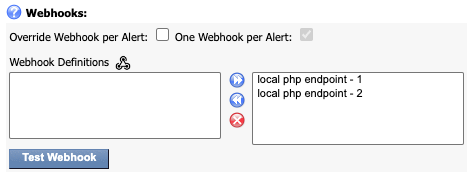
In this example, webhook definitions available are local php endpoint - 1 and local php endpoint - 2. Both webhook definitions are chosen for this policy. If the policy generates an alert, both local php endpoint - 1 and local php endpoint - 2 will be notified.
Test Webhook button provides the testing ability for the webhook definition(s) applied to the policy. It populates the result for the user, including the status code, response header, and body in the pop-up. The notifications can be sent to SevOne NMS application itself.
Create and Edit Conditions
The edit condition pop-up enables you to define the condition to either trigger the policy or to clear the policy. Conditions determine when to trigger / clear an alert.
A right Riemann sum of the Gauge form of the data is used when you select option Total from the Aggregation drop-down.
Technology Type - Flow Conditions
For Technology Type Flow policies, perform the following steps to create a trigger condition or a clear condition.
-
Click the Fields drop-down and select a field.
-
Click the Aggregation drop-down and select a data aggregation option.
-
Click the Comparison drop-down and select a comparison operator.
-
In the Value field, enter the value to trigger / clear the condition. If applicable, click the corresponding drop-down and select the unit of measure.
From General Settings tab, if Aggregated view chosen is Top Applications with Protocol and Service Alerts is enabled, Fields will be set to Bandwidth, by default. And, field Aggregation will be set to Percent Utilization.
Value field will change to % (percent). This is the percentage of interface speed. To get interface speed, NetFlow interface table is used.
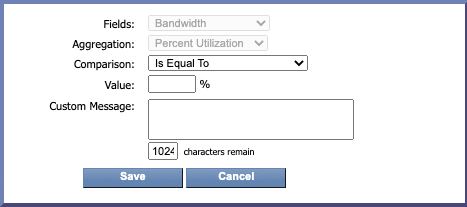
An alert will trigger if the bandwidth utilization of NetFlow service profiles exceeds the percentage of utilization. You can see the alert(s) generated from Events > Alerts.
-
In the Custom Message field, enter a custom message that is specific to the condition. The custom message appends to the trigger message or to the clear message when you select the Append Condition Message check box on the General Settings tab.
IMPORTANTCustom Message Variables apply to Metric policies only. These variables are not available for Flow policies.
-
Click Save to save the condition.
Technology Type - Metric Conditions
For Technology Type Metric policies, there are four types of conditions.
-
Static condition compares the current value of an indicator with the value you define.
-
Baseline condition compares the current value of an indicator with the indicator's baseline value. There are three types of baseline conditions.
-
Slope condition calculates the most recent six data points (minimum of four valid points) and compares that value to the threshold you define for the condition. Slope conditions look for variation of a value from the values that came before to measure the relative consistency. This detects a significant change in behavior over a short time.
-
Time since newest data point condition alerts on the number of seconds since the most recent data point for a given object.
Static Condition
Static conditions compare the current value of an indicator with the value you define.
-
Inbound traffic is greater than 50Mb/s
-
Idle CPU time is less than 10%
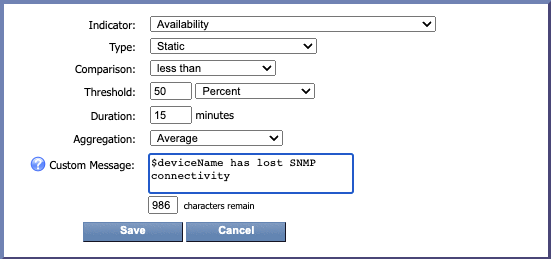
Perform the following steps to define a Static condition.
-
Click the Indicator drop-down and select the indicator on which to base the condition.
-
Click the Type drop-down and select Static to compare the actual current indicator value to the policy indicator value you define.
-
Click the Comparison drop-down and select a comparison operator. Most comparison operators are self explanatory.
Select Bad Polls to trigger or clear an alert when a poll attempt either receives nothing or receives invalid data. This creates a time stamp entry and an entry in the data column that represents an unsuccessful poll. This drives the SNMP Availability metric of how many unsuccessful poll attempts were made in a given cycle versus how many poll attempts were successful. -
In the Threshold field, enter the value at which to trigger / clear the condition then click the Threshold drop-down and select the value unit of measure.
-
The Duration field has two scenarios, a smoothing time duration or a detection time duration.
-
If you select Greater Than, Less Than, Equal To, Greater Than Equal To, Less Than Equal To, or Not Equal To in the Comparison field, enter the number of minutes for which the condition is to be met before the condition triggers / clears.
-
If you select Bad Polls, Changed, Changed From, or Changed To in the Comparison field, enter the number of minutes in which the condition must occur at least once before the condition triggers/clears. The Duration for these Comparisons must be equal to or greater than the poll frequency of the device or an alert does not trigger.
-
-
Click the Aggregation drop-down and select a data aggregation method. When Count Over Threshold option is chosen from the drop-down, Count field becomes available. Specify the count number in the Count field. When Time Over Threshold option is chosen from the drop-down, Time field becomes available. Specify the time in minutes in the Time field.
The configured time in Time Over Threshold should not be longer than the value set in field Duration.
-
In the Custom Message field, enter a custom message that is specific to the condition. The custom message appends to the trigger message or to the clear message when you select the Append Condition Message check box on the General Settings tab. You can enter variables to display such things as device name, IP address etc. Please see the Custom Message Variables list below.
IMPORTANTCustom Message Variables apply to Metric policies only. These variables are not available for Flow policies.
-
Click Save to save the condition.
Baseline Condition
Baseline conditions compare the current value of an indicator with the indicator's baseline value. There are three types of baseline conditions.
-
Baseline Delta
Examples-
Inbound traffic is greater than 10Mb/s, relative to the baseline
-
Idle CPU time is less than 5% of the total, relative to the baseline
-
-
Baseline Percentage
Examples-
Inbound traffic is greater than 150% of the baseline
-
Idle CPU time is less than 60% of the baseline
-
-
Baseline Standard Deviation
Examples-
Inbound traffic is above/below three standard deviations of the baseline
-
Idle CPU time is below two standard deviations of the baseline
-
If the baseline value is 100 and the standard deviation is 50, this does not model the expected actual value, since this appears to shift above and below the baseline value by a significant amount.
-
If the baseline value is 100 and the standard deviation is 10, this is a better representation of the normal value.
-
-
Baseline Delta uses a percentage comparison unit to the baseline +/- a percentage of the maximum indicator value. Baseline Delta is most useful when the scale of the baseline and the scale of the indicator are very different. Example: A critical interface that has typically low utilization but has irregular spikes that are no more than 10% of the total link capacity. If you do not knowing the value of the baseline itself, it is difficult to use the Baseline Percentage condition type.
-
Baseline Percentages compare the value to a percentage of the baseline.
Perform the following steps to define a Baseline condition.
-
Click the Indicator drop-down and select the indicator on which to base the condition.
-
Click the Type drop-down.
-
Select Baseline Delta to compare the actual current indicator value to the indicator's baseline value.
-
In the Threshold field, enter the value at which to trigger / clear the condition then click the Threshold drop-down and select the value unit of measure. Percentage refers to a percentage of the maximum value of the indicator and is not to be interpreted as a percentage of the baseline value.
-
Click the Comparison drop-down and select a comparison operator.
-
-
Select Baseline Percentage to compare the ratio of the current indicator value to the indicator's baseline value.
-
Click the Comparison drop-down and select a comparison operator.
-
In the Threshold field, enter the percentage value at which to trigger / clear the condition.
-
-
Select Baseline Standard Deviation to compare the current indicator value to the indicator's expected regional value using standard deviations which is a measure that approximates the uncertainty of the value. Most data can be expected to be within six standard deviations of the baseline. A typical condition will test whether the data is above and/or below two or three standard deviations from the baseline value.
-
Click the Standard Deviations drop-down and select the number of deviations. A smaller standard deviation means a tighter bracket on what is normal. The size of the standard deviation should represent the behavior of the data.
-
Click the Direction drop-down and select Above, Below, or Above or below the baseline. The most common use case is for Above or below to have the condition test for deviations in both directions.
-
-
-
The Duration field has two scenarios, a smoothing time duration or a detection time duration.
-
If you select Greater Than, Less Than, Equal To, Greater Than Equal To, Less Than Equal To, or Not Equal To in the Comparison field, enter the number of minutes for which the condition is to be met before the condition triggers/clears.
-
If you select Bad Polls, Changed, Changed From, or Changed To in the Comparison field, enter the number of minutes in which the condition must occur at least once before the condition triggers/clears. The Duration for these Comparisons must be equal to or greater than the poll frequency of the device or an alert does not trigger.
-
-
Click the Aggregation drop-down and select a data aggregation method.
-
In the Custom Message field, enter a custom message that is specific to the condition. The custom message appends to the trigger message or to the clear message when you select the Append Condition Message check box on the General Settings tab. You can enter variables to display such things as device name, IP address etc. Please see the Custom Message Variables list below.
IMPORTANTCustom Message Variables apply to Metric policies only. These variables are not available for Flow policies.
-
Click Save to save the condition.
Slope Condition
Slope conditions use a data window of six most recent data points (minimum of four valid points) to perform the deviation from average (DFA) calculation or the relative standard deviation (RSD) calculation. The result of the calculation is compared to the threshold you define in the condition to trigger or clear the policy. Slope conditions looks for variation of a value from the values that came before to measure the relative consistency. This detects a significant change in behavior over a short time. A data window consists of at least four successful poll points and at most six successful poll point. As each new data point is received, the oldest data point is dropped and the new data point is validated. Whenever there are between four and six valid data points, the calculation is performed for the condition.
There are two types of slope conditions
-
Slope Variance DFA - Algorithm = std::abs( (P-avg)/avg )
-
P = The value of the point.
-
avg = The average of the points within data window.
-
The return value is an absolute value that represents both increasing slope and decreasing slope at the same time.
-
-
Slope Variance RSD - Algorithm = (100*stdDev)/avg
-
stdDev = The standard deviation from data window.
-
avg = The average of the data window.
-
Perform the following steps to define a Slope condition.
-
Click the Indicator drop-down and select the indicator on which to base the condition.
-
Click the Type drop-down.
-
Select Slope Variance DFA to compare the current indicator value to the indicator’s deviation from average value you define. This function calculates the degree to which the current value is different from the expected value and so the default threshold values are provided. This technique is also most effective when combined with other conditions.
-
Select Slope Variance RSD to compare the current indicator value to the indicator’s relative standard deviation value you define.
-
-
Click the Comparison drop-down and select a comparison operator.
-
In the Threshold field, enter the numeric value at which to trigger / clear the condition.
-
Duration is irrelevant for the Slope Variance DFA and Slope Variance RSD condition types. It is only relevant for determining how many data points can be used.
The duration specified by the user determines how many data points can be used in the calculation. You can have 4 - 6 data points only.
Calculate number of data points usedNumber of Data Points = Duration / Polling FrequencyExample# 1: if duration = 60 minutes & polling frequency = 15 minutes,Number of Data Points = 60 minutes / 15 minutesNumber of Data Points = 4 data pointsThe number of data points calculated in Example# 1 = 4 data points. So, all 4 data points are used for this scenario.
Example# 2: if duration = 60 minutes & polling frequency = 5 minutes,Number of Data Points = 60 minutes / 5 minutesNumber of Data Points = 12 data pointsThe number of data points calculated for Example# 2 = 12 data points. But, since you can have 4 - 6 data points only, 6 most recent data points are used for this scenario.
-
In the Custom Message field, enter a custom message that is specific to the condition. The custom message appends to the trigger message or to the clear message when you select the Append Condition Message check box on the General Settings tab. You can enter variables to display such things as device name, IP address etc. Please see the Custom Message Variables list below.
IMPORTANTCustom Message Variables apply to Metric policies only. These variables are not available for Flow policies.
-
Click Save to save the condition.
Time since newest data point Condition
Time since newest data point condition allows the system to detect when the number of seconds since the newest data point exceeds the configured threshold. It also detects when data from any source is not being collected for the configured object or if there is a problem in the pipeline which results in the system to be unable to collect the data from it.
Perform the following steps to define the condition.
-
Click the Indicator drop-down and select the indicator on which to base the condition.
-
Click the Type drop-down and choose Time since newest data point.
-
In the Threshold field, enter the number of seconds since the most recent data point on a given object.
-
In the Custom Message field, enter a custom message that is specific to the condition. The custom message appends to the trigger message or to the clear message when you select the Append Condition Message check box on the General Settings tab. You can enter variables to display such things as device name, IP address etc. Please see the Custom Message Variables list below.
IMPORTANTCustom Message Variables apply to Metric policies only. These variables are not available for Flow policies.
-
Click Save to save the condition.
Custom Message Variables
You can use the following variables (listed in alphabetical order) when you enter a custom message for a trigger condition or a clear condition.
The custom message variables below apply to Metric policies only. These variables are not available for Flow policies.
-
$aggregationDuration displays the duration of the aggregation being used in this condition.
-
$aggregationOperation displays the aggregation being used in this condition.
-
$alertState displays the severity of the policy. For example, Emergency or Debug.
-
$alertType displays the technology type of the policy.
-
$baselineValue displays the baseline value for this hour.
-
$clusterName displays SevOne NMS cluster name of the triggered alert.
-
$comparisonOperation displays the comparison operation being performed in this condition.
-
$comparisonUnits displays the units of measurement being used in this condition.
-
$comparisonValue displays the value being used for comparison in this condition.
-
$dataUnits displays the unit of measurement that is recorded for the indicator in this condition.
-
$dataValue displays the value observed or measured in this condition.
-
$deviceAltName displays the alternate name of the triggered device.
-
$deviceId displays the ID of the device associated with this condition.
-
$deviceIp displays the IP address of the device associated with this condition.
-
$deviceName displays the name of the device associated with this condition.
-
$groupName displays the device group or device type that contains the device that triggered the policy.
-
$indicatorDescription displays the indicator description associated with this condition.
-
$indicatorName displays the indicator name associated with this condition.
-
$objectAltName displays the alternate name of the triggered object.
-
$objectDescription displays the description of the object associated with this condition.
-
$objectId displays the ID of the object associated with this condition.
-
$objectName displays the object name associated with this condition.
-
$pluginDescription displays the description of the plugin. For example, SNMP Poller.
-
$pluginName displays the short name for the plugin. For example, SNMP.
-
$policyId displays the ID of the policy.
-
$policyName displays the name of the policy.
-
$sigmaDirection displays the standard deviation direction used in this condition.
-
$sigmaValue displays the standard deviation value for this hour.
-
$thresholdId displays the ID of the threshold.
-
$thresholdName displays the name of the threshold.
-
$thresholdValue displays the reference value over which the condition triggers.
Boolean Operators
Boolean AND Operator
The Action icons enable you to create new conditions, create new rules, and to manage the conditions to rules assignments.
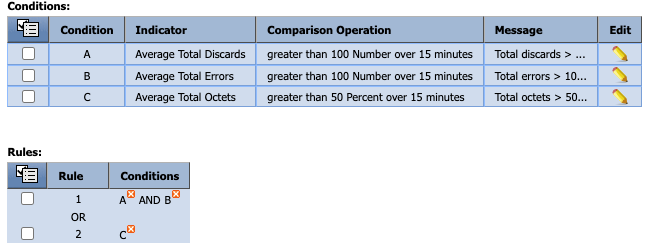
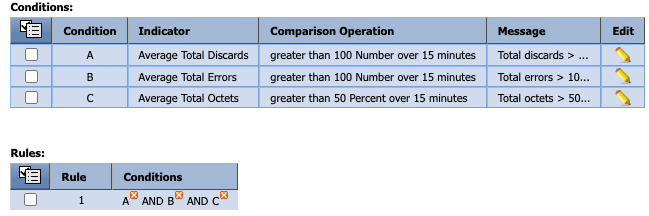
To combine several conditions as a Boolean AND operator, add all of the applicable conditions to a single rule so that the Trigger / Clear Conditions tab displays the conditions as Rule 1 | Conditions A AND B AND C, etc.
Boolean OR Operator
To combine several conditions as a Boolean OR operator, create two or more rules and add applicable conditions to the applicable rules so that the Trigger / Clear Condition tab displays the conditions for the first rule OR the conditions for the second rule, OR conditions for the third rule, etc.
-
Create 3 conditions as shown below.
-
When you create conditions A, B, and C, by default it creates Rule 1 as A AND B AND C.
-
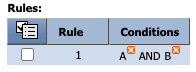
Let's say you want the rule to be A AND B OR C.
-
Under Rules, click x on
 to remove condition C from Rule 1.
-
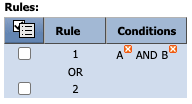
Under Rules, click
 > Create New to create a new Rule. Rule 2 gets created but no condition is assigned to it.
-
Now, select condition C under Conditions. Click
under Conditions and select Add to Rule 2 to add condition C to rule 2. Condition C is now assigned to Rule 2.